Note: With this report and data release, the National Centers for Environmental Information is transitioning to improved versions of its global land (GHCN-M version 3.3.0) and ocean (ERSST version 4.0.0) datasets. Please note that anomalies and ranks reflect the historical record according to these updated versions. Historical months and years may differ from what was reported in previous reports. For more, please visit the associated FAQ and supplemental information.
Introduction
Temperature anomalies and percentiles are shown on the gridded maps below. The anomaly map on the left is a product of a merged land surface temperature (Global Historical Climatology Network, GHCN) and sea surface temperature (ERSST.v4) anomaly analysis as described in Huang et al. (2015). Temperature anomalies for land and ocean are analyzed separately and then merged to form the global analysis. For more information, please visit NCDC's Global Surface Temperature Anomalies page. The percentile map on the right provides additional information by placing the temperature anomaly observed for a specific place and time period into historical perspective, showing how the most current month, season or year compares with the past.
The most current data may be accessed via the Global Surface Temperature Anomalies page.
Temperatures
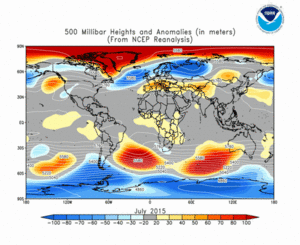
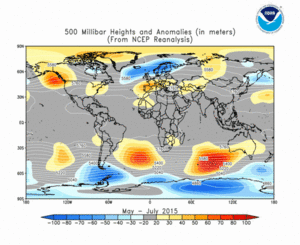
In the atmosphere, 500-millibar height pressure anomalies correlate well with temperatures at the Earth's surface. The average position of the upper-level ridges of high pressure and troughs of low pressure—depicted by positive and negative 500-millibar height anomalies on the  July 2015 and
  May–July 2015 maps—is generally reflected by areas of positive and negative temperature anomalies at the surface, respectively.
July
The combined average temperature over global land and ocean surfaces for July 2015 was the highest for July in the 136-year period of record, at 0.81°C (1.46°F) above the 20th century average of 15.8°C (60.4°F), surpassing the previous record set in 1998 by 0.08°C (0.14°F). As July is climatologically the warmest month of the year globally, this monthly global temperature of 16.61°C (61.86°F) was also the highest among all 1627 months in the record that began in January 1880. The July temperature is currently increasing at an average rate of 0.65°C (1.17°F) per century.
Separately, the July average temperature across global land surfaces was 0.96°C (1.73°F) above the 20th century average, the sixth warmest for July on record. Large regions of Earth's land surfaces were much warmer than average, according to the Land & Ocean Temperature Percentiles map above. The average temperature for Africa was the second highest for July on record, behind only 2002, with regional record warmth across much of eastern Africa into central areas of the continent. Record warmth was also observed across much of northern South America, parts of southern Europe and central Asia, and the far western United States. A large swath stretching from eastern Scandinavia into western Siberia was cooler than average, with part of western Russia much cooler than average. Cooler than average temperatures were also observed across parts of eastern and southern Asia and scattered areas in central and northern North America.
Select national information is highlighted below. (Please note that different countries report anomalies with respect to different base periods. The information provided here is based directly upon these data):
- Austria recorded its hottest July since national records began in 1767. The average temperature was 3.0°C (5.0°F) higher than the 1981–2010 average, beating the previous record of +2.7°C (+4.9°F) set just a few years earlier in 2006. Two major heatwaves, with temperatures reaching 38°C (100°F), contributed to this heat record. At some stations in major cities, including Innsbruck University, Linz, and Klagenfurt, it was not only the hottest July, but the hottest month ever recorded in the 249-year period of record. On July 7th, the daily temperature reached 38.2°C (100.8°F) in Innsbruck, its highest temperature in recorded history.
- The heat waves extended to France, where the country had its third warmest July in its 116-year period of record. Overall, the temperature was 2.1°C (3.8°F) higher than the 1981–2010 average, with localized departures of more than 4°C (7°F) in the Massif Central to the North East and the Alps, according to MeteoFrance.
- The Netherlands also experienced abnormally hot July temperatures at the beginning of the month. Under an intense heat wave that gripped much of western and central Europe, the southeastern town of Maastricht observed a temperature of 38.2°C (100.8°F) on July 2nd the highest temperature on record for that town and one of the highest for the country. The highest temperature ever recorded was 38.6°C (101.5°F) in Warnsveld in 1944. The heat did not last however. The temperature was below 0°C (32°F) at a station in Twente in the eastern part of the country on July 9th and 10th, the first time the temperature dropped below freezing in July since 1984.
- Record-breaking heat was observed in parts of the southern United Kingdom at the beginning of July, including the highest temperature recorded in the country since August 2003. However, the heat did not last as westerly Atlantic air flowed in, bringing cooler-than-average temperatures for much of the remainder of the month. So, despite the early record heat, overall, the average July temperature for the UK was 0.7°C (1.1°F) lower than the 1981–2010 average.
- Despite a heatwave over part of Sweden at the beginning of the month, temperatures remained cool for the reminder of July across much of the country. While temperatures across southeastern Sweden were slightly above average, other areas, particularly in the far north, were not. Pajala observed its coolest July since 1965 and Gaddede its coolest since 1951, although SMHI notes that the station has been relocated a few times over the years.
- Norway experienced cooler-than-average temperatures for the third consecutive month. The average July temperature was 0.7°C (1.1°F) lower than the 1961–1990 average. Temperatures were as much as 3°C (5°F) below average at some stations in Finnmark.
- A high pressure dome over the Middle East brought what may be one of the most extreme heat indices ever recorded in the world on July 31st. According to media reports, in the city of Bandar Mahshahr, the air temperature of 46°C (115°F) combined with a dew point of 32°C (90°F) for a heat index on 74°C (165°F). The highest known heat index of 81°C (178°F) occurred in Dhahran, Saudi Arabia on July 8th, 2003.
For the oceans, the July global sea surface temperature was 0.75°C (1.35°F) above the 20th century average of 16.4°C (61.5°F), the highest departure not only for July, but for any month on record. The 10 highest monthly departures from average for the oceans have all occurred in the past 16 months (since April 2014).
Related to the current strong El Niño conditions, sea surface temperatures during July were near 1.0°C (1.8°F) above the 1981–2010 average in the central equatorial Pacific Ocean, and more than 2.0°C (3.6°F) above average across the eastern Pacific, according to analysis by the NOAA Climate Prediction Center. Record warmth is notable across much of this area, as shown by the July Temperature Percentiles map above. The CPC estimates there is a greater than 90% chance that El Niño will continue through the Northern Hemisphere winter 2015/16, and around an 85% chance it will last into early spring 2016. This forecast focuses on the ocean surface temperatures between 5°N and 5°S latitude and 170°W to 120°W longitude, called the Niño 3.4 region.
Other areas across the world's ocean surfaces also experienced record warmth or much warmer-than-average conditions, including all of the Indian Ocean, most of the eastern and equatorial Pacific, various regions of the North and South Atlantic, and the Barents Sea in the Arctic. A large patch in the Atlantic Ocean south of Greenland remained much cooler than average.
| July | Anomaly | Rank (out of 136 years) | Records | ||||
|---|---|---|---|---|---|---|---|
| °C | °F | Year(s) | °C | °F | |||
| Global | |||||||
| Land | +0.96 ± 0.18 | +1.73 ± 0.32 | Warmest | 6th | 1998 | +1.11 | +2.00 |
| Coolest | 131st | 1884 | -0.68 | -1.22 | |||
| Ocean | +0.75 ± 0.07 | +1.35 ± 0.13 | Warmest | 1st | 2015 | +0.75 | +1.35 |
| Coolest | 136th | 1911 | -0.50 | -0.90 | |||
| Land and Ocean | +0.81 ± 0.14 | +1.46 ± 0.25 | Warmest | 1st | 2015 | +0.81 | +1.46 |
| Coolest | 136th | 1904, 1911 | -0.47 | -0.85 | |||
| Northern Hemisphere | |||||||
| Land | +0.92 ± 0.15 | +1.66 ± 0.27 | Warmest | 6th | 2012 | +1.24 | +2.23 |
| Coolest | 131st | 1884 | -0.70 | -1.26 | |||
| Ocean | +0.87 ± 0.04 | +1.57 ± 0.07 | Warmest | 1st | 2014, 2015 | +0.87 | +1.57 |
| Coolest | 136th | 1910 | -0.56 | -1.01 | |||
| Ties: 2014 | |||||||
| Land and Ocean | +0.89 ± 0.18 | +1.60 ± 0.32 | Warmest | 1st | 2010, 2015 | +0.89 | +1.60 |
| Coolest | 136th | 1904 | -0.56 | -1.01 | |||
| Ties: 2010 | |||||||
| Southern Hemisphere | |||||||
| Land | +1.07 ± 0.12 | +1.93 ± 0.22 | Warmest | 1st | 2015 | +1.07 | +1.93 |
| Coolest | 136th | 1894 | -0.84 | -1.51 | |||
| Ocean | +0.67 ± 0.07 | +1.21 ± 0.13 | Warmest | 1st | 2015 | +0.67 | +1.21 |
| Coolest | 136th | 1911 | -0.45 | -0.81 | |||
| Land and Ocean | +0.73 ± 0.09 | +1.31 ± 0.16 | Warmest | 1st | 2015 | +0.73 | +1.31 |
| Coolest | 136th | 1911 | -0.46 | -0.83 | |||
| Arctic | |||||||
| Land and Ocean | +0.58 ± 0.09 | +1.04 ± 0.16 | Warmest | 20th | 2010 | +1.33 | +2.39 |
| Coolest | 117th | 1904 | -0.94 | -1.69 | |||
| Ties: 2009 | |||||||
The most current data July be accessed via the Global Surface Temperature Anomalies page.
Year-to-date (January–July)
The first seven months of 2015 comprised the warmest such period on record across the world's land and ocean surfaces, at 0.85°C (1.53°F) above the 20th century average, surpassing the previous record set in 2010 by 0.09°C (0.16°F). Five months this year, including the past three, have been record warm for their respective months. January was the second warmest January on record and April third warmest.
The average global sea surface temperature of +0.67°C (+1.21°F) for the year-to-date was the highest for January–July in the 136-year period of record, surpassing the previous record of 2010 by 0.06°C (0.11°F). The average land surface temperature of +1.34°C (+2.41°F) was also the highest on record, surpassing the previous record of 2007 by 0.15°C (0.27°F).
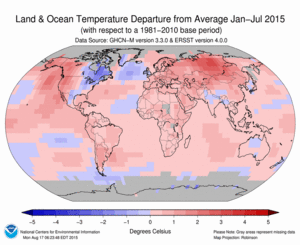
Most of the world's land areas were much warmer than average, falling within the top 10 percent of their historical temperature range for the January–July period, as indicated by the Temperature Percentiles map above. These regions include nearly all of South America, Africa, Eurasia, and western North America, with pockets of record warmth across particularly notable across southern South America and parts of central Siberia. Overall, South America was record warm for January–July and Asia was second warmest.
The oceans were also much warmer than average across vast expanses, with much of the eastern and equatorial Pacific Ocean, the Barents Sea in the Arctic, and parts of the western North Atlantic and Indian Ocean record warm. In the North Atlantic, a large region south of Greenland was much cooler than average, with some record cold embedded in that area. Over land, only part of eastern Canada was much cooler than average during the January–July.
| January–July | Anomaly | Rank (out of 136 years) | Records | ||||
|---|---|---|---|---|---|---|---|
| °C | °F | Year(s) | °C | °F | |||
| Global | |||||||
| Land | +1.34 ± 0.20 | +2.41 ± 0.36 | Warmest | 1st | 2015 | +1.34 | +2.41 |
| Coolest | 136th | 1893 | -0.80 | -1.44 | |||
| Ocean | +0.67 ± 0.04 | +1.21 ± 0.07 | Warmest | 1st | 2015 | +0.67 | +1.21 |
| Coolest | 136th | 1911 | -0.50 | -0.90 | |||
| Land and Ocean | +0.85 ± 0.10 | +1.53 ± 0.18 | Warmest | 1st | 2015 | +0.85 | +1.53 |
| Coolest | 136th | 1911 | -0.51 | -0.92 | |||
| Northern Hemisphere | |||||||
| Land | +1.47 ± 0.25 | +2.65 ± 0.45 | Warmest | 1st | 2015 | +1.47 | +2.65 |
| Coolest | 136th | 1893 | -0.89 | -1.60 | |||
| Ocean | +0.76 ± 0.04 | +1.37 ± 0.07 | Warmest | 1st | 2015 | +0.76 | +1.37 |
| Coolest | 136th | 1904, 1911 | -0.47 | -0.85 | |||
| Land and Ocean | +1.03 ± 0.15 | +1.85 ± 0.27 | Warmest | 1st | 2015 | +1.03 | +1.85 |
| Coolest | 136th | 1893 | -0.56 | -1.01 | |||
| Southern Hemisphere | |||||||
| Land | +0.99 ± 0.16 | +1.78 ± 0.29 | Warmest | 3rd | 2005, 2010 | +1.05 | +1.89 |
| Coolest | 134th | 1917 | -0.78 | -1.40 | |||
| Ties: 1998 | |||||||
| Ocean | +0.61 ± 0.04 | +1.10 ± 0.07 | Warmest | 1st | 2015 | +0.61 | +1.10 |
| Coolest | 136th | 1911 | -0.52 | -0.94 | |||
| Land and Ocean | +0.67 ± 0.08 | +1.21 ± 0.14 | Warmest | 1st | 2010, 2015 | +0.67 | +1.21 |
| Coolest | 136th | 1911 | -0.54 | -0.97 | |||
| Ties: 2010 | |||||||
| Arctic | |||||||
| Land and Ocean | +1.79 ± 0.27 | +3.22 ± 0.49 | Warmest | 1st | 2015 | +1.79 | +3.22 |
| Coolest | 136th | 1888, 1966 | -1.30 | -2.34 | |||
The most current data July be accessed via the Global Surface Temperature Anomalies page.
Precipitation
July
The maps below represent precipitation percent of normal (left, using a base period of 1961–1990) and precipitation percentiles (right, using the period of record) based on the GHCN dataset of land surface stations. As is typical, precipitation anomalies during July 2015 varied significantly around the world.
Select national information is highlighted below. (Please note that different countries report anomalies with respect to different base periods. The information provided here is based directly upon these data):
- The Southwest Indian monsoon season lasts from June to September. In 2015, the monsoon made its annual onset over Kerala on June 5th, just a few days later than normal. During July, monthly rainfall for all of India was 85 percent of the 1951–2000 average, with regional extremes ranging from 54 percent of average over the South Peninsula to 105 percent of average in northwest India. Cumulative rainfall for the entire monsoon period to date (June–July) was 97 percent of average.
References
- Peterson, T.C. and R.S. Vose, 1997: An Overview of the Global Historical Climatology Network Database. Bull. Amer. Meteorol. Soc., 78, 2837-2849.
- Huang, B., V.F. Banzon, E. Freeman, J. Lawrimore, W. Liu, T.C. Peterson, T.M. Smith, P.W. Thorne, S.D. Woodruff, and H-M. Zhang, 2015: Extended Reconstructed Sea Surface Temperature Version 4 (ERSST.v4). Part I: Upgrades and Intercomparisons. J. Climate, 28, 911-930.
 NOAA's National Centers for Environmental Information


