Use the form below to select from a collection of monthly summaries recapping climate-related occurrences on both a global and national scale.
Global Climate ReportAnnual 2014
Global Climate
Global Climate
Global Climate
Global Climate
Global Climate
Global Climate
Global Climate
Global Climate
Global Climate
Global Climate
Global Climate
Global Climate
Global Climate
Global Climate
Global Climate
Global Climate
Global Climate
Global Climate
Global Climate
Global Climate
Global Climate
Global Climate
Global Climate
Global Climate
Global Climate
Global Climate
Global Climate
Global Climate
Global Climate
Global Climate
Global Climate
Global Climate
Global Climate
Global Climate
Global Climate
Global Climate
Global Climate
Global Climate
Global Climate
Global Climate
Global Climate
Global Climate
Global Climate
Global Climate
Global Climate
Global Climate
Global Climate
Global Climate
Global Climate
Global Climate
Global Climate
Global Climate
Global Climate
Global Climate
Global Climate
Global Climate
Global Climate
Global Climate
Global Climate
Global Climate
Global Climate
Global Climate
Global Climate
Global Climate
Global Climate
Global Climate
Global Climate
Global Climate
Global Climate
Global Climate
Global Climate
Global Climate
Global Climate
Global Climate
Global Climate
Global Climate
Global Climate
Global Climate
Global Climate
Global Climate
Global Climate
Global Climate
Global Climate
Global Climate
Global Climate
Global Climate
Global Climate
Global Climate
Global Climate
Global Climate
Global Climate
Global Climate
Global Climate
Global Climate
Global Climate
Global Climate
Global Climate
Global Climate
Global Climate
Global Climate
Global Climate
Global Climate
Global Climate
Global Climate
Global Climate
Global Climate
Global Climate
Global Climate
Global Climate
Global Climate
Global Climate
Global Climate
Global Climate
Global Climate
Global Climate
Global Climate
Global Climate
Global Climate
Global Climate
Global Climate
Global Climate
Global Climate
Global Climate
Global Climate
Global Climate
Global Climate
Global Climate
Global Climate
Global Climate
Global Climate
Global Climate
Global Climate
Global Climate
Global Climate
Global Climate
Global Climate
Global Climate
Global Climate
Global Climate
Global Climate
Global Climate
Global Climate
Global Climate
Global Climate
Global Climate
Global Climate
Global Climate
Global Climate
Global Climate
Global Climate
Global Climate
Global Climate
Global Climate
Global Climate
Global Climate
Global Climate
Global Climate
Global Climate
Global Climate
Global Climate
Global Climate
Global Climate
Global Climate
Global Climate
Global Climate
Global Climate
Global Climate
Global Climate
Global Climate
Global Climate
Global Climate
Global Climate
Global Climate
Global Climate
Global Climate
Global Climate
Global Climate
Global Climate
Global Climate
Global Climate
Global Climate
Global Climate
Global Climate
Global Climate
Global Climate
Global Climate
Global Climate
Global Climate
Global Climate
Global Climate
Global Climate
Global Climate
Global Climate
Global Climate
Global Climate
Global Climate
Global Climate
Global Climate
Global Climate
Global Climate
Global Climate
Global Climate
Global Climate
Global Climate
Global Climate
Global Climate
Global Climate
Global Climate
Global Climate
Global Climate
Global Climate
Global Climate
Global Climate
Global Climate
Global Climate
Global Climate
Global Climate
Global Climate
Global Climate
Global Climate
Global Climate
Global Climate
Global Climate
Global Climate
Global Climate
Global Climate
Global Climate
Global Climate
Global Climate
Global Climate
Global Climate
Global Climate
Global Climate
Global Climate
Global Climate
Global Climate
Global Climate
Global Climate
Global Climate
Global Climate
Global Climate
Global Climate
Global Climate
Global Climate
Global Climate
Global Climate
Global Climate
Global Climate
Global Climate
Global Climate
Global Climate
Global Climate
Global Climate
Global Climate
Global Climate
Global Climate
Global Climate
Global Climate
Global Climate
Global Climate
Global Climate
Global Climate
Global Climate
Global Climate
Global Climate
Global Climate
Global Climate
Global Climate
Global Climate
Global Climate
Global Climate
Global Climate
Global Climate
Global Climate
Global Climate
Global Climate
Global Climate
Global Climate
Global Climate
Global Climate
Global Climate
Global Climate
Global Climate
Global Climate
Global Climate
Global Climate
Global Climate
Global Climate
Global Climate
Global Climate
Global Climate
Global Climate
Global Climate
Global Climate
Global Climate
Global Climate
Global Climate
Global Climate
Global Climate
Global Climate
Global Climate
Global Climate
Global Climate
Global Climate
Global Climate
Global Climate
Global Climate
Global Climate
Global Climate
Global Climate
Global Climate
Global Climate
Global Climate
Global Climate
Global Climate
Global Climate
Global Climate
Global Climate
Global Climate
Global Climate
Global Climate
Global Climate
Global Climate
Global Climate
Global Climate
Global Climate
Global Climate
Global Climate
Global Climate
Global Climate
Global Climate
Global Climate
Global Climate
Global Climate
Global Climate
Global Climate
Global Climate
Global Climate
Global Climate
Global Climate
Global Climate
Global Climate
Global Climate
Global Climate
Global Climate
Global Climate
Global Climate
Global Climate
Global Climate
Global Climate
Global Climate
Global Climate
Global Climate
Global Climate
Global Climate
Global Climate
Global Climate
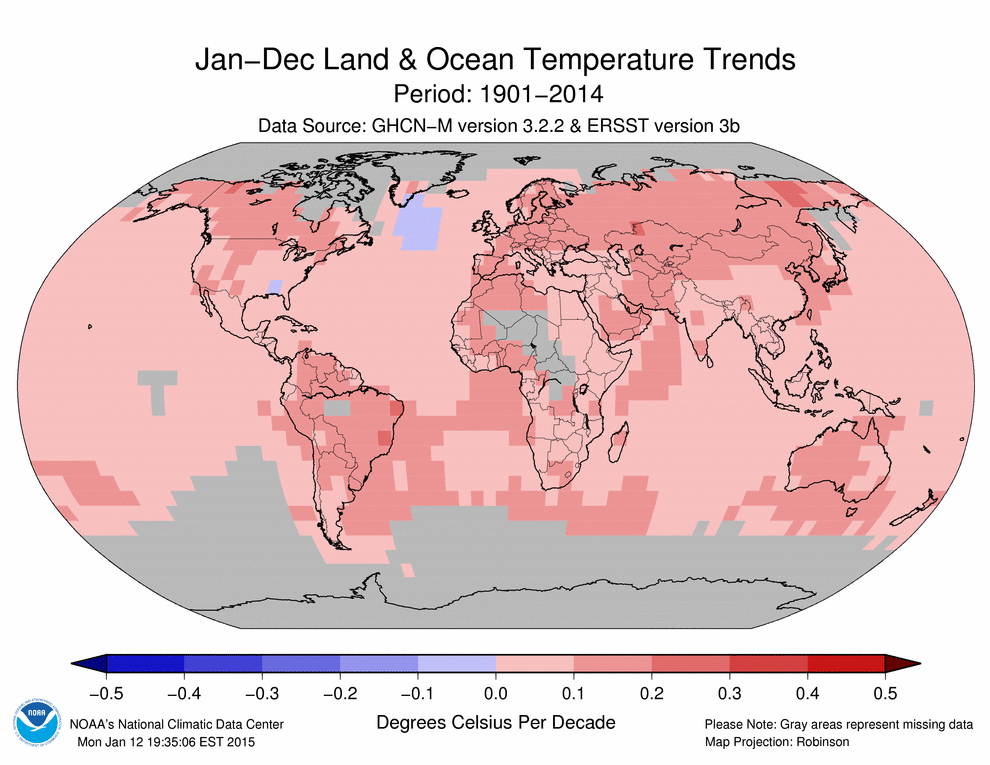
Global Temperature Trends, Updated through 2014
The following maps show the temperature trend for each qualifying grid point since the beginning of the 20th century (top) and the last 30 years (bottom). The temperature trend is the average rate of increase or decrease at the grid point over the time period of interest. It is determined by simple linear regression through the data available for each grid point. They are expressed in degrees Celsius per decade. For the rate in degrees Celsius per century, multiply by 10.
To be eligible for inclusion on the top map, a grid point must have at least two-thirds of possible years available (this works out to at least 76 years). For the bottom map, a higher standard of eligibility - 80% - is enforced. This works out to 24 of the 30 possible years present.

Temperature trends since 1901
(all grids with at least 76 years, or two-thirds of possible years, present)

Temperature trends since 1985
(all grids with at least 24 years present during the period)
 NOAA's National Centers for Environmental Information
