Global Highlights
- The combined average temperature over global land and ocean surfaces for January was the warmest since 2007 and the fourth warmest on record at 12.7°C (54.8°F), or 0.65°C (1.17°F) above the 20th century average of 12.0°C (53.6°F). The margin of error associated with this temperature is ± 0.08°C (± 0.14°F).
- The global land temperature was the highest since 2007 and the fourth highest on record for January, at 1.17°C (2.11°F) above the 20th century average of 2.8°C (37.0°F). The margin of error is ± 0.18°C (± 0.32°F).
- For the ocean, the January global sea surface temperature was 0.46°C (0.83°F) above the 20th century average of 15.8°C (60.5°F), the highest since 2010 and seventh highest on record for January. The margin of error is ± 0.04°C (± 0.07°F).
Introduction
Temperature anomalies and percentiles are shown on the gridded maps below. The anomaly map on the left is a product of a merged land surface temperature (Global Historical Climatology Network, GHCN) and sea surface temperature (ERSST.v3b) anomaly analysis developed by Smith et al. (2008). Temperature anomalies for land and ocean are analyzed separately and then merged to form the global analysis. For more information, please visit NCDC's Global Surface Temperature Anomalies page. The January 2014 Global State of the Climate report includes percentile maps that complement the information provided by the anomaly maps. These maps on the right provide additional information by placing the temperature anomaly observed for a specific place and time period into historical perspective, showing how the most current month, season, or year-to-date compares with the past.
Temperatures
In the atmosphere, 500-millibar height pressure anomalies correlate well with temperatures at the Earth's surface. The average position of the upper-level ridges of high pressure and troughs of low pressure—depicted by positive and negative 500-millibar height anomalies on the  January 2014 map—is generally reflected by areas of positive and negative temperature anomalies at the surface, respectively.
January
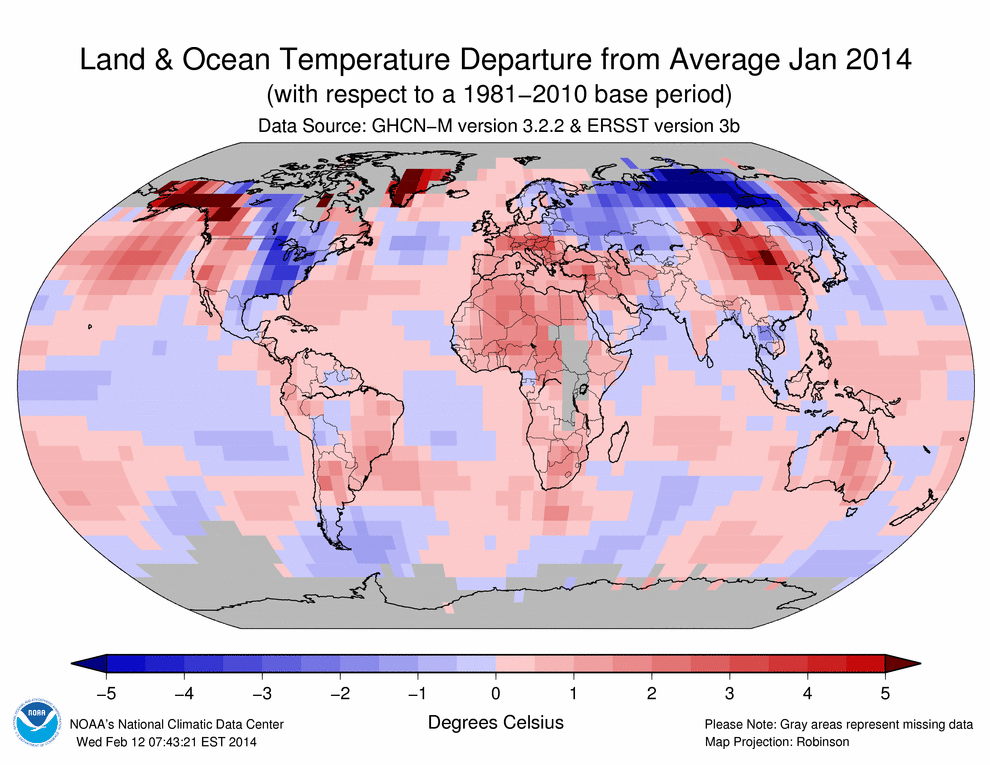

The combined global land and ocean average temperature during January 2014 was 0.65°C (1.17°F) above the 20th century average. This was the warmest January since 2007 and the fourth highest since records began in 1880. This marks the ninth consecutive month (since May 2013) with a global monthly temperature among the 10 highest for its respective month. The Northern Hemisphere land and ocean surface temperature during January 2014 was also the warmest since 2007 and the fourth warmest since records began in 1880 at 0.75°C (1.35°F) above average. The Southern Hemisphere January 2014 temperature departure of +0.55°C (+0.99°F) was the warmest since 2010 and the fourth warmest January on record.
During January 2014, most of the world's land areas experienced warmer-than-average temperatures, with the most notable departures from the 1981–2010 average across Alaska, western Canada, Greenland, Mongolia, southern Russia, and northern China, where the departure from average was +3°C (+5.4°F) or greater. Meanwhile, parts of southeastern Brazil and central and southern Africa experienced record warmth with temperature departures between 0.5°C to 1.5°C above the 1981–2010 average, contributing to the highest January Southern Hemisphere land temperature departure on record at 1.13°C (2.03°F) above the 20th century average. This was also the warmest month for the Southern Hemisphere land since September 2013 when temperatures were 1.23°C (2.21°F) above the 20th century average. Some locations across the globe experienced departures that were below the 1981–2010 average. These areas include the eastern half of the contiguous U.S., central Canada, and most of Scandinavia and Russia. The most notable cold anomalies were in Russia, where in some areas the departure from average was 5°C (9°F) below average. Overall, the Northern Hemisphere land surface temperature was 1.17°C (2.11°F) above average—the warmest January since 2007 and the fourth warmest since records began in 1880.
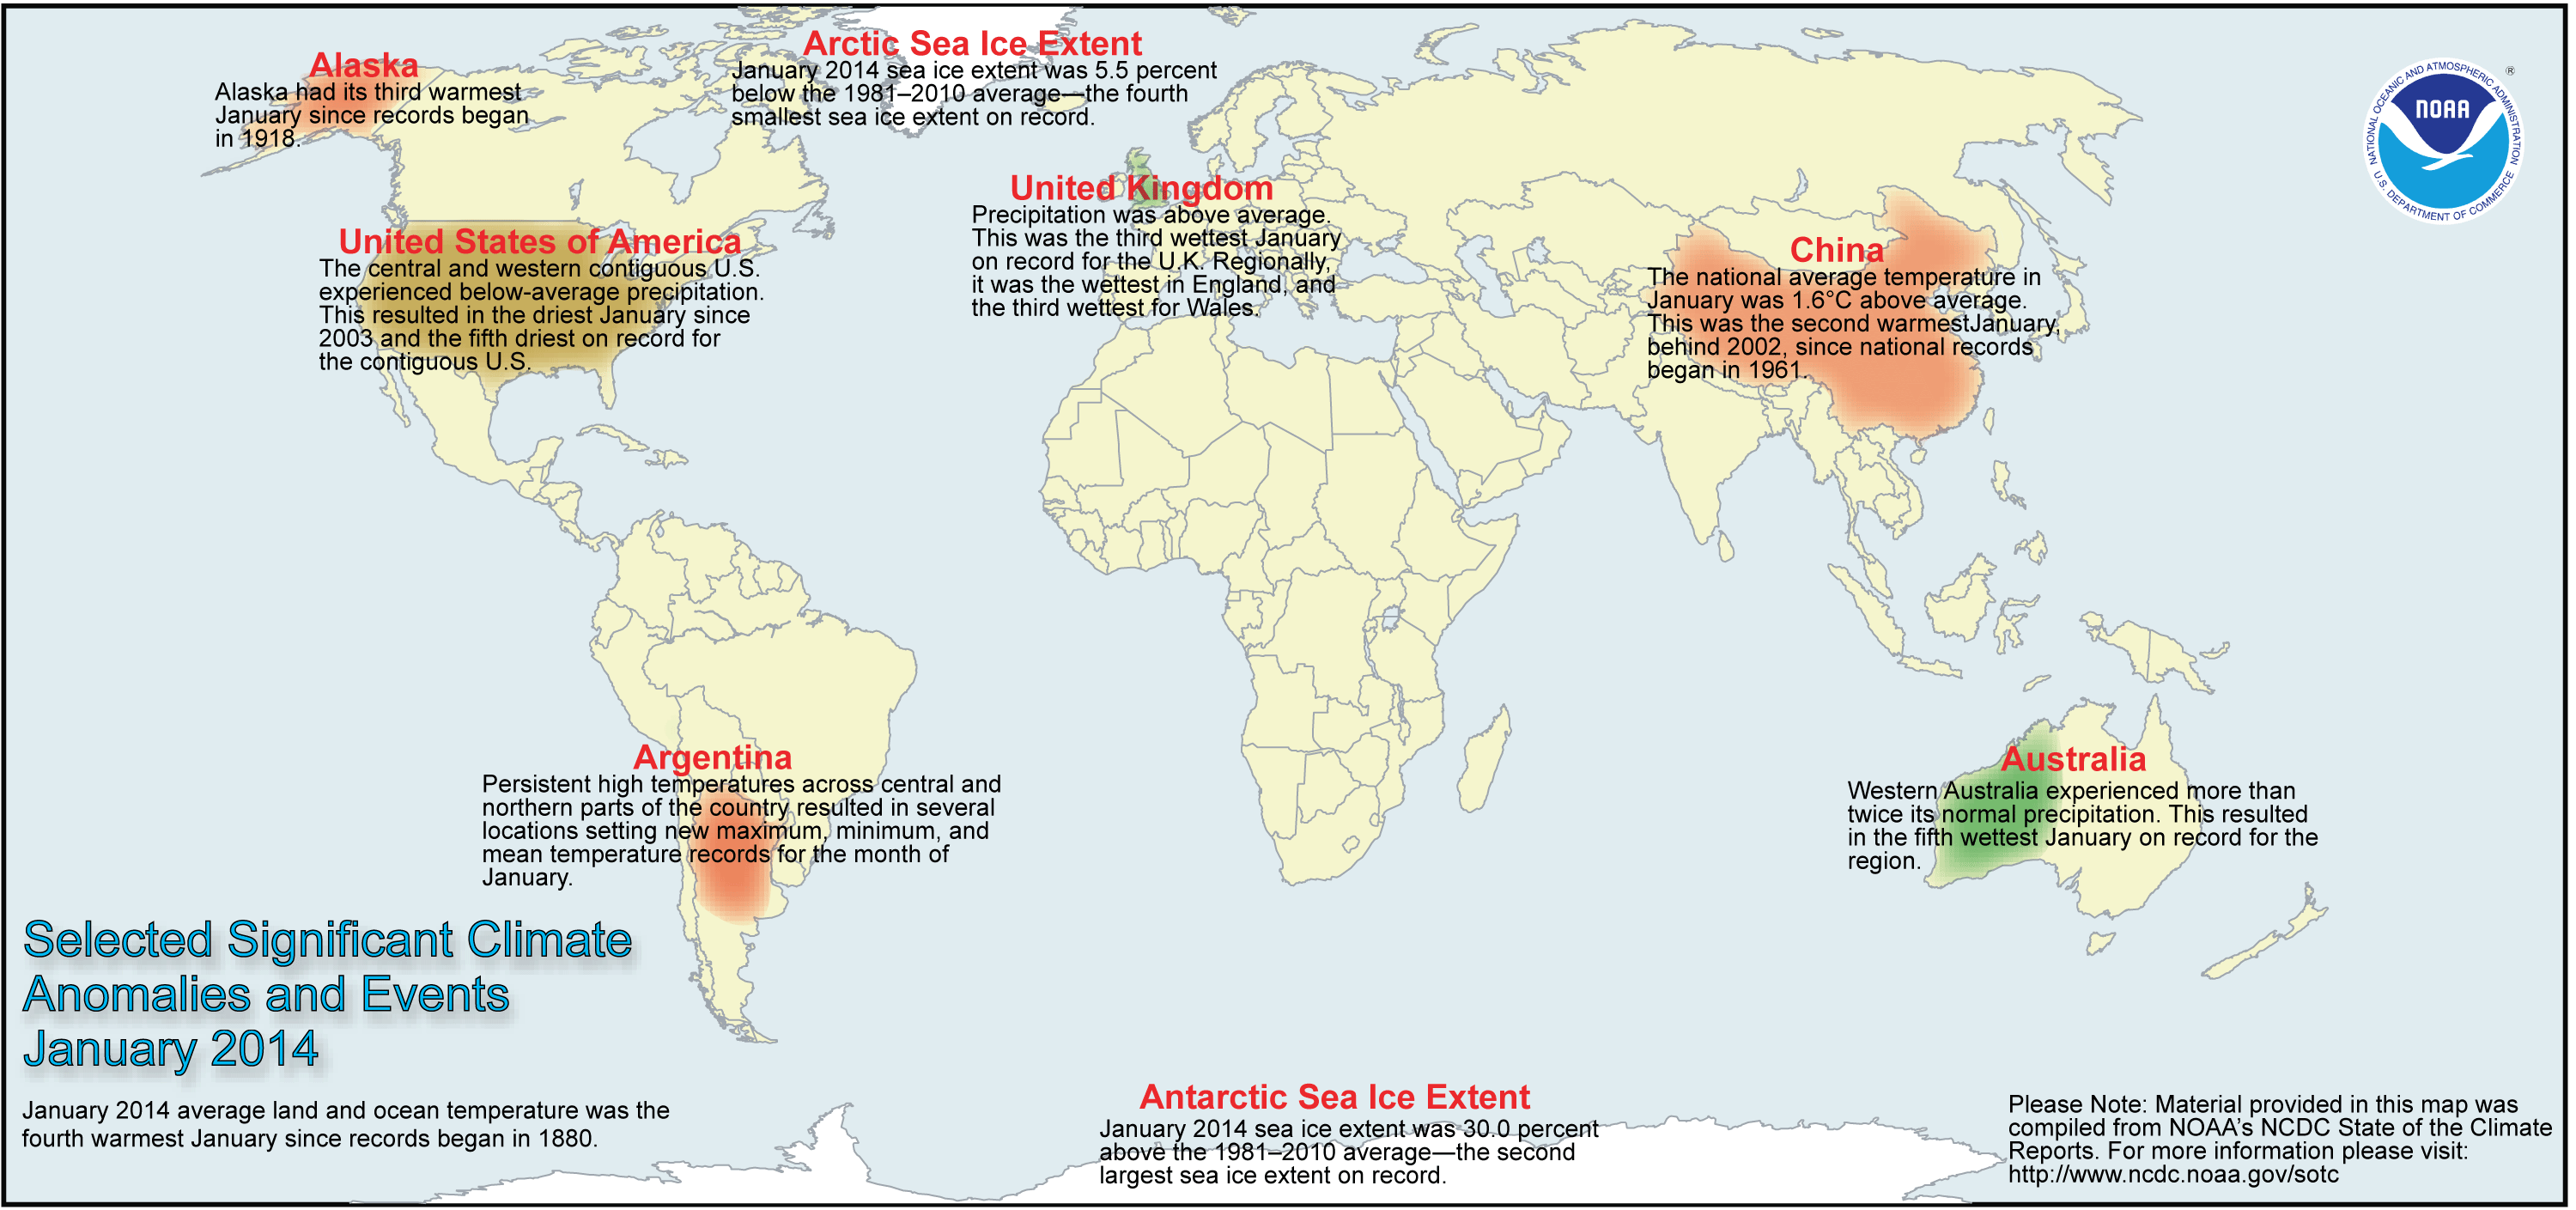
Select national information is highlighted below. (Please note that different countries report anomalies with respect to different base periods. The information provided here is based directly upon these data):
- France's nationally-averaged January 2014 temperature was 2.7°C (4.9°F) above the 1981–2010 average, tying with 1988 and 1936 as the warmest January on record.
- Spain experienced its warmest January since 1996 and the third warmest since national records began in 1961, with a temperature of 9°C (48.2°F) or 2°C (3.6°F) above the 1971–2000 average.
- The January temperature in Switzerland was 2.4°C (4.3°F) above the 1981–2010 average—the fifth warmest January since national records began 150 years ago.
- Austria experienced its fifth warmest January since national records began in 1768. The nationally-averaged temperature was 3.3°C (5.9°F) above the 1981–2010 average. However, in some regions across the southern parts of the country, the temperatures were the highest on record. In Klagenfurt, the temperature departure was 5°C (9°F)—the highest since January 1813.
- China, as a whole, recorded an average temperature of -3.4°C (25.9°F) or 1.6°C (2.9°F) above average during January 2014. This was the second highest January value, behind 2002, since national records began in 1961.
- In Argentina, persistence of extremely high temperatures across central and northern parts of the country resulted in several locations setting new maximum, minimum, and mean temperature records for the month of January.
- Warm temperatures engulfed much of Australia during January 2014. Overall, the national average mean temperature was 0.91°C (1.64°F) above the 1961–1990 average. This was the 12th highest January temperature since national records began in 1910. Regionally, the January 2014 temperature ranked among the top 10 warmest in Queensland, Victoria, and South Australia.
Across the oceans, temperature departures tend to be smaller than across the land surfaces. According to the percentiles map, much-warmer-than-average conditions were present across parts of the Atlantic Ocean, the northeastern and western Pacific Ocean, and parts of the Indian Ocean. Record warmth was observed across parts of the northern Pacific Ocean (south of Alaska), parts of the western Pacific Ocean, south of South Africa, and across parts of the Atlantic Ocean. Overall, the global ocean surface temperature in January was +0.46°C (+0.83°F)—the warmest since 2010 and the seventh warmest on record.
| January | Anomaly | Rank (out of 135 years) | Records | ||||
|---|---|---|---|---|---|---|---|
| °C | °F | Year(s) | °C | °F | |||
| Global | |||||||
| Land | +1.17 ± 0.18 | +2.11 ± 0.32 | Warmest | 4th | 2007 | +1.83 | +3.29 |
| Coolest | 132nd | 1893 | -1.97 | -3.55 | |||
| Ocean | +0.46 ± 0.04 | +0.83 ± 0.07 | Warmest | 7th | 1998 | +0.56 | +1.01 |
| Coolest | 129th | 1904 | -0.47 | -0.85 | |||
| Land and Ocean | +0.65 ± 0.08 | +1.17 ± 0.14 | Warmest | 4th | 2007 | +0.85 | +1.53 |
| Coolest | 132nd | 1893 | -0.73 | -1.31 | |||
| Northern Hemisphere | |||||||
| Land | +1.19 ± 0.24 | +2.14 ± 0.43 | Warmest | 7th | 2007 | +2.27 | +4.09 |
| Coolest | 129th | 1893 | -2.53 | -4.55 | |||
| Ocean | +0.48 ± 0.08 | +0.86 ± 0.14 | Warmest | 5th | 1998 | +0.54 | +0.97 |
| Coolest | 131st | 1904 | -0.50 | -0.90 | |||
| Ties: 2004 | |||||||
| Land and Ocean | +0.75 ± 0.13 | +1.35 ± 0.23 | Warmest | 4th | 2007 | +1.19 | +2.14 |
| Coolest | 132nd | 1893 | -1.26 | -2.27 | |||
| Southern Hemisphere | |||||||
| Land | +1.13 ± 0.15 | +2.03 ± 0.27 | Warmest | 1st | 2014 | +1.13 | +2.03 |
| Coolest | 135th | 1904 | -0.85 | -1.53 | |||
| Ocean | +0.45 ± 0.04 | +0.81 ± 0.07 | Warmest | 11th | 1998 | +0.59 | +1.06 |
| Coolest | 125th | 1911 | -0.48 | -0.86 | |||
| Land and Ocean | +0.55 ± 0.06 | +0.99 ± 0.11 | Warmest | 4th | 1998, 2010 | +0.63 | +1.13 |
| Coolest | 132nd | 1904, 1911 | -0.49 | -0.88 | |||
| Arctic | |||||||
| Land and Ocean | +0.69 ± 0.69 | +1.24 ± 1.24 | Warmest | 37th | 1981 | +4.40 | +7.92 |
| Coolest | 99th | 1893 | -2.61 | -4.70 | |||
| Ties: 1887 | |||||||


The most current data may be accessed via the Global Surface Temperature Anomalies page.
Precipitation
The maps below represent precipitation percent of normal (left) and precipitation percentiles (right) based on the GHCN dataset of land surface stations using a base period of 1961–1990. Precipitation varied greatly around the globe during January. Much-drier-than-average conditions were present across the southern and southwestern contiguous U.S., northeastern Brazil, parts of Chile, southern China, and parts of southeastern Australia and central Africa. Much-wetter-than-average conditions were observed across northern Argentina, northwestern Africa, central Russia, and the British Isles.
Select national information is highlighted below. (Please note that different countries report anomalies with respect to different base periods. The information provided here is based directly upon these data):
- The central and western contiguous U.S. experienced below-average precipitation. This resulted in the driest January since 2003 and the fifth driest on record for the contiguous United States.
- Precipitation was above average across the United Kingdom. The nation received 51% above-average precipitation during January, marking the third wettest January on record. Regionally, it was the wettest January in England, with 91% above average precipitation. Wales had its wettest January since 1948 and the third wettest January since records began in 1910 at 71% above average.
- Averaged nationally, precipitation was 17% above average in Australia during January 2014. However, most of the precipitation was concentrated in Western Australia, which experienced more than twice its normal precipitation—the fifth wettest January on record for the region.


References
- Peterson, T.C. and R.S. Vose, 1997: An Overview of the Global Historical Climatology Network Database. Bull. Amer. Meteorol. Soc., 78, 2837-2849.
- Quayle, R.G., T.C. Peterson, A.N. Basist, and C. S. Godfrey, 1999: An operational near-real-time global temperature index. Geophys. Res. Lett., 26, 333-335.
- Smith, T.M. and R.W. Reynolds, 2005: A global merged land air and sea surface temperature reconstruction based on historical observations (1880-1997), J. Clim., 18, 2021-2036.
- Smith et al., 2008, Improvements to NOAA's Historical Merged Land-Ocean Surface Temperature Analysis (1880-2006), J. Climate., 21, 2283-2293.