
Global Highlights
- The combined average temperature over global land and ocean surfaces for September 2013 tied with 2003 as the fourth highest for September on record, at 0.64°C (1.15°F) above the 20th century average of 15.0°C (59.0°F).
- The global land surface temperature was 0.89°C (1.60°F) above the 20th century average of 12.0°C (53.6°F), marking the sixth warmest September on record. For the ocean, the September global sea surface temperature was 0.54°C (0.97°F) above the 20th century average of 16.2°C (61.1°F), tying with 2006 as the fourth highest for September on record.
- The combined global land and ocean average surface temperature for the January–September period (year-to-date) was 0.60°C (1.08°F) above the 20th century average of 14.1°C (57.5°F), tying with 2003 as the sixth warmest such period on record.
Introduction
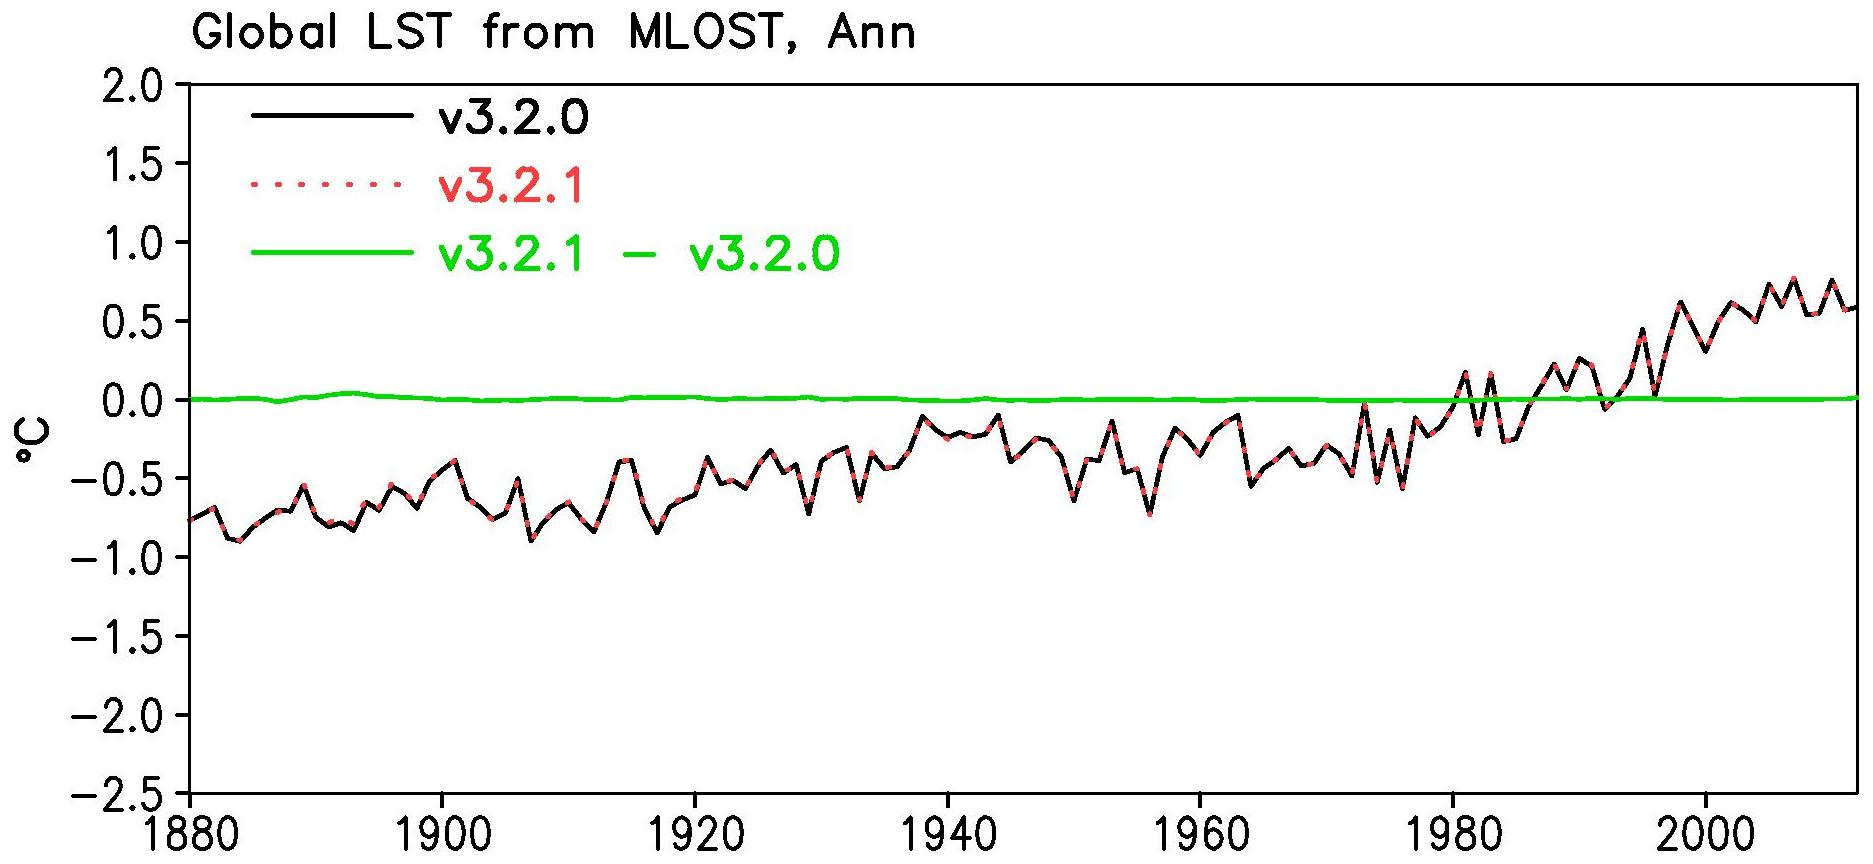
Temperature anomalies and percentiles are shown on the gridded maps below. The anomaly map on the left is a product of a merged land surface temperature (Global Historical Climatology Network, GHCN) and sea surface temperature (ERSST.v3b) anomaly analysis developed by Smith et al. (2008). Temperature anomalies for land and ocean are analyzed separately and then merged to form the global analysis. For more information, please visit NCDC's Global Surface Temperature Anomalies page. The September 2013 Global State of the Climate report includes percentile maps that complement the information provided by the anomaly maps. These maps on the right provide additional information by placing the temperature anomaly observed for a specific place and time period into historical perspective, showing how the most current month, season, or year-to-date compares with the past.
Temperatures
In the atmosphere, 500-millibar height pressure anomalies correlate well with temperatures at the Earth's surface. The average position of the upper-level ridges of high pressure and troughs of low pressure—depicted by positive and negative 500-millibar height anomalies on the  September 2013 map—is generally reflected by areas of positive and negative temperature anomalies at the surface, respectively.
September


The globally-averaged temperature across land and ocean surfaces combined was 0.64°C (1.15°F) higher than the 20th century average, tying with 2003 as the fourth warmest September since records began in 1880. The six warmest Septembers on record have all occurred since 2003 (2005 is currently record warmest). September 2013 also marks the fifth consecutive month (since May 2013) with monthly-average global temperatures ranking among the six highest for their respective months.
Considering land surfaces only, the globally-averaged temperature was the sixth highest on record for September, at 0.89°C (1.60°F) above average. Even with cooler-than-average temperatures in much of southern South America and much-cooler-than-average temperatures in eastern South Africa, the Southern Hemisphere was record warm for the month, with an average land temperature that was 1.20°C (2.16°F) higher than average, the third highest monthly anomaly for any month (behind August 2008 and November 2009) in this hemisphere in the 134-year period of record. This warmth was due largely to record-high temperatures observed across most of the Australian continent (see national highlights below for more details). Although not quite as dramatic, the average Northern Hemisphere temperature was also well above the 20th century average, at 0.77°C (1.39°F) above average and ranking as the 10th highest for September on record. As indicated by the Land & Ocean Percentiles map above, record warmth was observed across part of central Asia, stretching into southern Asia and the Middle East, as well as part of southwestern Canada. Most of central and northern North America, northern Europe, and much of central and southern Asia were much warmer than average. Cooler and much-cooler-than-average temperatures occurred across much of central and eastern Russia, along with most of eastern Europe and western Greenland.
Select national information is highlighted below. (Please note that different countries report anomalies with respect to different base periods. The information provided here is based directly upon these data):- Australia reported its warmest September since national records began in 1910, at 2.75°C (4.95°F) above the 1961–1990 average. The nationally-averaged maximum and minimum temperatures were 3.41°C (6.14°F) and 2.09°C (3.76°F) above average, also record high. Every state and territory across the country had average, maximum, and minimum September temperatures that ranked among their 10 highest, with record warmth for all three in South Australia. The average temperature was record high in every state and territory, with the exception of Tasmania (third highest) and Western Australia (fourth highest). According to the Bureau of Meteorology, this record-warm month contributed to a record-warm 12-month period (October 2012 to September 2013), marking the second month in a row that the 12-month mean temperature record has been broken.
- Norway reported its sixth warmest September in the country's 113-year period of record, with an average temperature 2.0°C (3.6°F) above the 1981–2010 average. For the first time since local records began in 1829, the town of Vardo in far northeastern Norway recorded an average September temperature above 10°C (50°F).
- September was warmer than average across all of Finland, with monthly temperatures 1°–3°C (1.8°–5.4°F) higher than the1981–2010 average. In northern Finland, Lapland observed its warmest September in the past 50 years (since 1963).
- It was also warmer than average across Spain, with the average monthly temperature 1.2°C (2.2°F) above the 1971–2000 average for September. Far northwestern Spain, most notably in and around the region of Galicia, observed temperatures 2°–3°C (3°–5°F) higher than average.
Averaged across the world's oceans, September 2013 tied with 2006 as the fourth highest September temperature, at 0.54°C (0.97°F) above the 20th century average of 16.2°C (61.1°F). ENSO-neutral conditions remained entrenched in the central and eastern Pacific Ocean for the 17th straight month. According to NOAA's Climate Prediction Center (CPC), this marks the longest stretch of neutral conditions since 1992–1994, when similar conditions prevailed for 26 consecutive months. The CPC expects ENSO-neutral conditions to continue into the Northern Hemisphere spring 2014. As shown by the September Land & Ocean Percentiles map, most other regions of the global oceans were warmer to much warmer than average. Parts of the Barents Sea in the Arctic region and some scattered areas across the Pacific and Indian Oceans were record warm. A small section of the eastern Pacific Ocean off the coast of Ecuador and the oceans south of South America were much cooler than average. Images of sea surface temperature conditions are available for all weeks during 2013 from the weekly SST page.
| September | Anomaly | Rank (out of 134 years) | Records | ||||
|---|---|---|---|---|---|---|---|
| °C | °F | Year(s) | °C | °F | |||
| Global | |||||||
| Land | +0.89 ± 0.25 | +1.60 ± 0.45 | Warmest | 6th | 2009 | +1.06 | +1.91 |
| Coolest | 129th | 1912 | -0.76 | -1.37 | |||
| Ocean | +0.54 ± 0.04 | +0.97 ± 0.07 | Warmest | 4th | 2003 | +0.58 | +1.04 |
| Coolest | 131st | 1912 | -0.45 | -0.81 | |||
| Ties: 2006 | |||||||
| Land and Ocean | +0.64 ± 0.11 | +1.15 ± 0.20 | Warmest | 4th | 2005 | +0.68 | +1.22 |
| Coolest | 131st | 1912 | -0.54 | -0.97 | |||
| Ties: 2003 | |||||||
| Northern Hemisphere | |||||||
| Land | +0.77 ± 0.25 | +1.39 ± 0.45 | Warmest | 10th | 2005 | +1.19 | +2.14 |
| Coolest | 125th | 1912 | -0.91 | -1.64 | |||
| Ocean | +0.61 ± 0.04 | +1.10 ± 0.07 | Warmest | 4th | 2003 | +0.67 | +1.21 |
| Coolest | 131st | 1912 | -0.56 | -1.01 | |||
| Land and Ocean | +0.67 ± 0.15 | +1.21 ± 0.27 | Warmest | 6th | 2005 | +0.83 | +1.49 |
| Coolest | 129th | 1912 | -0.70 | -1.26 | |||
| Southern Hemisphere | |||||||
| Land | +1.20 ± 0.17 | +2.16 ± 0.31 | Warmest | 1st | 2013 | +1.20 | +2.16 |
| Coolest | 134th | 1894 | -0.71 | -1.28 | |||
| Ocean | +0.49 ± 0.05 | +0.88 ± 0.09 | Warmest | 6th | 1997 | +0.57 | +1.03 |
| Coolest | 129th | 1911 | -0.51 | -0.92 | |||
| Land and Ocean | +0.61 ± 0.09 | +1.10 ± 0.16 | Warmest | 2nd | 1997 | +0.65 | +1.17 |
| Coolest | 133rd | 1911 | -0.54 | -0.97 | |||
| Arctic | |||||||
| Land and Ocean | +0.39 ± 0.20 | +0.70 ± 0.36 | Warmest | 23rd | 2006 | +1.20 | +2.16 |
| Coolest | 112th | 1992 | -1.03 | -1.85 | |||
| Ties: 1880 | |||||||


The most current data may be accessed via the Global Surface Temperature Anomalies page.
Year-to-date (January–September)

The globally-averaged temperature for the first nine months of 2013 (January–September) was 0.60°C (1.08°F) above the 20th century average of 14.1°C (57.5°F), tying with 2003 as the sixth warmest such period since records began in 1880. The average global land temperature for this period was the seventh warmest on record, at 0.93°C (1.67°F) above the long-term average. Notably, Australia, the southern Philippines, and part of central Asia were record warm for January–September. The average global ocean temperature for the first nine months of 2013 was also the seventh warmest in the 134-year period of record, at 0.48°C (0.86°F) above average. ENSO-neutral conditions were present in the eastern and central equatorial Pacific Ocean during the entire year-to-date (this phase began in April 2012). The record warmest January–September (0.68°C / 1.22°F above average) occurred in both 1998 and 2010, when warm El Niño phases were present during January–April before transitioning to La Niña conditions during the summer.
| January–September | Anomaly | Rank (out of 134 years) | Records | ||||
|---|---|---|---|---|---|---|---|
| °C | °F | Year(s) | °C | °F | |||
| Global | |||||||
| Land | +0.93 ± 0.22 | +1.67 ± 0.40 | Warmest | 7th | 2007 | +1.10 | +1.98 |
| Coolest | 128th | 1885 | -0.63 | -1.13 | |||
| Ocean | +0.48 ± 0.04 | +0.86 ± 0.07 | Warmest | 7th | 1998 | +0.55 | +0.99 |
| Coolest | 128th | 1911 | -0.49 | -0.88 | |||
| Ties: 2009 | |||||||
| Land and Ocean | +0.60 ± 0.11 | +1.08 ± 0.20 | Warmest | 6th | 1998, 2010 | +0.68 | +1.22 |
| Coolest | 129th | 1911 | -0.48 | -0.86 | |||
| Ties: 2003 | |||||||
| Northern Hemisphere | |||||||
| Land | +0.94 ± 0.26 | +1.69 ± 0.47 | Warmest | 8th | 2007 | +1.24 | +2.23 |
| Coolest | 127th | 1884 | -0.73 | -1.31 | |||
| Ties: 2000 | |||||||
| Ocean | +0.51 ± 0.06 | +0.92 ± 0.11 | Warmest | 5th | 2005, 2010 | +0.56 | +1.01 |
| Coolest | 130th | 1910, 1913 | -0.48 | -0.86 | |||
| Land and Ocean | +0.67 ± 0.16 | +1.21 ± 0.29 | Warmest | 7th | 2010 | +0.77 | +1.39 |
| Coolest | 128th | 1904, 1913 | -0.50 | -0.90 | |||
| Southern Hemisphere | |||||||
| Land | +0.91 ± 0.14 | +1.64 ± 0.25 | Warmest | 2nd | 2005 | +0.93 | +1.67 |
| Coolest | 133rd | 1917 | -0.64 | -1.15 | |||
| Ocean | +0.46 ± 0.04 | +0.83 ± 0.07 | Warmest | 10th | 1998 | +0.58 | +1.04 |
| Coolest | 125th | 1911 | -0.52 | -0.94 | |||
| Land and Ocean | +0.53 ± 0.07 | +0.95 ± 0.13 | Warmest | 7th | 1998 | +0.63 | +1.13 |
| Coolest | 128th | 1911 | -0.53 | -0.95 | |||
| Arctic | |||||||
| Land and Ocean | +0.72 ± 0.13 | +1.30 ± 0.23 | Warmest | 15th | 2011 | +1.43 | +2.57 |
| Coolest | 120th | 1902 | -1.04 | -1.87 | |||


The most current data may be accessed via the Global Surface Temperature Anomalies page.
Precipitation
The maps below represent precipitation percent of normal (left) and precipitation percentiles (right) based on the GHCN dataset of land surface stations using a base period of 1961–1990. As is typical, precipitation anomalies during September 2013 varied significantly around the world. As indicated by the September precipitation percentiles map below, part of the central United States, sections of western Russia, and far southwestern Australia were record wet during September. Record dryness was present among regions that included areas in northern europe, regions in southwestern Asia and northern and far southern Africa, parts of northern Australia, and north central Chile.
- With average precipitation at 60 percent of normal for the month, Norway had its 10th driest September since national records began in 1900.
- Scotland observed 70 percent of its average (1981–2010) rainfall, marking its driest September since 2003.
- Sweden experienced precipitation extremes on both ends during September. Some regions in northern Sweden had their wettest September on record, while some areas in the south observed their driest September since 1875, according to SMHI, Sweden's national meteorological agency.
- Two tropical storm systems, Hurricane Ingrid in the North Atlantic hurricane basin and Tropical Storm Manuel in the Eastern Pacific, both made landfall over Mexico on September 16th, bringing torrential rainfall and flooding to large parts of the country. This is the first time since 1958 that two storms in separate basins have hit the country within a 24-hour period.


References
Peterson, T.C. and R.S. Vose, 1997: An Overview of the Global Historical Climatology Network Database. Bull. Amer. Meteorol. Soc., 78, 2837-2849.
Quayle, R.G., T.C. Peterson, A.N. Basist, and C. S. Godfrey, 1999: An operational near-real-time global temperature index. Geophys. Res. Lett., 26, 333-335.
Smith, T.M. and R.W. Reynolds, 2005: A global merged land air and sea surface temperature reconstruction based on historical observations (1880-1997), J. Clim., 18, 2021-2036.
Smith et al., 2008, Improvements to NOAA's Historical Merged Land-Ocean Surface Temperature Analysis (1880-2006), J. Climate., 21, 2283-2293.