Global Highlights
- The average combined global land and ocean surface temperature for December 2013 was the third highest for December since records began in 1880, at 0.64°C (1.15°F) above the 20th century average of 12.2°C (54.0°F).
- The globally-averaged land surface temperature for December 2013 tied with 1998 as the fifth highest for December on record, at 1.16°C (2.09°F) above average. The globally-averaged ocean surface temperature tied with 2004 as the seventh highest for December on record, at 0.46°C (0.83°F) above average.
- The average combined global land and ocean surface temperature for January–December 2013 tied with 2003 as the fourth warmest such period on record, at 0.62°C (1.12°F) above the 20th century average.
Introduction
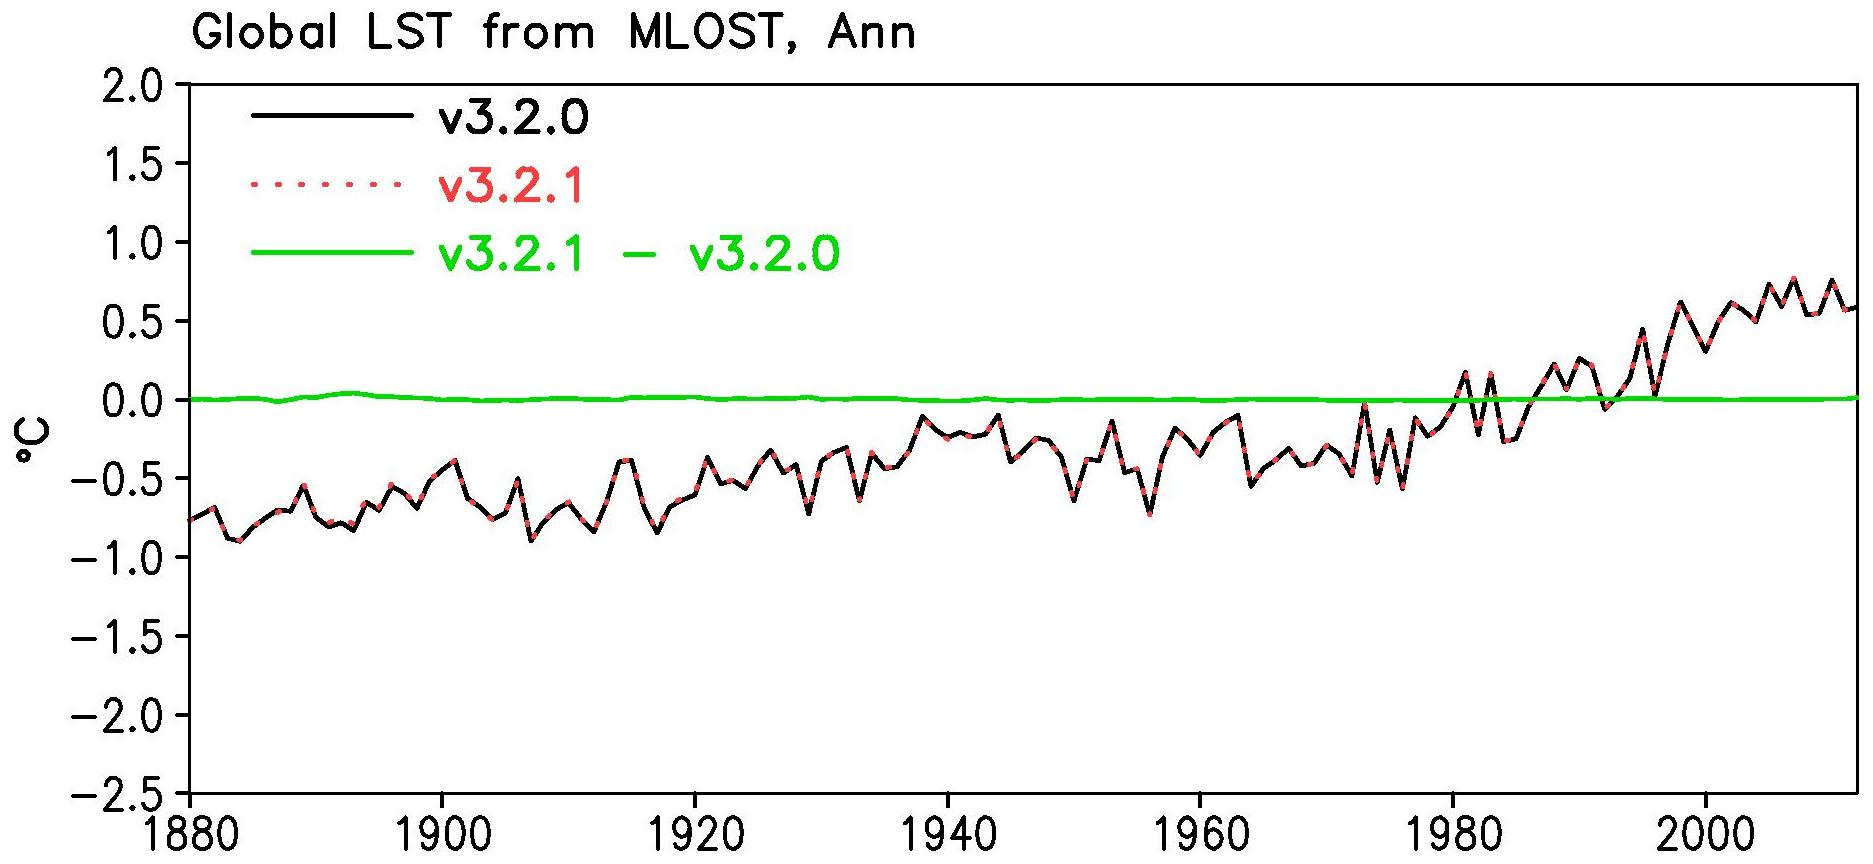
Temperature anomalies and percentiles are shown on the gridded maps below. The anomaly map on the left is a product of a merged land surface temperature (Global Historical Climatology Network, GHCN) and sea surface temperature (ERSST.v3b) anomaly analysis developed by Smith et al. (2008). Temperature anomalies for land and ocean are analyzed separately and then merged to form the global analysis. For more information, please visit NCDC's Global Surface Temperature Anomalies page. The December 2013 Global State of the Climate report introduces percentile maps that complement the information provided by the anomaly maps. These new maps on the right provide additional information by placing the temperature anomaly observed for a specific place and time period into historical perspective, showing how the most current month, season or year compares with the past.
Temperatures
In the atmosphere, 500-millibar height pressure anomalies correlate well with temperatures at the Earth's surface. The average position of the upper-level ridges of high pressure and troughs of low pressure—depicted by positive and negative 500-millibar height anomalies on the  December 2013 map—is generally reflected by areas of positive and negative temperature anomalies at the surface, respectively.
December

The December 2013 globally-averaged temperature across land and ocean surfaces was 0.64°C (1.15°F) above the 20th century average of 12.2°C (54.0°F), the third highest for December since records began in 1880. This also marks the eighth consecutive month (since May 2013) with a global monthly temperature ranking among the top 10 highest for its respective month.
The global land surface temperature anomaly was 1.12°C (2.02°F) higher than average, tying with 1998 as fifth highest on record for the month of December. The Southern Hemisphere was second warmest for the month over land, behind only the record high temperature set just last year in December 2012. The Northern Hemisphere had its seventh highest December temperature in the 134-year period of record. This stands in sharp contrast to December 2012, when the average temperature for the hemisphere ranked 70th, a good example of how variable temperature over land surfaces can be. Across the globe, record warmth was observed across parts of central and eastern Russia, where temperature anomalies exceeded 5°C (9°F) across a large swath of the country. Record warmth was also present in various areas of coastal and southern Africa, and sections of southern South America. It was much cooler than average across parts of central and eastern Canada, the west coast of the United States, southern Greenland, part of southeastern Asia, and most of the Middle East, with record cold temperatures (more than 5°C / 9°F below average according to the December Land & Ocean Temperatures Percentiles map above) observed around eastern Turkey and northern Iraq.
Select national information is highlighted below:- Following its record warmest November, Russia observed yet another record-warm monthly temperature that was 4.6°C (8.3°F) higher than the 1961–1990 December average, making this Russia's warmest November–December period in the 114-year period of record. Moscow and St. Petersburg broke their daily maiximum temperature records on December 25th by 0.4°C (0.7°F) and an impressive 1.4°C (2.5°F), respectively.
- Belarus observed a monthly December temperature 3.7°C (6.7°F) above the 1961–1990 average.
- The area-averaged temperature across Australia for December was above average with respect to both minimum and maximum temperature. The Northern Territory was the only region to observe below-average daily temperatures for the month. According to the Bureau of Meteorology, the overall warmth for December marks the 17th consecutive month with an above-average national temperature. This means that every month of the calendar year 2013 was warmer than average.
- The December temperature for the United Kingdom was 1.8°C (3.2°F) above the 1981–2010 average, making this the warmest December for the region since 1988. It was the fifth warmest December for Scotland since records began in 1910, with a temperature departure from average of +2.3°C (+4.1°F).
- It was the second warmest December for Denmark on record, behind 2006, at 3.7°C (6.7°F) above the 1961–1990 average. According to DMI, the warmest temperatures were observed in the extreme west of the country, particularly western Jutland.
- December was 4.2°C (7.6°F) warmer than the 1981–2010 average for Norway, the eighth highest December temperature since national records began in 1900. Some stations in Østfold, Akershus, Hedmark, Oppland and Buskerud were 8.6°C (15.5°F) above their long-term averages.
- The Netherlands was also warmer than average during December. De Bilt reported a temperature that was 2.1°C (3.8°F) above the 1981–2010 average for the month, tying as the sixth warmest December since records began in 1901. Additionally, according to KNMI, only five days of frost (minimum temperature below 0°C / 32°F) were reported in this region for the month, compared with the average of 13. No ice days (maximum temperature below 0°C / 32°F) were reported, compared with an average of two.
- Austria as a whole was 1.5°C (2.7°F) above the 1981–2010 average for December, with the warmest temperature departures from average (+3.1°C / +5.6°F) observed in the high alpine regions and on mountain tops, according to ZAMG. This marks the second warmest December, behind 2006, since the high alpine temperature record began in 1851.
- Prevailing westerly and southwesterly flows brought mild air masses to Germany throughout December, according to Deutscher Wetterdienst. With national receords dating back to 1881, the country reported its 10th warmest December, with a temperature that was 2.4°C (4.3°F) above the 1981–2010 monthly average.
- With records dating back to 1947, Hong Kong observed its coolest December since 1975, with an average temperature 1.8°C (3.2°F) below the 1981–2010 average.
- It was colder than average across all of Canada during December. Northern Ontario observed monthly temperatures as much as 7.2°C (13.0°F) below the 1971–2000 average. Sioux Lookout, Dryden, Kenora and Thunder Bay set record-cold monthly average temperatures for December, with Thunder Bay recording its coldest December day on record on the 31st, at -39.8°C (-39.6°F), surpassing the previous record of -37.8°C (-36.0°F), set on December 13th,, 1976.
The December 2013 globally-averaged ocean temperature anomaly of 0.46°C (0.83°F) tied with 2004 as the seventh warmest on record for December. For the 20th straight month, ENSO-neutral conditions persisted, with near-average sea surface temperatures (SST) across much of the equatorial Pacific Ocean. According to NOAA's Climate Prediction Center, neutral conditions are favored to continue into the Northern Hemisphere summer 2014. In other regions, it was notably warmer than average in the much of the Indian Oceam, the northern and southwestern Pacific Ocean, and various regions of the Atlantic Ocean. Some record warmth was also observed in each of these regions. Parts of the northwestern Atlantic Ocean and some regions of the Southern Ocean were cooler than average during December. In particular, waters to the South of South America were much cooler than average. Images of sea surface temperature conditions are available for all weeks during 2013 from the weekly SST page.
| December | Anomaly | Rank (out of 134 years) | Records | ||||
|---|---|---|---|---|---|---|---|
| °C | °F | Year(s) | °C | °F | |||
| Global | |||||||
| Land | +1.12 ± 0.11 | +2.02 ± 0.20 | Warmest | 5th | 2003 | +1.42 | +2.56 |
| Coolest | 130th | 1929 | -1.27 | -2.29 | |||
| Ties: 1998 | |||||||
| Ocean | +0.46 ± 0.04 | +0.83 ± 0.07 | Warmest | 7th | 1997, 2009 | +0.58 | +1.04 |
| Coolest | 128th | 1909 | -0.53 | -0.95 | |||
| Ties: 2004 | |||||||
| Land and Ocean | +0.64 ± 0.08 | +1.15 ± 0.14 | Warmest | 3rd | 2006 | +0.76 | +1.37 |
| Coolest | 132nd | 1916 | -0.57 | -1.03 | |||
| Northern Hemisphere | |||||||
| Land | +1.21 ± 0.11 | +2.18 ± 0.20 | Warmest | 7th | 1939 | +1.78 | +3.20 |
| Coolest | 128th | 1929 | -1.60 | -2.88 | |||
| Ocean | +0.46 ± 0.06 | +0.83 ± 0.11 | Warmest | 8th | 2009 | +0.60 | +1.08 |
| Coolest | 127th | 1909 | -0.58 | -1.04 | |||
| Land and Ocean | +0.74 ± 0.09 | +1.33 ± 0.16 | Warmest | 6th | 2006 | +0.99 | +1.78 |
| Coolest | 129th | 1917 | -0.75 | -1.35 | |||
| Southern Hemisphere | |||||||
| Land | +0.87 ± 0.11 | +1.57 ± 0.20 | Warmest | 2nd | 2012 | +0.91 | +1.64 |
| Coolest | 133rd | 1909 | -0.77 | -1.39 | |||
| Ocean | +0.48 ± 0.04 | +0.86 ± 0.07 | Warmest | 5th | 1997 | +0.62 | +1.12 |
| Coolest | 130th | 1910 | -0.48 | -0.86 | |||
| Ties: 1972, 2001, 2006 | |||||||
| Land and Ocean | +0.54 ± 0.06 | +0.97 ± 0.11 | Warmest | 4th | 1997 | +0.66 | +1.19 |
| Coolest | 131st | 1909 | -0.51 | -0.92 | |||
| Ties: 2003 | |||||||
| Arctic | |||||||
| Land and Ocean | +2.28 ± 0.67 | +4.10 ± 1.21 | Warmest | 5th | 2006 | +2.75 | +4.95 |
| Coolest | 130th | 1916 | -2.68 | -4.82 | |||


Year-to-date (January–December)

The  January–December map of temperature anomalies shows that warmer-than-average temperatures occurred across the vast majority of the globe during 2013. Global temperatures were influenced by ENSO-neutral conditions throughout the year, along with eight months (February, May–July, and September–December) of global land surface temperatures that ranked among the top 10 for their respective months. No month during 2013 ranked lower than 17th warmest (April) during the year. Overall, the 2013 worldwide combined land and ocean surface temperature was 0.62°C (1.12°F) above the 20th century average, tying with 2003 as the fourth warmest year on record. This temperature anomaly is 0.04°C (0.07°F) less than the record warmth of 2010. Separately, the 2013 average global land surface temperature was also the fourth highest on record and the ocean surface temperature tied with 2006 as the eighth highest.
Record warmth was observed across much of southern and western Australia, southwestern Ethiopia, eastern Tanzania, part of central Asia around Kazakhstan and Uzbekistan, a large section of the southwestern Pacific Ocean, and small regions of the Arctic, central Pacific, and central Indian Oceans. Also noteworthy, it was much warmer than average across many other land and ocean regions all across the globe. Temperatures were cooler than average across part of the central United States, a region where record warmth prevailed in 2012, along with small sections of the eastern Pacific Ocean and the Southern Ocean off the tip of South America. No record cold regions were observed for the January–December 2013 period. Please refer to the NCDC State of the Climate Annual Global Analysis report for more detailed information.
| January–December | Anomaly | Rank (out of 134 years) | Records | ||||
|---|---|---|---|---|---|---|---|
| °C | °F | Year(s) | °C | °F | |||
| Global | |||||||
| Land | +0.99 ± 0.19 | +1.78 ± 0.34 | Warmest | 4th | 2007 | +1.09 | +1.96 |
| Coolest | 131st | 1884 | -0.59 | -1.06 | |||
| Ocean | +0.48 ± 0.03 | +0.86 ± 0.05 | Warmest | 8th | 1998, 2003 | +0.52 | +0.94 |
| Coolest | 127th | 1909, 1910 | -0.45 | -0.81 | |||
| Ties: 2006 | |||||||
| Land and Ocean | +0.62 ± 0.09 | +1.12 ± 0.16 | Warmest | 4th | 2010 | +0.66 | +1.19 |
| Coolest | 131st | 1909, 1911 | -0.43 | -0.77 | |||
| Ties: 2003 | |||||||
| Northern Hemisphere | |||||||
| Land | +1.02 ± 0.25 | +1.84 ± 0.45 | Warmest | 4th | 2007 | +1.22 | +2.20 |
| Coolest | 131st | 1884 | -0.70 | -1.26 | |||
| Ocean | +0.51 ± 0.05 | +0.92 ± 0.09 | Warmest | 5th | 2005 | +0.55 | +0.99 |
| Coolest | 130th | 1910 | -0.47 | -0.85 | |||
| Land and Ocean | +0.71 ± 0.14 | +1.28 ± 0.25 | Warmest | 4th | 2010 | +0.77 | +1.39 |
| Coolest | 131st | 1912 | -0.46 | -0.83 | |||
| Southern Hemisphere | |||||||
| Land | +0.89 ± 0.11 | +1.60 ± 0.20 | Warmest | 3rd | 2005, 2009 | +0.91 | +1.64 |
| Coolest | 132nd | 1917 | -0.62 | -1.12 | |||
| Ocean | +0.47 ± 0.03 | +0.85 ± 0.05 | Warmest | 9th | 1998 | +0.54 | +0.97 |
| Coolest | 126th | 1911 | -0.46 | -0.83 | |||
| Ties: 2004, 2005 | |||||||
| Land and Ocean | +0.54 ± 0.06 | +0.97 ± 0.11 | Warmest | 6th | 1998 | +0.59 | +1.06 |
| Coolest | 129th | 1911 | -0.46 | -0.83 | |||
| Ties: 2005 | |||||||
| Arctic | |||||||
| Land and Ocean | +0.91 ± 0.12 | +1.64 ± 0.22 | Warmest | 11th | 2007 | +1.42 | +2.56 |
| Coolest | 124th | 1902 | -1.28 | -2.30 | |||

The most current data may be accessed via the Global Surface Temperature Anomalies page.
Images of sea surface temperature conditions are available for all weeks during 2013 from the weekly SST page.
Precipitation
The maps below represent precipitation percent of normal (left) and precipitation percentiles (right) based on the GHCN dataset of land surface stations using a base period of 1961–1990. As is typical, precipitation anomalies during December 2013 varied significantly around the world.

- Heavy rainfall during December 14th–17th contributed to Hong Kong's 10th wettest December since records began in 1884.
- Norway observed its second wettest December in the country's 114-year period of record, behind only 1975, at 180 percent of normal. Rogaland and Hordaland had precipitation totals 300–400 percent of their December averages.
- In the United Kingdom, Scotland had its wettest December since records began in 1910, with 181 percent of average precipitation for the month.
- Many states in Brazil observed record rainfall during December. At least seven cities set new records by 27 December. According to Brazil's National Meteorology Institute, in southeastern Brazil in the state of Minas Gerais, the city of Aimores received more than four times its average rainfall for the month.
References
- Peterson, T.C. and R.S. Vose, 1997: An Overview of the Global Historical Climatology Network Database. Bull. Amer. Meteorol. Soc., 78, 2837-2849.
- Quayle, R.G., T.C. Peterson, A.N. Basist, and C. S. Godfrey, 1999: An operational near-real-time global temperature index. Geophys. Res. Lett., 26, 333-335.
- Smith, T.M. and R.W. Reynolds, 2005: A global merged land air and sea surface temperature reconstruction based on historical observations (1880-1997), J. Clim., 18, 2021-2036.
- Smith et al., 2008, Improvements to NOAA's Historical Merged Land-Ocean Surface Temperature Analysis (1880-2006), J. Climate., 21, 2283-2293.