Global Highlights
- The combined average temperature over global land and ocean surfaces for March 2013 tied with 2006 as the 10th warmest on record, at 0.58°C (1.04°F) above the 20th century average of 12.3°C (54.1°F).
- The global land surface temperature was 1.06°C (1.91°F) above the 20th century average of 5.0°C (40.8°F), the 11th warmest March on record. For the ocean, the March global sea surface temperature was 0.41°C (0.74°F) above the 20th century average of 15.9°C (60.7°F), making it the ninth warmest March on record.
- The combined global land and ocean average surface temperature for the January–March period (year-to-date) was 0.58°C (1.04°F) above the 20th century average of 12.3°C (54.1°F), the eighth warmest such period on record.
Introduction
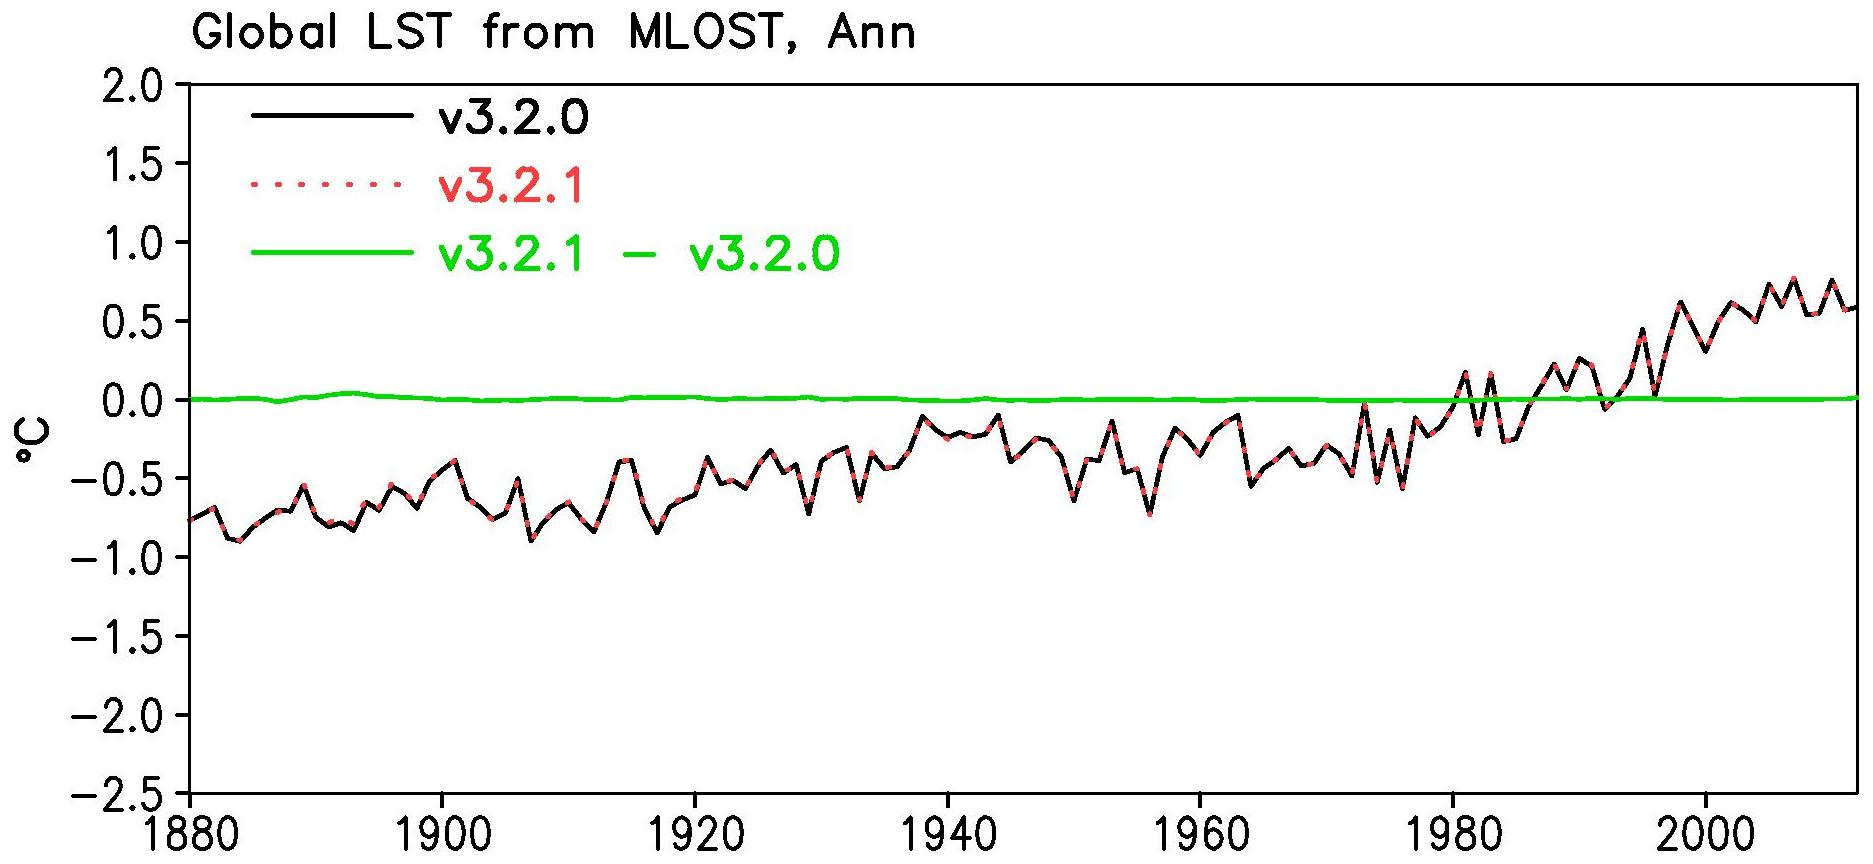
Temperature anomalies and percentiles are shown on the gridded maps below. The anomaly map on the left is a product of a merged land surface temperature (Global Historical Climatology Network, GHCN) and sea surface temperature (ERSST.v3b) anomaly analysis developed by Smith et al. (2008). Temperature anomalies for land and ocean are analyzed separately and then merged to form the global analysis. For more information, please visit NCDC's Global Surface Temperature Anomalies page. The March 2013 Global State of the Climate report introduces percentile maps that complement the information provided by the anomaly maps. These new maps on the right provide additional information by placing the temperature anomaly observed for a specific place and time period into historical perspective, showing how the most current month, season or year compares with the past.
Temperatures
In the atmosphere, 500-millibar height pressure anomalies correlate well with temperatures at the Earth's surface. The average position of the upper-level ridges of high pressure and troughs of low pressure—depicted by positive and negative 500-millibar height anomalies on the  March 2013 map—is generally reflected by areas of positive and negative temperature anomalies at the surface, respectively.
March

The globally-averaged temperature across the world's land and ocean surfaces was 0.58°C (1.04°F) above the 20th century average of 12.7°C (54.9°F), tying with 2006 as the 10th warmest March since records began in 1880. Both the Northern and Southern Hemispheres were also 10th warmest for March.
Globally, land surface temperatures were 1.06°C (1.91°F) above average (11th warmest on record), but there were some marked temperature anomaly differences around the world. The Arctic Oscillation (AO), a large-scale climate pattern that can influence temperatures in the Northern Hemisphere, was strongly negative during the month, and in fact reached a monthly-averaged record low for March. This negative phase was associated with frigid Arctic air spilling southward into the Northern Hemisphere middle latitudes. Particularly, it was either cooler or much cooler than average across the eastern half of the United States as well as most of Europe, European Russia, and northern Siberia, according to the Global Land & Ocean Temperature Percentiles map above. Parts of northeastern Europe and western Russia observed temperatures that were at least 5°C (9°F) lower than average. This phase of the AO also contributed to much warmer than average and even record warm temperatures in northeastern Canada and southeastern Greenland. A large swath of China also saw record warm temperatures. Parts of these regions were at least 5°C (9°F) above average. Additionally, several regions in central and northern Africa in the 0°–20°N latitude belt were record warm. Overall, the 20°N–20°S global tropical latitude belt was the third warmest on record for that region during March, at 1.18°C (2.12°F) above average. Most of northern Africa, along with northern South America and northern Australia, were also much warmer than average. In the Southern Hemisphere, Argentina observed temperatures that were cooler to much cooler than average.
Select national information is highlighted below:- Above-average temperatures continued for Australia during March. The monthly nationally-averaged maximum temperature was 0.66°C (1.18°F) above the 1961–1990 average. The state of Tasmania was record warm (2.86°C / 5.15°F above average), shattering the previous record of +1.94°C (+3.49°F) set in 1971. For the eighth month in a row (since August 2012), every state and territory across the country had an above-average monthly maximum temperature. The nationally-averaged March minimum temperature was 0.82°C (1.47°F) above average, with Victoria, Tasmania, South Australia, and the Northern Territory observing their top 10 warmest Marches on record.
- High pressure systems brought above-average March temperatures to most of New Zealand. The nationally-averaged March temperature was 0.9°C (1.6°F) above the 1971–2010 average, with temperatures more than 1.2°C (2.2°F) above average across northern and central areas of the North Island and southern and western parts of the South Island.
- The UK experienced its coldest March since 1962 (tied for second coldest since records began in 1910), with the average temperature 3.3°C (5.9°F) below the 1981–2010 average. It was also the coolest of any month since December 2010. No region was warmer than average for the the month.
- In Norway, the average March temperature was 3.0°C (5.4°F) below the 1971–2000 average. The largest negative departures of 4°–6°C (7°–11°F) occurred at the higher altitudes of southern Norway and Finnmark plateau, according to Meteorologisk institutt.
- Germany observed its fifth coolest March since records began in 1881 and second coolest in the past 50 years, with the monthly average temperature 4.2°C (7.6°F) below the 1981–2010 average.
- March was cooler than average across all of Hungary, with temperatures up to 3°C (5.4°F) below normal for the month. The coolest anomalies were observed across the northern tier of the country.
- It was the second warmest March for China, behind 2008, since records began in 1961. According to the Beijing Climate Center, the provinces of Chongqing, Gansu, Guangxi, Guizhou, Hunan, Jiangxi, Ningxia, Qinghai, Shanxi, Shaanxi, Sichuan, Xinjiang, and Yunnan reported record warmth for the month. Northern and eastern Xinjiang, Gansu, far western Inner Mongolia, Shaanxi, western, eastern Sichuan, and Guizhou provinces observed temperatures that were 4°–6°C (7°–11°F) above the 1981–2010 average.
- March was generally warmer than average across Japan. Eastern and western Japan, along with Okinawa and Amami, had temperatures that were "significantly above normal", according to the Japan Meteorological Agency.
The global ocean temperature was among the ten warmest for March, ranking ninth in the 134-year period of record at 0.41°C (0.74°F) above the 20th century average. Across the central and eastern equatorial Pacific Ocean, neither El Niño nor La Niña conditions were present during March, with sea surface temperatures slightly above average across the eastern half of the equatorial Pacific. According to NOAA's Climate Prediction Center, neutral conditions are favored into the Northern Hemisphere summer 2013. Associated with a persistent negative phase of the Pacific Decadal Oscillation, temperatures were cooler than average across the northeastern Pacific Ocean. Images of sea surface temperature conditions are available for all weeks during 2013 from the weekly SST page.
| March | Anomaly | Rank (out of 134 years) | Records | ||||
|---|---|---|---|---|---|---|---|
| °C | °F | Year(s) | °C | °F | |||
| Global | |||||||
| Land | +1.06 ± 0.13 | +1.91 ± 0.23 | Warmest | 11th | 2008 | +1.92 | +3.46 |
| Coolest | 124th | 1898 | -1.61 | -2.90 | |||
| Ocean | +0.41 ± 0.04 | +0.74 ± 0.07 | Warmest | 9th | 1998, 2010 | +0.56 | +1.01 |
| Coolest | 126th | 1911 | -0.53 | -0.95 | |||
| Land and Ocean | +0.58 ± 0.07 | +1.04 ± 0.13 | Warmest | 10th | 2010 | +0.80 | +1.44 |
| Coolest | 125th | 1898 | -0.65 | -1.17 | |||
| Ties: 2006 | |||||||
| Northern Hemisphere | |||||||
| Land | +1.17 ± 0.17 | +2.11 ± 0.31 | Warmest | 13th | 2008 | +2.39 | +4.30 |
| Coolest | 122nd | 1898 | -1.99 | -3.58 | |||
| Ocean | +0.40 ± 0.06 | +0.72 ± 0.11 | Warmest | 8th | 2010 | +0.53 | +0.95 |
| Coolest | 127th | 1908 | -0.51 | -0.92 | |||
| Land and Ocean | +0.69 ± 0.09 | +1.24 ± 0.16 | Warmest | 10th | 2008 | +1.10 | +1.98 |
| Coolest | 125th | 1898 | -0.87 | -1.57 | |||
| Ties: 2006 | |||||||
| Southern Hemisphere | |||||||
| Land | +0.80 ± 0.16 | +1.44 ± 0.29 | Warmest | 10th | 2010 | +1.22 | +2.20 |
| Coolest | 125th | 1904 | -0.89 | -1.60 | |||
| Ocean | +0.42 ± 0.05 | +0.76 ± 0.09 | Warmest | 12th | 1998 | +0.61 | +1.10 |
| Coolest | 123rd | 1911 | -0.57 | -1.03 | |||
| Ties: 2007 | |||||||
| Land and Ocean | +0.48 ± 0.08 | +0.86 ± 0.14 | Warmest | 10th | 2010 | +0.69 | +1.24 |
| Coolest | 125th | 1911 | -0.58 | -1.04 | |||
| Ties: 1988, 2006 | |||||||
| Arctic | |||||||
| Land and Ocean | -0.23 ± 0.18 | -0.41 ± 0.32 | Warmest | 77th | 1990 | +3.54 | +6.37 |
| Coolest | 58th | 1902 | -3.69 | -6.64 | |||
The most current data may be accessed via the Global Surface Temperature Anomalies page.
Year-to-date (January–March)

With ENSO-neutral conditions holding during the first three months of 2013, the January–March global temperature across land and ocean surfaces was the eighth warmest on record, at 0.58°C (1.04°F) above the 20th century average. The global land temperature ranked seventh warmest, with the Southern Hemisphere observing its second warmest such period, behind 2010, and the Northern Hemisphere having its 12th warmest January–March temperature over land on record. Parts of northern Australia and equatorial Africa were record warm for the period. The global ocean temperature was eighth warmest for January–March, with a large section of the Indian Ocean south of Australia having record warmth. No record cold regions over land or water were observed for the first quarter of the year.
Select national information is highlighted below:
- The first three months of 2013 were warmer than average in Iceland. The average temperature for the capital city of Reykjavik was the third warmest January–March in the 143-year period of record.
- The monthly precipitation total across Spain was more than three times higher than the 1971–2000 average March value, making this the wettest March since records began in 1947.
- Rainfall was more than 40 percent below average across most of New Zealand's North Island during March. According to NIWA, with ongoing dry conditions, drought was declared for the entire North Island on March 15th. Drought was also declared in Buller and Grey districts on the west coast of South Island on the 22nd, an unusual occurrence for this region, according to government officials.
- Precipitation was much higher than the 1971–2000 March average over all of Hungary during March, with precipitation up to four times higher than normal across large areas of the country.
- March precipitation was heavier than normal for all of Croatia. Some regions in the north were "extremely wet" (greater than the 98th percentile), according to Drzavni hidrometeoroloski zavod.
| January–March | Anomaly | Rank (out of 134 years) | Records | ||||
|---|---|---|---|---|---|---|---|
| °C | °F | Year(s) | °C | °F | |||
| Global | |||||||
| Land | +1.03 ± 0.22 | +1.85 ± 0.40 | Warmest | 7th | 2002 | +1.55 | +2.79 |
| Coolest | 128th | 1893 | -1.26 | -2.27 | |||
| Ocean | +0.41 ± 0.04 | +0.74 ± 0.07 | Warmest | 8th | 1998, 2010 | +0.56 | +1.01 |
| Coolest | 127th | 1911 | -0.51 | -0.92 | |||
| Land and Ocean | +0.58 ± 0.10 | +1.04 ± 0.18 | Warmest | 8th | 2002 | +0.77 | +1.39 |
| Coolest | 127th | 1911 | -0.56 | -1.01 | |||
| Northern Hemisphere | |||||||
| Land | +1.06 ± 0.25 | +1.91 ± 0.45 | Warmest | 12th | 2002 | +1.95 | +3.51 |
| Coolest | 123rd | 1893 | -1.55 | -2.79 | |||
| Ocean | +0.40 ± 0.06 | +0.72 ± 0.11 | Warmest | 8th | 2010 | +0.54 | +0.97 |
| Coolest | 127th | 1904 | -0.48 | -0.86 | |||
| Land and Ocean | +0.65 ± 0.13 | +1.17 ± 0.23 | Warmest | 8th | 2002 | +1.00 | +1.80 |
| Coolest | 127th | 1893 | -0.84 | -1.51 | |||
| Southern Hemisphere | |||||||
| Land | +0.97 ± 0.14 | +1.75 ± 0.25 | Warmest | 2nd | 2010 | +1.16 | +2.09 |
| Coolest | 133rd | 1904 | -0.92 | -1.66 | |||
| Ocean | +0.43 ± 0.05 | +0.77 ± 0.09 | Warmest | 12th | 1998 | +0.60 | +1.08 |
| Coolest | 123rd | 1911 | -0.54 | -0.97 | |||
| Land and Ocean | +0.51 ± 0.07 | +0.92 ± 0.13 | Warmest | 8th | 2010 | +0.67 | +1.21 |
| Coolest | 127th | 1911 | -0.55 | -0.99 | |||
| Arctic | |||||||
| Land and Ocean | +0.07 ± 0.49 | +0.13 ± 0.88 | Warmest | 63rd | 1981 | +2.14 | +3.85 |
| Coolest | 72nd | 1966 | -2.45 | -4.41 | |||

The most current data may be accessed via the Global Surface Temperature Anomalies page.
Precipitation
The maps below represent precipitation percent of normal (left) and precipitation percentiles (right) based on the GHCN dataset of land surface stations using a base period of 1961–1990. As is typical, precipitation anomalies during March 2013 varied significantly around the world. As indicated by the March precipitation percentiles map below, record wetness was observed over parts of southeastern Europe and western Russia. Record dryness was scattered across several locales around the globe, including northeastern Brazil, which has been experienced record or near-record drought conditions over the past several months, northern Chile, part of southern Algeria, and southeastern Niger.


Additional details on flooding and drought events around the world can also be found on the March 2013 Global Hazards page.
Precipitation
Peterson, T.C. and R.S. Vose, 1997: An Overview of the Global Historical Climatology Network Database. Bull. Amer. Meteorol. Soc., 78, 2837-2849.
Quayle, R.G., T.C. Peterson, A.N. Basist, and C. S. Godfrey, 1999: An operational near-real-time global temperature index. Geophys. Res. Lett., 26, 333-335.
Smith, T.M. and R.W. Reynolds, 2005: A global merged land air and sea surface temperature reconstruction based on historical observations (1880-1997), J. Clim., 18, 2021-2036.
Smith et al., 2008, Improvements to NOAA's Historical Merged Land-Ocean Surface Temperature Analysis (1880-2006), J. Climate., 21, 2283-2293.