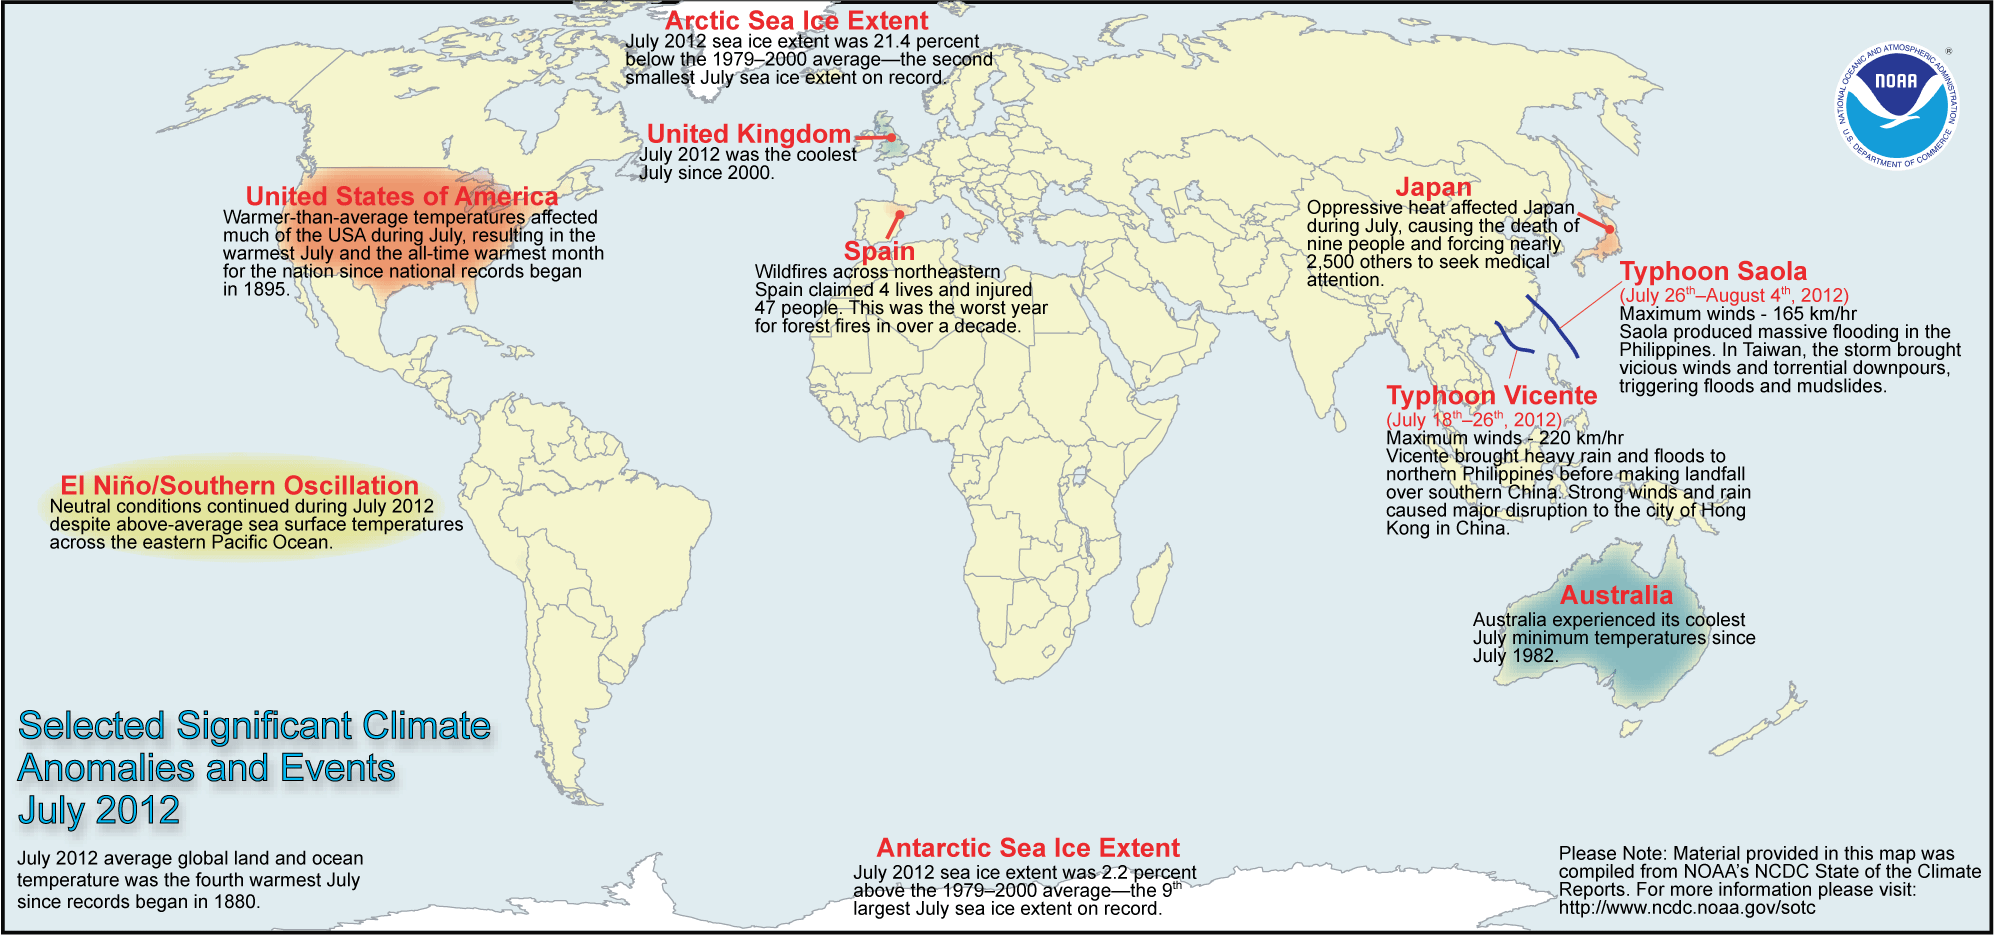
 July 2012 Selected Climate
Anomalies and Events Map
Global Highlights
- The average combined global land and ocean surface temperature for July 2012 was 0.62°C (1.12°F) above the 20th century average of 15.8°C (60.4°F). This is the fourth warmest July since records began in 1880.
- The globally-averaged land surface temperature for July 2012 was the third warmest July on record, at 0.92°C (1.66°F) above average.
- The Northern Hemisphere land surface temperature for July 2012 was the all-time warmest July on record, at 1.19°C (2.14°F) above average.
- ENSO-neutral conditions continued in the eastern equatorial Pacific Ocean during July 2012 as sea surface temperature anomalies in that region continued to rise. The average July worldwide ocean surface temperature ranked as the seventh warmest July on record.
- The combined global land and ocean average surface temperature for January–July 2012 was the 10th warmest such period on record, at 0.53°C (0.95°F) above the 20th century average.
Please Note: The data presented in this report are preliminary. Ranks and anomalies may change as more complete data are received and processed. Effective with the July 2010 State of the Climate Report, NCDC transitioned to the new version (version 3b) of the extended reconstructed sea surface temperature (ERSST) dataset. ERSST.v3b is an improved extended SST reconstruction over version 2. For more information about the differences between ERSST.v3b and ERSST.v2 and to access the most current data, please visit NCDC's Global Surface Temperature Anomalies page.
Introduction
Temperature anomalies for July 2012 are shown on the dot maps below. The dot maps on the left provide a spatial representation of anomalies calculated from the Global Historical Climatology Network (GHCN) dataset of land surface stations using a 1961–1990 base period. The dot maps on the right are a product of a merged land surface and sea surface temperature (SST) anomaly analysis developed by Smith et al. (2008). For the merged land surface and SST analysis, temperature anomalies with respect to the 1971–2000 average for land and ocean are analyzed separately and then merged to form the global analysis. For more information, please visit NCDC's Global Surface Temperature Anomalies page.
Temperatures
In the atmosphere, 500-millibar height pressure anomalies correlate well with temperatures at the Earth's surface. The average position of the upper-level ridges of high pressure and troughs of low pressure—depicted by positive and negative 500-millibar height anomalies on the  July 2012 map—is generally reflected by areas of positive and negative temperature anomalies at the surface, respectively.
July


The average global temperature across land and oceans during July 2012 was 0.62°C (1.12°F) above the 20th century average of 15.8°C (60.4°F) and ranked as the fourth warmest July since records began in 1880. The previous three months—April, May, and June—also ranked among the top five warmest for their respective months. July 2012 marks the 36th consecutive July and 329th consecutive month with a global temperature above the 20th century average. The last below-average July temperature was July 1976 and the last below-average temperature for any month was February 1985. It was the second warmest July in the Northern Hemisphere, behind only the record warmth of 2010. The Southern Hemisphere had its 13th warmest July on record.
The globally averaged temperature over land areas was the third highest for July on record. Notably, it was the warmest July on record for the Northern Hemisphere, where the majority of Earth's land mass is located. This is the fourth month in a row that the Northern Hemisphere has set a new monthly land temperature record. The Southern Hemisphere land temperature was also above average for July, but not as extreme, ranking 33rd in the 133-year period of record.
- The average temperature for the contiguous United States during July was 1.8°C (3.3°F) above the 20th century average, marking the warmest July and all-time warmest month since national records began in 1895, surpassing the previous record warmth of July 1936.
- Some of the greatest anomalous warmth in Canada was observed in the country's southern province of Ontario, particularly in northwestern Ontario and the Far North where record-breaking monthly temperatures occurred, according to Environment Canada. Throughout the province, the average July temperature was as much as 3.5°C (6.3°F) above average.
- Norway as a whole was 0.3°C (0.5°F) cooler than average for the month of July. This marks the country's 30th coolest July since national records began in 1900. The coolest anomalies of -1.0 to -1.5°C (-1.8 to -2.7°F) were observed in the northern regions.
- It was also cooler than average in the United Kingdom, where the July 2012 temperature anomaly was 1.0°C (1.8°F) below the long-term average. This was the coolest July since 2000.
- While the area-averaged monthly maximum temperature for Australia was close to normal, the monthly average minimum temperature was the coolest July in the past 30 years and the eighth coolest July in the country's 63-year period of record, at 0.96°C (1.73°F) below average. The state of Western Australia reported its lowest average July minimum temperature on record—1.71°C (3.08°F) below average.
Across the world's oceans, the July average global sea surface temperature was 0.50°C (0.90°F) above the 20th century average of 16.4°C (61.5°F), making this the seventh warmest July on record. Ocean temperatures were notably below average in the northeastern Pacific Ocean and much higher than average in the northeast Atlantic and in the Labrador Sea near Greenland. This was also the highest monthly global ocean temperature anomaly since July 2010, a month that marked the onset of La Niña conditions that generally persisted until April 2012. During July, sea surface temperature anomalies continued to increase in the eastern and equatorial Pacific Ocean, the region where ENSO conditions are monitored. According to NOAA's Climate Prediction Center, El Niño conditions will likely develop by September 2012.
| July | Anomaly | Rank (out of 133 years) | Records | ||||
|---|---|---|---|---|---|---|---|
| °C | °F | Year(s) | °C | °F | |||
| Global | |||||||
| Land | +0.92 ± 0.13 | +1.66 ± 0.23 | Warmest | 3rd | 1998 | +1.06 | +1.91 |
| Coolest | 131st | 1884 | -0.57 | -1.03 | |||
| Ties: 2002 | |||||||
| Ocean | +0.50 ± 0.04 | +0.90 ± 0.07 | Warmest | 7th | 2009 | +0.59 | +1.06 |
| Coolest | 127th | 1911 | -0.49 | -0.88 | |||
| Ties: 2006 | |||||||
| Land and Ocean | +0.62 ± 0.09 | +1.12 ± 0.16 | Warmest | 4th | 1998 | +0.71 | +1.28 |
| Coolest | 130th | 1911 | -0.43 | -0.77 | |||
| Northern Hemisphere | |||||||
| Land | +1.19 ± 0.14 | +2.14 ± 0.25 | Warmest | 1st | 2012 | +1.19 | +2.14 |
| Coolest | 133rd | 1884 | -0.60 | -1.08 | |||
| Ocean | +0.54 ± 0.04 | +0.97 ± 0.07 | Warmest | 7th | 2005 | +0.65 | +1.17 |
| Coolest | 127th | 1910, 1913 | -0.54 | -0.97 | |||
| Land and Ocean | +0.79 ± 0.12 | +1.42 ± 0.22 | Warmest | 2nd | 2010 | +0.80 | +1.44 |
| Coolest | 132nd | 1913 | -0.50 | -0.90 | |||
| Southern Hemisphere | |||||||
| Land | +0.22 ± 0.11 | +0.40 ± 0.20 | Warmest | 33rd | 1998 | +0.99 | +1.78 |
| Coolest | 101st | 1925 | -0.68 | -1.22 | |||
| Ocean | +0.48 ± 0.04 | +0.86 ± 0.07 | Warmest | 7th | 1998 | +0.60 | +1.08 |
| Coolest | 127th | 1911 | -0.48 | -0.86 | |||
| Ties: 2006 | |||||||
| Land and Ocean | +0.44 ± 0.06 | +0.79 ± 0.11 | Warmest | 13th | 1998 | +0.67 | +1.21 |
| Coolest | 121st | 1911 | -0.47 | -0.85 | |||
| Ties: 1991, 1995 | |||||||
| Arctic | |||||||
| Land and Ocean | +1.08 ± 0.09 | +1.94 ± 0.16 | Warmest | 2nd | 2010 | +1.25 | +2.25 |
| Coolest | 132nd | 1904 | -0.95 | -1.71 | |||
| Ties: 2007 | |||||||


Year-to-date (January–July)

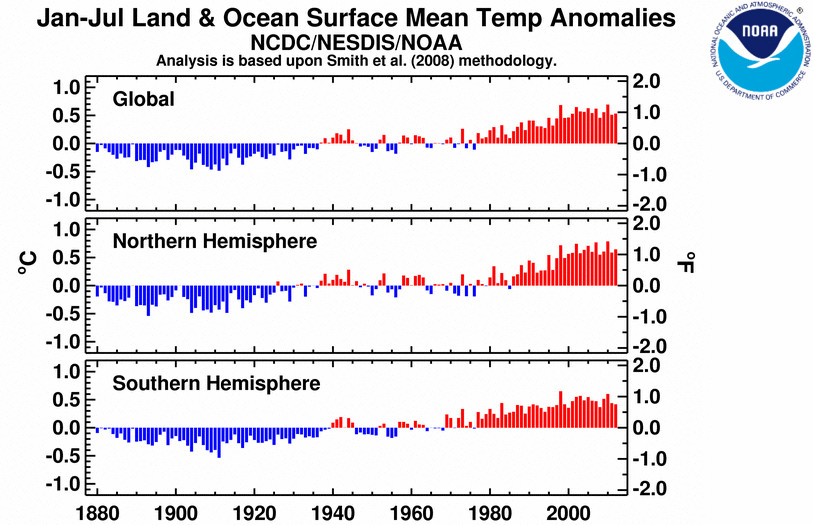
Since February, the year-to-date global temperature anomalies for 2012 have increased each month as the year has progressed and La Niña conditions began to transition to the warmer El Niño phase — January: +0.36°C (+0.65°F); January–February: +0.36°C (+0.67°F); January–March: +0.39°C (+0.70°F); January–April: +0.46°C (+0.83°F); January–May: +0.49°C (+0.90°F), January–June: +0.52°C (+0.94°F), and January–July: +0.53°C (+0.95°F). The record for the warmest January–July was set in 2010, with a temperature that was 0.69°C (1.24°F) above average.

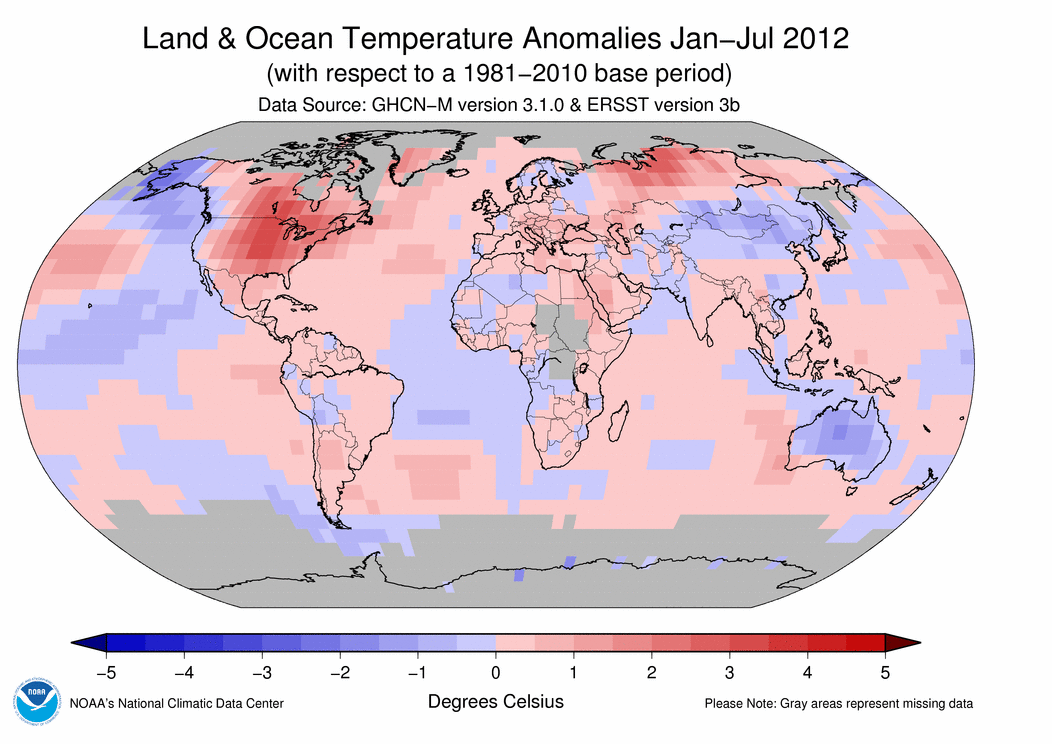
Global Year to Date Temperature Anomalies
The January–July average worldwide land surface temperature was 0.88°C (1.58°F ) above the 20th century average, marking the sixth warmest such period on record. The warmth was most striking over central northern Russia and much of Canada and the contiguous United States. The U.S. reported its all-time warmest January–July on record. The coolest anomalies were observed over Australia and Alaska, where Alaska had its 15th coolest January–July since records began in that state in 1918.
The global ocean surface temperature for the year to date was 0.40°C (0.72°F) above average and tied with 2011 as the 11th warmest such period on record.
| January–July | Anomaly | Rank (out of 133 years) | Records | ||||
|---|---|---|---|---|---|---|---|
| °C | °F | Year(s) | °C | °F | |||
| Global | |||||||
| Land | +0.88 ± 0.21 | +1.58 ± 0.38 | Warmest | 6th | 2007 | +1.12 | +2.02 |
| Coolest | 128th | 1893 | -0.76 | -1.37 | |||
| Ocean | +0.40 ± 0.04 | +0.72 ± 0.07 | Warmest | 11th | 1998 | +0.57 | +1.03 |
| Coolest | 123rd | 1911 | -0.51 | -0.92 | |||
| Ties: 2011 | |||||||
| Land and Ocean | +0.53 ± 0.09 | +0.95 ± 0.16 | Warmest | 10th | 2010 | +0.69 | +1.24 |
| Coolest | 124th | 1911 | -0.49 | -0.88 | |||
| Ties: 2001 | |||||||
| Northern Hemisphere | |||||||
| Land | +1.05 ± 0.26 | +1.89 ± 0.47 | Warmest | 4th | 2007 | +1.29 | +2.32 |
| Coolest | 130th | 1893 | -0.86 | -1.55 | |||
| Ocean | +0.40 ± 0.05 | +0.72 ± 0.09 | Warmest | 9th | 2010 | +0.56 | +1.01 |
| Coolest | 125th | 1910 | -0.49 | -0.88 | |||
| Ties: 2001, 2006 | |||||||
| Land and Ocean | +0.65 ± 0.14 | +1.17 ± 0.25 | Warmest | 6th | 2010 | +0.79 | +1.42 |
| Coolest | 128th | 1893 | -0.54 | -0.97 | |||
| Southern Hemisphere | |||||||
| Land | +0.42 ± 0.15 | +0.76 ± 0.27 | Warmest | 22nd | 2005 | +0.93 | +1.67 |
| Coolest | 112th | 1917 | -0.76 | -1.37 | |||
| Ties: 1980 | |||||||
| Ocean | +0.42 ± 0.04 | +0.76 ± 0.07 | Warmest | 12th | 1998 | +0.60 | +1.08 |
| Coolest | 122nd | 1911 | -0.53 | -0.95 | |||
| Land and Ocean | +0.42 ± 0.07 | +0.76 ± 0.13 | Warmest | 13th | 1998 | +0.65 | +1.17 |
| Coolest | 121st | 1911 | -0.54 | -0.97 | |||
| Ties: 1991, 1999 | |||||||
| Arctic | |||||||
| Land and Ocean | +1.28 ± 0.24 | +2.30 ± 0.43 | Warmest | 5th | 2011 | +1.64 | +2.95 |
| Coolest | 129th | 1888 | -1.29 | -2.32 | |||

The most current data July be accessed via the Global Surface Temperature Anomalies page.
Images of sea surface temperature conditions are available for all weeks during 2012 from the weekly SST page.
Precipitation
The maps below represent anomaly values based on the GHCN dataset of land surface stations using a base period of 1961–1990. As is typical, precipitation anomalies during July 2012 varied significantly around the world.


- July was drier than normal for Australia, with precipitation measured at 83 percent of average. However, the amount of precipitation was mixed across the country. Western Australia reported rainfall that was just 29 percent of average, the third driest July in the state's 113-year period of record, while Queensland in northeastern Australia saw rainfall that was 183 percent of its monthly average.
- Parts of eastern central Argentina reported their driest July in more than 50 years, including the towns of Laboulaye, Pehuajó, and Dolores.
- According to ZAMG, parts of Austria, mainly in the south and east, received unusually heavy downpours during July, with 18 stations across 5 states breaking monthly records (the period of record varies by station). The country's capital city of Vienna saw rainfall that was more than 250 percent of its monthly average.
- In India, the southwest monsoon season that began in early June brought deficient rainfall to much of the country. According to the India Meteorological Department, July rainfall across the country was 87 percent of average. From June 1st through August 1st, seasonal rainfall was just 81 percent of the long term average. About 44 percent of the country observed average to above-average precipitation, while 56 percent reported deficits. Regionally, northwest India reported rainfall that was just 65 percent of average, while east and northeast India was 89 percent of average. In India, monsoon rainfall less than 90 percent of average constitutes drought.
- According to the Japan Meteorological Agency, record 24-hour rainfall of up to 500 mm (20 inches) was observed on Japan's southern island of Kyushu in mid-July. Subsequent flooding and landslides killed more than two dozen residents.
Additional details on flooding and drought events around the world can also be found on the July 2012 Global Hazards page.
References
Peterson, T.C. and R.S. Vose, 1997: An Overview of the Global Historical Climatology Network Database. Bull. Amer. Meteorol. Soc., 78, 2837-2849.
Quayle, R.G., T.C. Peterson, A.N. Basist, and C. S. Godfrey, 1999: An operational near-real-time global temperature index. Geophys. Res. Lett., 26, 333-335.
Smith, T.M., and R.W. Reynolds (2005), A global merged land air and sea surface temperature reconstruction based on historical observations (1880-1997), J. Clim., 18, 2021-2036.
Smith, et al (2008), Improvements to NOAA's Historical Merged Land-Ocean Surface Temperature Analysis (1880-2006), J. Climate., 21, 2283-2293.