Contents of this Section:
Global Highlights
- The combined global land and ocean surface temperature for August 2010 was the third warmest on record at 16.2°C (61.2°F), which is 0.60°C (1.08°F) above the 20th century average of 15.6°C (60.1°F). August 1998 is the warmest August on record and 2009 is the second warmest.
- The August worldwide land surface temperature was 0.90°C (1.62°F) above the 20th century average of 13.8°C (56.9°F)—the second warmest August on record, behind 1998.
- The worldwide ocean surface temperature was 0.50°C (0.90°F) above the 20th century average of 16.4°C (61.4°F) and tied with 1997 as the sixth warmest August on record.
- The combined global land and ocean average surface temperature for June–August 2010 was the second warmest on record, behind 1998, at 16.2°C (61.3°F), which is 0.64°C (1.15°F) above the 20th century average of 15.6°C (60.1°F).
- The June–August worldwide land surface temperature was 1.00°C (1.80°F) above the 20th century average of 13.8°C (56.9°F)—the warmest June–August on record, surpassing the previous June–August record anomaly of 0.92°C (1.66°F) set in 1998.
- The worldwide ocean surface temperature was 0.51°C (0.92°F) above the 20th century average of 16.4°C (61.5°F) and was the fifth warmest June–August on record.
- For January–August 2010, the global combined land and ocean surface temperature of 14.7°C (58.5°F) tied with 1998 as the warmest January–August period on record. This value is 0.67°C (1.21°F) above the 20th century average.
Please Note: The data presented in this report are preliminary. Ranks and anomalies for August change as more complete data are received and processed. Effective with the July 2009 State of the Climate Report, NCDC transitioned to the new version (version 3b) of the extended reconstructed sea surface temperature (ERSST) dataset. ERSST.v3b is an improved extended SST reconstruction over version 2. For more information about the differences between ERSST.v3b and ERSST.v2 and to access the most current data, please visit NCDC's Global Surface Temperature Anomalies page.
Introduction
Temperature anomalies for August 2010 and June–August 2010 are shown on the dot maps below. The dot maps on the left provide a spatial representation of anomalies calculated from the Global Historical Climatology Network (GHCN) dataset of land surface stations using a 1961-1990 base period. The dot maps on the right are a product of a merged land surface and sea surface temperature (SST) anomaly analysis developed by Smith et al. (2008). For the merged land surface and SST analysis, temperature anomalies with respect to the 1971-2000 average for land and ocean are analyzed separately and then merged to form the global analysis. For more information, please visit NCDC's Global Surface Temperature Anomalies page.
Please Note: This preliminary assessment was made before data from China was made available. Therefore, some of the ranks presented in this report could change when Chinese data is included in the final record. The Chinese Meteorological Agency reported that August 2010 was the warmest on record for China, so it is likely that the final August temperature analysis is slightly warmer than reported, especially for the Northern Hemisphere land component.
August
Warmer-than-average temperatures were observed across much of the world's land surface during August 2010, with the warmest anomalies observed across the eastern half of the contiguous United States, eastern Canada, much of Europe, northwestern Africa, and parts of Asia. However, cooler-than-average temperatures were present across southern South America, central Russia, and most of Australia. When averaging the global land surface temperatures, the worldwide land surface temperature for August 2010 ranked as the second warmest on record, behind 1998. August 2010 temperature was 0.90°C (1.62°F) above the 20th century average of 13.8°C (56.9°F).
Across the oceans, warmer-than-average conditions were present across the Atlantic, Indian, and western Pacific oceans, with cooler-than-average conditions present across most of the equatorial Pacific Ocean, and along the North American and South American Pacific coast. The cooler-than-average conditions across the equatorial Pacific Ocean were associated with La Niña, characterized by unusually cool temperatures in the equatorial Pacific Ocean. According to NOAA's Climate Prediction Center (CPC), La Niña strengthened during August 2010 as the temperatures continued to drop to at least 1°C (1.8°F) below average. La Niña is expected to continue through the Northern Hemisphere winter (Southern Hemisphere summer), according to CPC. Overall, the worldwide ocean surface temperature tied with 1997 as the sixth warmest August on record, with an anomaly of 0.50°C (0.90°F) above the 20th century average of 16.4°C (61.4°F).
As a whole, the global land and ocean temperature during August 2010 was 0.60°C (1.08°F) above the 20th century average of 15.6°C (60.1°F), resulting in the third warmest August since records began in 1880, behind 1998 (warmest) and 2009 (second warmest).
Did You Know?
Expand "Coral Reef Bleaching"
Coral Reef Bleaching
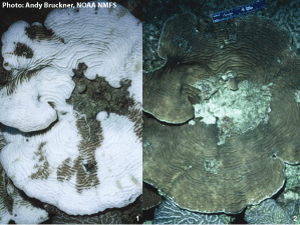
Coral reefs, sometimes called "rainforests of the seas", are found throughout the world's oceans. Not only do reefs provide food and habitat for many species to grow, live, and reproduce, but they also are essential for supporting fisheries, coastal protection, and tourism. Today, many coral reefs are threatened by overfishing and pollution, as well as ocean acidification, disease, and warmer ocean temperatures. Warmer-than-average temperatures cause corals to become stressed. This can lead to mass bleaching (indicated by a white or pale color) of coral colonies and reefs. If ocean temperatures increase just 1°-2°C (1.8°-3.6°F) above average and persist for a month or more, this frequently leads to severe damage or death of corals. Even if corals survive a mass bleaching event, their vulnerability to infectious disease increases and their ability to reproduce decreases. Experts have estimated that bleaching and disease from high ocean temperatures have destroyed nearly one-third of the world's coral reefs.
In 2005, warmer-than-average ocean temperatures in the Caribbean contributed to record-breaking mass coral bleaching, with 50-95% of coral colonies being severely affected. This was the worst bleaching event ever seen in many Caribbean countries. Unfortunately, Caribbean corals are at risk from warming ocean temperatures again this year. Warming in 2010 already has caused mass coral bleaching and mortality in Southeast Asia and the Coral Triangle.
For information on current coral reef environment conditions, please visit NOAA's Coral Reef Watch (CRW).
The Northern Hemisphere as a whole experienced its warmest August on record, surpassing the previous record set in 2003. Separately, the Northern Hemisphere land surface temperature was the warmest on record, while the ocean temperature was the fourth warmest on record.
Meanwhile, the Southern Hemisphere as a whole experienced its eleventh warmest August on record. Separately, the Southern Hemisphere land surface temperature tied with 1985 as the 22nd warmest August on record, while the ocean surface temperature ranked as the ninth warmest since records began in 1880.
According to the Beijing Climate Center, the August 2010 average temperature across China was 21.4°C (70.5°F), which is 1.1°C (2.0°F) above the 1971–2000 average, resulting in the warmest August since 1961. The provinces of Shanghai, Zhejiang, Qinghai had their warmest August since 1961, while Jiangsu, Fujian, Yunnan, and Tibet had their second warmest August since 1961.
Eastern Canada experienced anomalously warm conditions during August 2010, with several locations setting new temperature records. The two most noteworthy were in the Ontario Province (Sarnia and Moosonee). The August 2010 mean temperature of 22.5°C (72.5°F) broke Sarnia's 22-year-old August mean temperature record of 22.2°C (72.0°F) set in 1988, according to Environment Canada. Sarnia's August 2010 mean temperature was 2.5°C (4.5°F) above average. Meanwhile, Moosonee's mean temperature tied the 1955 record of 17.4°C (63.3°F). This value is 3.0°C (5.4°F) above average. However, the warmest day in August was August 30th when many locations set new daily maximum temperature records. That same day the air quality heath index in Toronto was severe, representing a high health risk.
According to U.K's Met Office, August 2010 was characterized as a cloudy and cool month, resulting in the U.K.'s coolest August since 1993. The U.K.'s August 2010 temperature was 0.5°C below the 1971–2000 average. Separately, England had its coolest August since 1993, Wales and Northern Ireland had their coolest August since 1994, and Scotland had its coolest August since 1998.
Across Australia, the averaged maximum temperature for the nation as a whole was moderately below the long-term average, according to Australia's Bureau of Meteorology. On a state level, New South Wales had its lowest monthly-averaged maximum August temperatures since 1990, while South Australia experienced its lowest monthly-averaged maximum August temperatures since 1978. Many locations in New South Wales and South Australia had their lowest monthly-averaged maximum August temperature on record. On the contrary, parts of Cape York Peninsula (located in Queensland) and coastal Arnhem Land (located in Northern Territory) had their warmest maximum August temperature on record.
Spain's meteorological office (Agencia Estatal de Meteorología) reported that the country experienced above-average temperatures during August 2010. Overall, Spain's nationwide average temperature was 1.5°C (2.7°F) above the 1971–2000 average—the fifth warmest August since 1971.
June–August - Northern Hemisphere Summer, Southern Hemisphere Winter
The combined global land and ocean surface temperature during June–August 2010 was 16.2°C (61.3°F), which is 0.64°C (1.15°F) above the 20th century average of 15.6°C (60.1°F)—resulting in the second warmest June–August on record, behind 1998. Warmer-than-average temperatures were present across most of the world's land surface, with the warmest anomalies observed across eastern Europe, the eastern half of the contiguous U.S., and parts of eastern Canada, and eastern Asia. However, cooler-than-average conditions were present across parts of central Russia and southern South America. Overall, the worldwide land-only surface temperature ranked as the warmest on record, surpassing the previous record set in 1998 by 0.08°C (0.14°F). The June–August 2010 worldwide land-only surface temperature was 1.00°C (1.80°F) above the 20th century average of 13.8°C (56.9°F). Meanwhile, the worldwide ocean surface temperature was 0.51°C (0.92°F) above the 20th century average of 16.4°C (61.5°F), resulting in the fifth warmest such period on record. The Atlantic, Indian, and western Pacific oceans had warmer-than-average conditions, while the equatorial Pacific Ocean, and along the North and South American Pacific coast, experienced cooler-than-average conditions associated with a developing La Niña.
On a hemisphere level, the Northern Hemisphere as a whole had its warmest June–August on record, with 0.80°C (1.44°F) above the 20th century average. The previous record was 0.70°C (1.26°F) set in 1998 and again in 2005. The Northern Hemisphere land-only surface temperature was also the warmest on record, surpassing the previous record set in 1998 by 0.24°C (0.43°F). Meanwhile, the ocean surface temperature was the third warmest on record, behind 2005 (warmest) and 2009 (second warmest).
Meanwhile, the Southern Hemisphere as a whole had its ninth warmest June–August on record. Separately, the Southern Hemisphere land surface temperature ranked as the tenth warmest on record, while the ocean surface temperature ranked as the ninth warmest on record.
According to the Australian Bureau of Meteorology, the states of Victoria and South Australia had their coolest winter in 13 years, while New South Wales experienced its coolest winter in a decade. The national averaged maximum temperature was the lowest since 1997, while New South Wales had its lowest maximum temperature since 1998, Victoria since 1992, and South Australia since 1989.
According to Environment Canada (EC), most of the country experienced above-average temperatures during June–August 2010, with the Arctic, northern Quebec, and central Ontario more than 2°C (4°F) above average. The national average temperature for June–August 2010 was 1.3°C (2.3°F) above average—resulting in the third warmest summer since national records began in 1948. The record summer is 1998 and 2006 is the second warmest summer on record. Regionally, six climate regions ranked among the ten warmest June–August: Arctic Tundra (3rd warmest), Great Lakes/St. Lawrence (4th warmest), Northeastern Forest (5th warmest), Mackenzie District (6th warmest), and Atlantic Region (8th warmest). According to EC, the Arctic Tundra region has had six summers in the last decade that have ranked among the ten warmest summers.
Year-to-date (January–August)
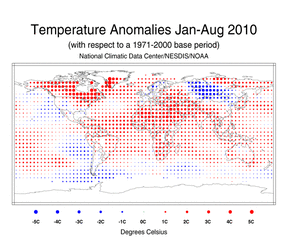
The  January–August 2010 map of temperature anomalies shows above-average temperatures over most of the globe's surface area. The warmest surface temperature anomalies for the year-to-date period occurred over Canada, the northern U.S., southern Greenland, Africa, southwest Asia, and the tropical North Atlantic Ocean. Cool temperature anomalies were present across central Asia, non-equatorial eastern Pacific Ocean, and the southern oceans. The global land and ocean surface combined temperature for January–August 2010 tied with 1998 as the warmest such period on record with temperatures 0.67°C (1.21°F) above the 20th century average. Global ocean surface temperatures were the second warmest January–August on record, behind 1998, with temperatures 0.53°C (0.95°F) above the 20th century average. The average global land surface temperature for the period was 1.04°C (1.87°F) above the 20th century reference period and ranked as the warmest January–August on record.
According to Environment Canada, the nation's January–August 2010 temperature set a record for the warmest first eight months, surpassing the previous record set in 2006.
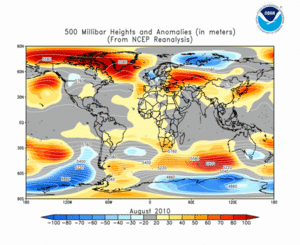
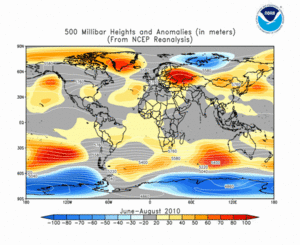
The average position of the upper-level ridges of high pressure and troughs of low pressure (depicted by positive and negative 500-millibar height anomalies on the  August 2010 map and
  June–August 2010, respectively) are generally reflected by areas of positive and negative temperature anomalies at the surface, respectively. For other Global products, please see the Climate Monitoring Global Products page.
Images of sea surface temperature conditions are available for all weeks during 2010 from the weekly SST page.
Temperature Rankings and Graphics
Current Month | Seasonal | Year-to-date
| August | Anomaly | Rank (out of 131 years) | (Next) Warmest on Record | ||||
|---|---|---|---|---|---|---|---|
| °C | °F | Year | °C | °F | |||
| Global | |||||||
| Land | +0.90 | +1.62 | 2nd warmest | 1998 | +0.95 | +1.71 | |
| Ocean | +0.50 | +0.90 | 6th warmest* | 2009 | +0.57 | +1.03 | |
| Land and Ocean | +0.60 | +1.08 | 3rd warmest | 1998 | +0.67 | +1.21 | |
| Northern Hemisphere | |||||||
| Land | +1.15 | +2.07 | Warmest | (1998) | +0.96 | +1.73 | |
| Ocean | +0.59 | +1.06 | 4th warmest | 2005* | +0.64 | +1.15 | |
| Land and Ocean | +0.79 | +1.42 | Warmest | (2003) | +0.72 | +1.30 | |
| Southern Hemisphere | |||||||
| Land | +0.28 | +0.50 | 22nd warmest* | 2009 | +1.31 | +2.36 | |
| Ocean | +0.43 | +0.77 | 9th warmest | 1998 | +0.57 | +1.03 | |
| Land and Ocean | +0.40 | +0.72 | 11th warmest | 2009 | +0.65 | +1.17 | |
*Signifies a tie
| June–August | Anomaly | Rank (out of 131 years) | (Next) Warmest on Record | ||||
|---|---|---|---|---|---|---|---|
| °C | °F | Year | °C | °F | |||
| Global | |||||||
| Land | +1.00 | +1.80 | Warmest | (1998) | +0.92 | +1.66 | |
| Ocean | +0.51 | +0.92 | 5th warmest | 2009* | +0.57 | +1.03 | |
| Land and Ocean | +0.64 | +1.15 | 2nd warmest | 1998 | +0.67 | +1.21 | |
| Northern Hemisphere | |||||||
| Land | +1.18 | +2.12 | Warmest | (1998) | +0.94 | +1.69 | |
| Ocean | +0.58 | +1.04 | 3rd warmest | 2005 | +0.63 | +1.13 | |
| Land and Ocean | +0.80 | +1.44 | Warmest | (2005)* | +0.70 | +1.26 | |
| Southern Hemisphere | |||||||
| Land | +0.53 | +0.95 | 10th warmest | 1998 | +0.88 | +1.58 | |
| Ocean | +0.48 | +0.86 | 9th warmest | 1998 | +0.59 | +1.06 | |
| Land and Ocean | +0.48 | +0.86 | 9th warmest | 1998 | +0.64 | +1.15 | |
*Signifies a tie
| January–August | Anomaly | Rank (out of 131 years) | (Next) Warmest on Record | ||||
|---|---|---|---|---|---|---|---|
| °C | °F | Year | °C | °F | |||
| Global | |||||||
| Land | +1.04 | +1.87 | Warmest | (2007) | +1.02 | +1.84 | |
| Ocean | +0.53 | +0.95 | 2nd warmest | 1998 | +0.56 | +1.01 | |
| Land and Ocean | +0.67 | +1.21 | Warmest* | (2002) | +0.62 | +1.12 | |
| Northern Hemisphere | |||||||
| Land | +1.14 | +2.05 | 2nd warmest | 2007 | +1.22 | +2.20 | |
| Ocean | +0.55 | +0.99 | Warmest | (2005) | +0.54 | +0.97 | |
| Land and Ocean | +0.77 | +1.39 | Warmest | (2007) | +0.73 | +1.31 | |
| Southern Hemisphere | |||||||
| Land | +0.78 | +1.40 | 3rd warmest | 2005 | +0.86 | +1.55 | |
| Ocean | +0.53 | +0.95 | 2nd warmest* | 1998 | +0.60 | +1.08 | |
| Land and Ocean | +0.57 | +1.03 | 2nd warmest | 1998 | +0.63 | +1.13 | |
*Signifies a tie
The most current data August be accessed via the Global Surface Temperature Anomalies page.
Precipitation
The maps below represent anomaly values based on the GHCN dataset of land surface stations using a base period of 1961-1990. During August 2010, above-average precipitation fell over areas that included Pakistan, central Europe, eastern India, western Africa, eastern Australia, the north central contiguous U.S., and parts of the Caribbean Islands. The areas with the driest anomalies during August 2010 were observed across South America, northern India, Japan, the eastern U.S., and the Pacific Islands.
During the June–August 2010 period, above-average precipitation fell over areas that included southeast Asia, the central U.S., northern South America, and parts of Europe. The driest anomalies during June–August 2010 were observed across the Philippine Islands, South America, northern India, and the eastern contiguous U.S.
According to the German Meteorological Service (Deutscher Wetterdienst), Germany received 159.2 mm (6.3 inches) of precipitation during August 2010—which is 81.6 mm (3.2 inches) above the 1961–1990 average. This was Germany's wettest August since 1901.
According to Australia's Bureau of Meteorology, the continent received an average of 26.6 mm (1.0 inch) of precipitation during August 2010—this is 42 percent above the 1961–1990 average. Regionally, Victoria had its wettest August since 1981, the Northern Territory had its wettest August since 1975, and Queensland had its wettest August since 1998.
According to Australia's Bureau of Meteorology, the national average precipitation during June–August was 13 percent above the 1961–1990 average. Above-average precipitation generally fell in the north and east of the country. Meanwhile, below-average precipitation was observed across areas of Victoria, New South Wales, and South Australia. It was reported that an area in southwest Western Australia experienced their driest winter on record. The averaged precipitation for the southwest Western Australia region was 129.3 mm (5.1 inches) (34 percent below average)—breaking the previous record by 30 mm (1.2 inches). Regionally, the Northern Territory had its fifth wettest winter and wettest since 1986.
Canada, as a whole, had above-average precipitation during June–August 2010, with 4.2 percent above average—this was the 22nd wettest such period in the 63-year historical period, according to Environment Canada. Regionally, Great Lakes/St. Lawrence (fifth wettest) and Prairies (ninth wettest) ranked among the ten wettest summers on record. Meanwhile, Pacific Coast (third driest), North B.C. Mountains/Yukon (sixth driest), and South B.C. Mountains (ninth driest) ranked among the ten driest summers on record.
Additional details on flooding and drought events around the world can also be found on the August 2010 Global Hazards page.
References
Christy, John R., R.W. Spencer, and W.D. Braswell, 2000: MSU tropospheric Temperatures: Dataset Construction and Radiosonde Comparisons. J. of Atmos. and Oceanic Technology, 17, 1153-1170.
Free, M., D.J. Seidel, J.K. Angell, J. Lanzante, I. Durre and T.C. Peterson (2005) Radiosonde Atmospheric Temperature Products for Assessing Climate (RATPAC): A new dataset of large-area anomaly time series, J. Geophys. Res., 10.1029/2005JD006169.
Free, M., J.K. Angell, I. Durre, J. Lanzante, T.C. Peterson and D.J. Seidel(2004), Using first differences to reduce inhomogeneity in radiosonde temperature datasets, J. Climate, 21, 4171-4179.
Fu, Q., C.M. Johanson, S.G. Warren, and D.J. Seidel, 2004: Contribution of stratospheric cooling to satellite-inferred tropospheric temperature trends. Nature, 429, 55-58.
Lanzante, J.R., S.A. Klein, and D.J. Seidel (2003a), Temporal homogenization of monthly radiosonde temperature data. Part I: Methodology, J. Climate, 16, 224-240.
Lanzante, J.R., S.A. Klein, and D.J. Seidel (2003b), Temporal homogenization of monthly radiosonde temperature data. Part II: trends, sensitivities, and MSU comparison, J. Climate, 16, 241 262.
Mears, Carl A., M.C. Schabel, F.J. Wentz, 2003: A Reanalysis of the MSU Channel 2 tropospheric Temperature Record. J. Clim, 16, 3650-3664.
Peterson, T.C. and R.S. Vose, 1997: An Overview of the Global Historical Climatology Network Database. Bull. Amer. Meteorol. Soc., 78, 2837-2849.
Quayle, R.G., T.C. Peterson, A.N. Basist, and C. S. Godfrey, 1999: An operational near-real-time global temperature index. Geophys. Res. Lett., 26, 333-335.
Smith, T.M., and R.W. Reynolds (2005), A global merged land air and sea surface temperature reconstruction based on historical observations (1880-1997), J. Clim., 18, 2021-2036.
Smith, et al (2008), Improvements to NOAA's Historical Merged Land-Ocean Surface Temperature Analysis (1880-2006), J. Climate., 21, 2283-2293.
 NOAA's National Centers for Environmental Information


