Contents of this Section:
Global Highlights
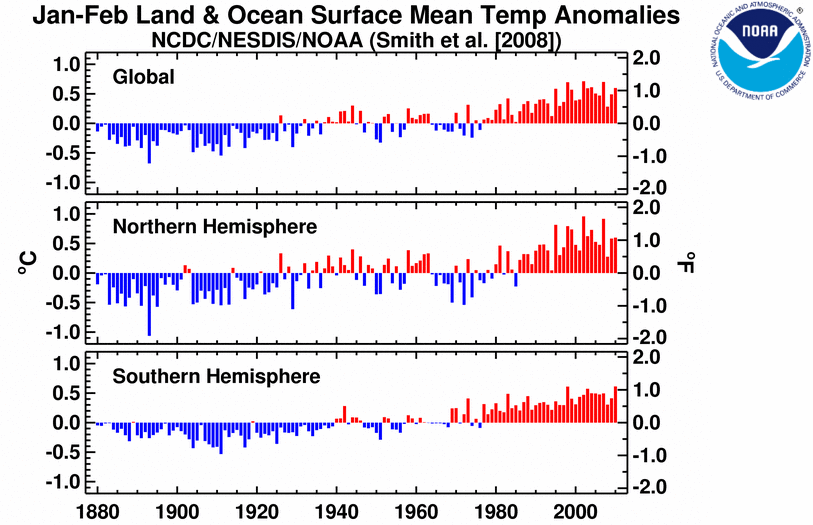
- The combined global land and ocean average surface temperature for February 2010 was 0.60°C (1.08°F) above the 20th century average of 12.1°C (53.9°F). This is the sixth warmest such value on record.
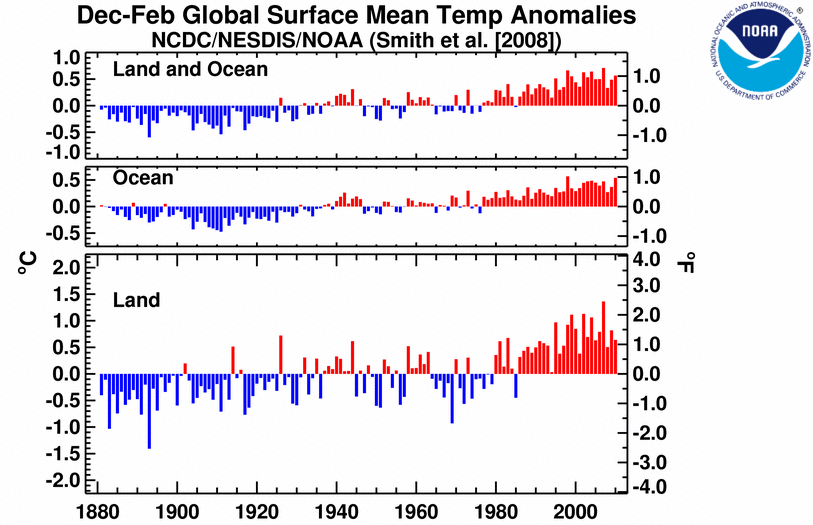
- The combined global land and ocean average surface temperature for December 2009 - February 2010 was the fifth warmest on record for the season, 0.57°C (1.03°F) above the 20th century average of 12.1°C (53.8°F).
- For the year to date, the combined global land and ocean surface temperature of 12.7°C (54.9°F) was the fifth warmest January-February period on record. This value is 0.60°C (1.08°F) above the 20th century average.
- The worldwide ocean surface temperature for February 2010 was the second warmest on record for February, 0.54°C (0.97°F) above the 20th century average of 15.9°C (60.6°F).
- The seasonal (December 2009 - February 2010) worldwide ocean surface temperature was also the second warmest on record, 0.54°C (0.97°F) above the 20th century average of 15.8°C (60.5°F).
- In the Southern Hemisphere, both the February 2010 average temperature for land areas and the Hemisphere as a whole (land and ocean surface combined), represented the warmest February on record. The Southern Hemisphere ocean temperature tied with 1998 as the warmest February on record.
Please Note: The data presented in this report are preliminary. Ranks and anomalies may change as more complete data are received and processed. Effective with the July 2009 State of the Climate Report, NCDC transitioned to the new version (version 3b) of the extended reconstructed sea surface temperature (ERSST) dataset. ERSST.v3b is an improved extended SST reconstruction over version 2. For more information about the differences between ERSST.v3b and ERSST.v2 and to access the most current data, please visit NCDC's Global Surface Temperature Anomalies page.
Introduction
Temperature anomalies for February 2010 and December 2009 - February 2010 are shown on the dot maps below. The dot maps on the left provide a spatial representation of anomalies calculated from the Global Historical Climatology Network (GHCN) dataset of land surface stations using a 1961-1990 base period. The dot maps on the right are a product of a merged land surface and sea surface temperature (SST) anomaly analysis developed by Smith et al. (2008). For the merged land surface and SST analysis, temperature anomalies with respect to the 1971-2000 average for land and ocean are analyzed separately and then merged to form the global analysis. For more information, please visit NCDC's Global Surface Temperature Anomalies page.
February

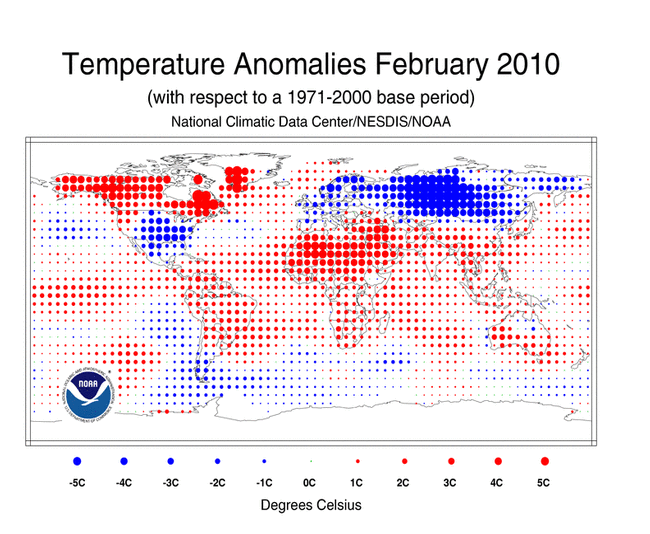
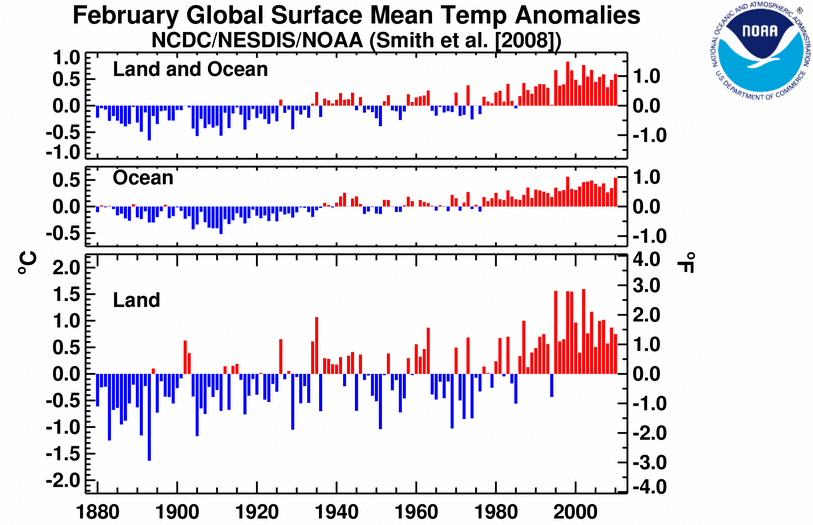
The combined global land and ocean surface temperature for February 2010 was the sixth warmest February since records began in 1880. The combined global land and ocean temperature anomaly was 0.60°C (1.08°F) above the 20th century average. Sea surface temperatures (SST) during February 2010 were warmer than average across much of the world's oceans, with cooler-than-average conditions across the Gulf of Mexico, along the western coast of South America, parts of the higher-latitude southern oceans, and the northern Atlantic and northeastern Pacific oceans. The February 2010 worldwide ocean SST ranked as the second warmest on record, 0.54°C (0.97°F) above the 20th century average of 15.9°C (60.6°F). The worldwide sea surface temperatures during the month of February were the warmest in 1998.
Across the equatorial Pacific Ocean, a moderate-to-strong El Niño continued during February 2010. Sea surface temperatures across parts of the equatorial Pacific Ocean were more than 1.5°C (2.7°F) above average during the month. El Niño is expected to continue at least through the Northern Hemisphere spring 2010, according to NOAA's Climate Prediction Center (CPC).
Meanwhile, the worldwide land surface temperature tied with 1992 as the 14th warmest February on record, with an anomaly of 0.75°C (1.35°F) above average. During February 2010, warmer-than-average temperatures were present across large portions of the world's land areas, with the warmest anomalies across Canada, Alaska, and parts of western Africa, the Middle East, and southeastern Asia. The anomalies in these areas ranged from 3°-6°C (5°-11°F) above average. However, cooler-than-average conditions were present across western and northern Europe, central Asia, southern Argentina, southern Chile, northeastern Australia, and most of the central and eastern contiguous United States. February 2010 for the Northern Hemisphere combined land and ocean tied with 2009 as the tenth warmest on record. Separately, the Northern Hemisphere land ranked as the 26th warmest February, while the Northern Hemisphere ocean was the second warmest on record, behind 1998.
In contrast, the February 2010 average temperature for the Southern Hemisphere as a whole (land and ocean surface combined) was 0.63°C (1.13°F) above the 20th century average—the warmest February on record. The Southern Hemisphere land-only temperature during February 2010 also represented the warmest February on record, with an anomaly of 0.97°C (1.75°F) above the 20th century average. The February 2010 Southern Hemisphere ocean temperature tied with 1998 as the warmest February on record.
According to the Australian Bureau of Meteorology (BoM), nationally averaged maximum temperatures for February 2010 ranked as the 15th warmest February on record, 0.37°C (0.67°F) above average, since national records began. Tasmania and Western Australia had their third and fourth warmest February maximum temperatures on record, respectively. Australia as a whole experienced warmer-than-average minimum temperatures during the month—the national average anomaly of 1.03°C (1.85°F) ranked as the fifth warmest February minimum temperature on record. BoM reported that Victoria and Western Australia had their second-warmest and fourth-warmest February nights on record, respectively.
According to Environment Canada, northern parts of the Canadian province of Ontario experienced warmer-than-average temperatures, with Petawawa and Moosonee experiencing 5°C (9°F) or more above average—their warmest February temperatures since 1998 and 1999, respectively.
The February 2010 average temperature across China was -2.1°C (28.2°F), which is 0.7°C (1.3°F) above the 1971-2000 average, according to Beijing Climate Center (BCC). It was reported that Yunnan and most of South China experienced their warmest February temperatures during the first ten days of the month since historic records began in 1951. On 14 February 2010, China celebrated the Spring Festival (Chinese New Year). The average temperature on this day was -5.3°C (22.5°F), 3.1°C (5.6°F) below average—this was the coolest Spring Festival since 1989.
According to the United Kingdom Met Office, below-average temperatures engulfed much of the United Kingdom during February 2010. The monthly average temperature over England and Wales was 1°-2°C (2°-4°F) below the 1971-2000 average—the coolest February since 1996. Scotland and Northern Ireland experienced their coolest February since 1986 as the monthly average temperatures were typically 2°C (4°F) below average. The United Kingdom as a whole had its coolest February since 1991. For a third consecutive month, the Irish Republic experienced below-average temperatures. February 2010 was nearly 2°C (4°F) below average—the coolest February temperature since 1986. According to the Irish Meteorological Service, the average minimum temperatures for Irish stations [ranging from -1.0°C (30.2°F) to +2.0°C (35.6°F)] were nearly 2°-3°C (4°-5°F) below average—the lowest minimum temperatures during February for some stations in over four decades.
Season (December-February)
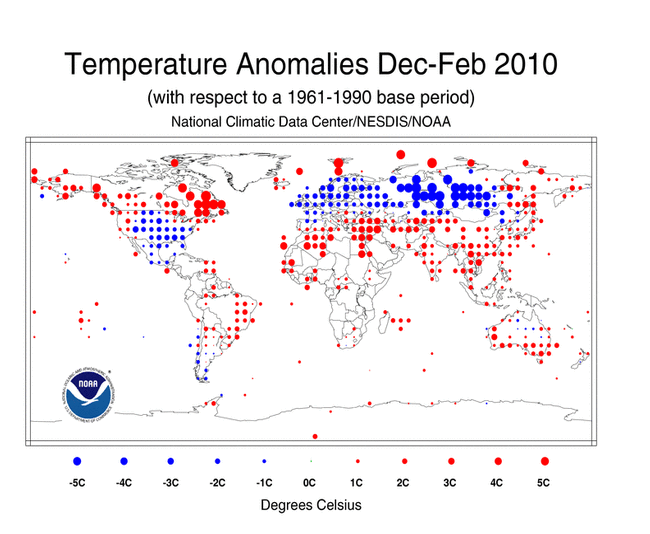
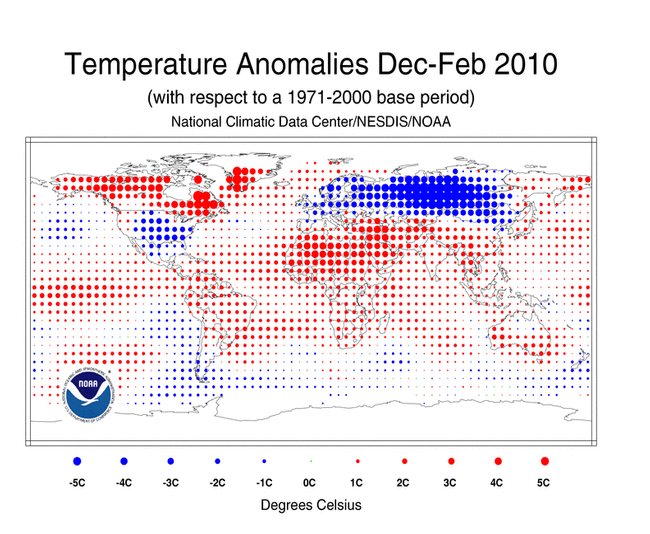
The combined global land and ocean surface temperature during December 2009 - February 2010 ranked as the fifth warmest on record. During the three-month season, warmer-than-average temperatures engulfed much of the planet's surface, with the exception of anomalously cool conditions across Europe, western and central Russia, and most of the contiguous United States. The seasonal temperature for the worldwide land surface was the 13th warmest December-February on record, 0.64°C (1.15°F) above the 20th century average. Meanwhile, the worldwide ocean surface temperature had the second warmest December-February temperature on record, behind 1998.
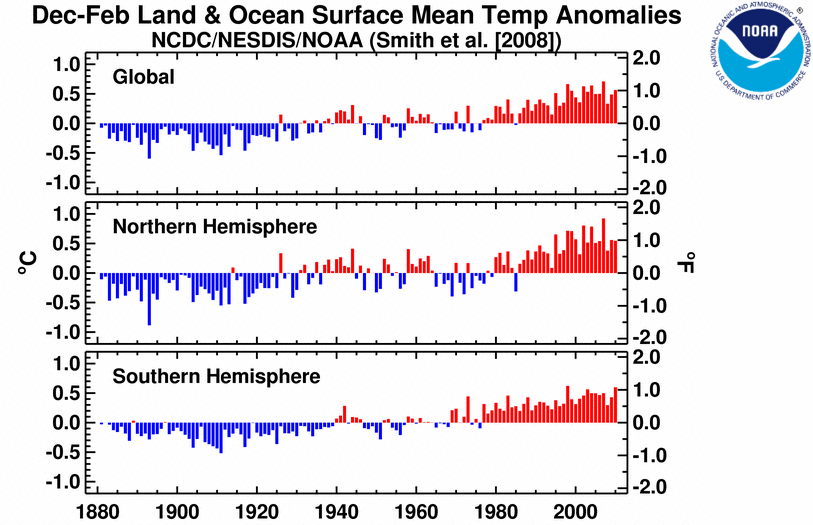
The Northern Hemisphere combined land and ocean surface temperature during December 2009 - February 2010 represented the ninth warmest on record. Separately, the worldwide land temperature tied with 2005 as the 22nd warmest December-February on record, while the worldwide ocean temperature was the second warmest on record, behind 1998. In contrast, the Southern Hemisphere combined land and ocean temperature during the three-month season was the second warmest December-February on record, behind 1998. The worldwide ocean temperature was also second warmest December-February on record, while the Southern Hemisphere land-only temperature tied with 1998 as the warmest December-February period on record.
As shown in the dot maps above, the British Isles were engulfed by cooler-than-average conditions during December 2009 - February 2010. According to the Met Office, the average temperature for the United Kingdom during the three-month season was 1.6°C (34.9°F), which is 2.1°C (3.8°F) below the 1971-2000 average—making it the coolest December-February period since December 1978 - February 1979. Separately, England and Wales experienced their coolest Northern Hemisphere winter since 1978/1979. December 2009 - February 2010 was the coolest such three-month season since December 1978 - February 1979 and the third coolest for Northern Ireland since national records began in 1914. Scotland experienced its second coolest winter since national records began in 1914, behind the December 1962 - February 1963 period.
Similarly, the Irish Republic experienced its coolest winter since 1962/1963—with average temperatures nearly 2°C (4°F) below the 1961-1990 average, according to the Irish Meteorological Service. It was reported that the season's lowest temperatures were recorded during December 24th-25th and January 7th-9th when temperatures dipped to -10°C (14°F) in several locations—recording their lowest December-February temperatures in over 20 years.
Conversely, most of Canada had warmer-than-average conditions during December 2009 - February 2010. According to Environment Canada, the average temperature for the nation during December 2009 - February 2010 was 4°C (7°F) above average—resulting in the warmest December-February period since national records began in 1948. December 2009 - February 2010 ranked among the ten warmest December-February periods for seven of Canada's eleven climate regions, with Arctic Tundra, Arctic Mountains and Fiords, and Northwestern Forest having their warmest December-February on record.
Much of Australia experienced warmer-than-average conditions during the Northern Hemisphere winter (Southern Hemisphere summer), with the exception of cooler-than-average conditions across the northern parts of the country. Warmer-than-average temperatures were concentrated in Western Australia, resulting in the warmest December-February period on record in that region. According to the Australian Bureau of Meteorology (BoM), the mean temperatures in Western Australia were 1.32°C (2.38°F) above average. The record-breaking mean temperatures are a result of three consecutive warm months—the third warmest December, the second warmest January, and the third warmest February. Overall, the state had a mean minimum temperature of 22.5°C (72.5°F) during the three-month season—the highest mean minimum temperature since national records began in 1950.
Year-to-date (January-February)
The  January-February 2010 map of temperature anomalies shows the presence of warmer-than-average conditions across most of the globe's surface area, with the exception of cooler-than-average conditions across Mexico, northern Australia, the central and southeastern contiguous U.S., northeastern Pacific Ocean and most of Europe, Russia, and the high-latitude southern oceans. The combined global land and ocean surface temperature for the year-to-date period was the fifth warmest January-February period on record. This value is 0.60°C (1.08°F) above the 20th century average.
The average position of the upper-level ridges of high pressure and troughs of low pressure (depicted by positive and negative 500-millibar height anomalies on the 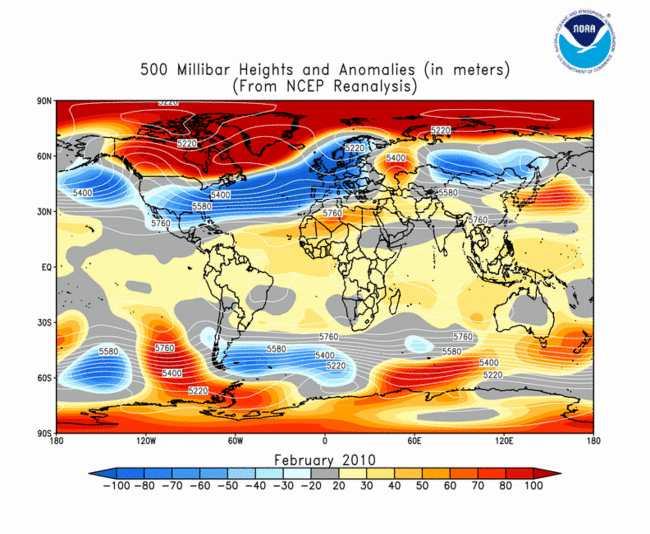 February 2010 map and
 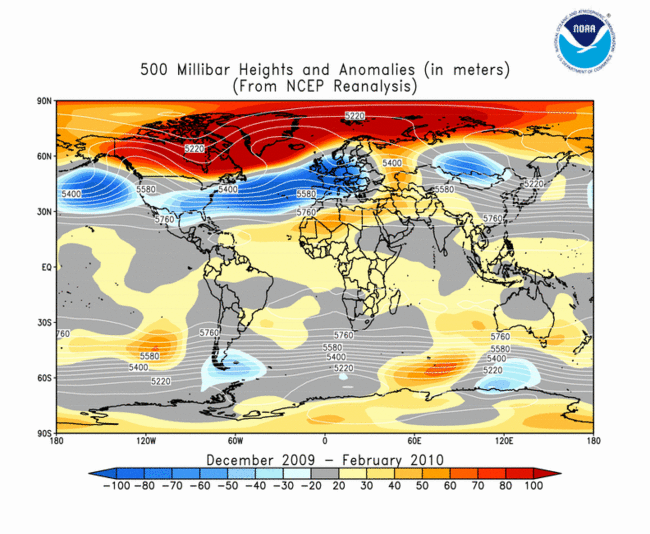 December 2009 - February 2010, respectively) are generally reflected by areas of positive and negative temperature anomalies at the surface, respectively. For other Global products, please see the Climate Monitoring Global Products page.
Images of sea surface temperature conditions are available for all weeks during 2009 from the weekly SST page.
Temperature Rankings and Graphics
Current Month | Seasonal | Year-to-date
| February | Anomaly | Rank (out of 131 years) | (Next) Warmest on Record | ||||
|---|---|---|---|---|---|---|---|
| °C | °F | Year | °C | °F | |||
| Global | |||||||
| Land | +0.75 | +1.35 | 14th warmest* | 2002 | +1.60 | +2.88 | |
| Ocean | +0.54 | +0.97 | 2nd warmest | 1998 | +0.56 | +1.01 | |
| Land and Ocean | +0.60 | +1.08 | 6th warmest | 1998 | +0.83 | +1.49 | |
| Northern Hemisphere | |||||||
| Land | +0.67 | +1.21 | 26th warmest | 2002 | +2.12 | +3.82 | |
| Ocean | +0.51 | +0.92 | 2nd warmest | 1998 | +0.55 | +0.99 | |
| Land and Ocean | +0.57 | +1.03 | 10th warmest* | 2002 | +1.06 | +1.91 | |
| Southern Hemisphere | |||||||
| Land | +0.97 | +1.75 | Warmest | (1983) | +0.89 | +1.60 | |
| Ocean | +0.58 | +1.04 | Warmest* | (2003) | +0.54 | +0.97 | |
| Land and Ocean | +0.63 | +1.13 | Warmest | (1998) | +0.62 | +1.12 | |
*Signifies a tie

| December–February | Anomaly | Rank (out of 131 years) | (Next) Warmest on Record | ||||
|---|---|---|---|---|---|---|---|
| °C | °F | Year | °C | °F | |||
| Global | |||||||
| Land | +0.64 | +1.15 | 13th warmest | 2007 | +1.36 | +2.45 | |
| Ocean | +0.54 | +0.97 | 2nd warmest | 1998 | +0.57 | +1.03 | |
| Land and Ocean | +0.57 | +1.03 | 5th warmest | 2007 | +0.71 | +1.28 | |
| Northern Hemisphere | |||||||
| Land | +0.58 | +1.04 | 22nd warmest* | 2007 | +1.61 | +2.90 | |
| Ocean | +0.52 | +0.94 | 2nd warmest | 1998 | +0.55 | +0.99 | |
| Land and Ocean | +0.55 | +0.99 | 9th warmest | 2007 | +0.92 | +1.66 | |
| Southern Hemisphere | |||||||
| Land | +0.78 | +1.40 | Warmest* | (2005) | +0.77 | +1.39 | |
| Ocean | +0.57 | +1.03 | 2nd warmest | 1998 | +0.60 | +1.08 | |
| Land and Ocean | +0.60 | +1.08 | 2nd warmest | 1998 | +0.62 | +1.12 | |
*Signifies a tie
| January–February | Anomaly | Rank (out of 131 years) | (Next) Warmest on Record | ||||
|---|---|---|---|---|---|---|---|
| °C | °F | Year | °C | °F | |||
| Global | |||||||
| Land | +0.78 | +1.40 | 11th warmest | 2002 | +1.43 | +2.57 | |
| Ocean | +0.53 | +0.95 | 2nd warmest | 1998 | +0.56 | +1.01 | |
| Land and Ocean | +0.60 | +1.08 | 5th warmest | 2002 | +0.71 | +1.28 | |
| Northern Hemisphere | |||||||
| Land | +0.75 | +1.35 | 15th warmest* | 2002 | +1.89 | +3.40 | |
| Ocean | +0.51 | +0.92 | 2nd warmest | 1998 | +0.55 | +0.99 | |
| Land and Ocean | +0.60 | +1.08 | 8th warmest | 2002 | +0.96 | +1.73 | |
| Southern Hemisphere | |||||||
| Land | +0.87 | +1.57 | Warmest | (2003)* | +0.79 | +1.42 | |
| Ocean | +0.57 | +1.03 | 2nd warmest | 1998 | +0.58 | +1.04 | |
| Land and Ocean | +0.61 | +1.10 | Warmest* | (2003) | +0.57 | +1.03 | |
*Signifies a tie

The most current data may be accessed via the Global Surface Temperature Anomalies page.
Precipitation
The maps below represent anomaly values based on the GHCN dataset of land surface stations using a base period of 1961-1990. During the Northern Hemisphere winter 2010 (December 2009 - February 2010), above-average precipitation fell over areas that included northern and northeastern Australia, parts of eastern Asia, and much of Europe, South America, and the southern and eastern contiguous United States. The driest anomalies during December 2009 - February 2010 were observed across the Hawaiian islands, Alaskan panhandle, eastern Brazil, northern Europe, and parts of the western equatorial and southern Pacific islands.
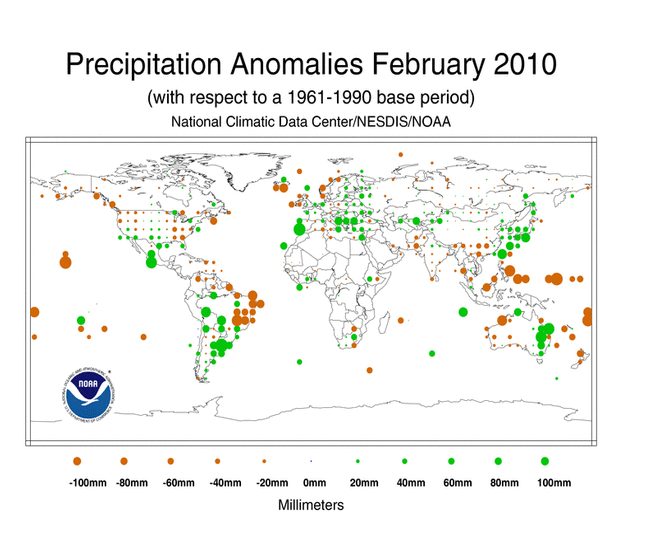
During February 2010, above-average precipitation fell over areas that included eastern Australia, and parts of Mexico, Europe, eastern Asia, southern South America, and the southern contiguous United States. The areas with the driest anomalies during February 2010 were observed across Iceland, the Hawaiian islands, eastern Brazil, and across the western equatorial and southern Pacific islands.

According to the Beijing Climate Center (BCC), the monthly averaged precipitation across China was 17 mm (0.67 inch) during February 2010, just 0.60 mm (0.02 inch) above the 1971-2000 average. It was reported that the provinces of Xinjiang and Zhejiang had their second wettest February since national records began in 1951. Conversely, the provinces of Guizhou and Gaungxi had their driest and second driest February on record, respectively. Moderate to severe drought continued to affect the provinces of Yunnan, Guizhou, southern Sichuan, and western Guangxi as less precipitation fell and warmer temperatures affected the area during February 2010. Continuing drought conditions affected over 15 million people and caused 13.1 billion yuan (1.9 billion U.S. dollars) in economic losses.
According to New Zealand's National Institute of Water and Atmospheric Research (NIWA), frequent high pressure systems affected New Zealand during February 2010, resulting in a warm and dry February. It was reported that severe soil moisture deficits continued in the region of Northland during the month, and began to develop across parts of Auckland, Marlborough, Canterbury, and Otago. NIWA reported that Auckland experienced a record dry February, when less than 10 percent of normal rainfall was observed in February 2010.
Dry conditions also affected most of the Irish Republic during February 2010. According to the Irish Meteorological Service, most of the Irish Republic had below-average precipitation totals for the entire December-February season, with several places observing nearly half of the seasonal total. Shannon Airport had its driest December-February period since December 1963 - February 1964.
Most of Canada had drier-than-average conditions during December 2009 - February 2010, with most areas having 20 percent less precipitation than average. Canada as a whole experienced its driest December-February period since national records began in 1948, with 22.0 percent below-average precipitation—surpassing the previous record set during the winter of 1977/1978 (20.1 percent below average), according to Environment Canada.
According to the Australian Bureau of Meteorology (BoM), nationally averaged precipitation was 20 percent above average for February 2010. New South Wales had a state average precipitation of 106.5 mm (4.2 inches) during February—the highest monthly state averaged precipitation since February 1976, when 151.9 mm (6.0 inches) of precipitation were observed statewide. Heavy rain fell during the last week of February 2010 across central Australia, dumping nearly 200 mm (7.9 inches) of precipitation—resulting in one of the wettest months in the area since January 2001. Western Australia experienced drier-than-average conditions during February 2010, with much of the Perth metropolitan area experiencing their driest December-February on record, and having a record 100-day dry spell. The Perth Metro had 0.2 mm (0.01 inch) of precipitation during December 2009 - February 2010, surpassing the previous low record of 0.8 mm (0.3 inch) set in December 1974 - February 1975. The average precipitation for the area during December-February is 35.1 mm (1.38 inches). Of note, the Australian BoM reported that there were no tropical cyclones in the Australian region (90°E-160°E) during February 2010—the first time this has happened since reliable records began in the 1960's.
Additional details on flooding and drought events around the world can also be found on the February 2010 Global Hazards page.
References
Peterson, T.C. and R.S. Vose, 1997: An Overview of the Global Historical Climatology Network Database. Bull. Amer. Meteorol. Soc., 78, 2837-2849.
Quayle, R.G., T.C. Peterson, A.N. Basist, and C. S. Godfrey, 1999: An operational near-real-time global temperature index. Geophys. Res. Lett., 26, 333-335.
Smith, T.M., and R.W. Reynolds (2005), A global merged land air and sea surface temperature reconstruction based on historical observations (1880-1997), J. Clim., 18, 2021-2036.
Smith, et al (2008), Improvements to NOAA's Historical Merged Land-Ocean Surface Temperature Analysis (1880-2006), J. Climate., 21, 2283-2293.