Contents of this Section:
 November 2010 Selected Climate
Anomalies and Events Map
Global Highlights
- The combined global land and ocean average surface temperature for November 2010 was 0.69°C (1.24°F) above the 20th century average of 12.9°C (55.2°F). This was the second warmest such period on record. 2004 was the warmest November on record.
- The combined global land and ocean average surface temperature for fall (September–November) 2010 was the sixth warmest on record for the season, 0.58°C (1.04°F) above the 20th century average of 14.0°C (57.1°F).
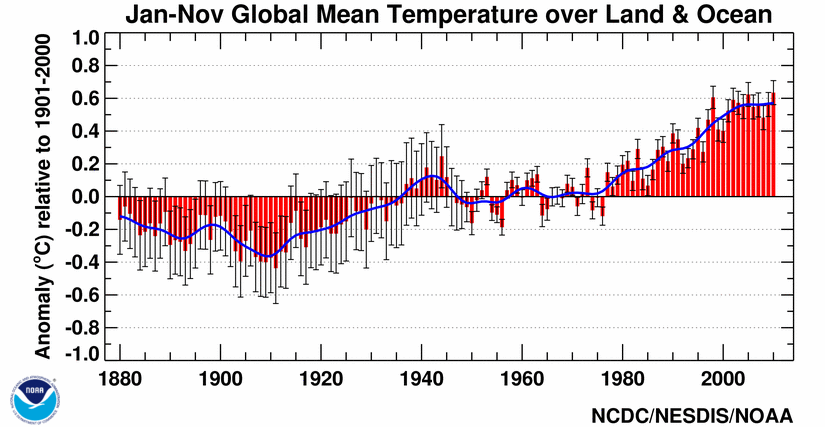
- For the 2010 year-to-date (January–November), the combined global land and ocean surface temperature was 0.64°C (1.15°F) above the 20th century average—the warmest such period since records began in 1880.
- The November 2010 Northern Hemisphere land and ocean surface temperature was the warmest November on record, while the Southern Hemisphere land and ocean surface temperature was the 13th warmest November on record.
- The November 2010 global land surface temperature was the warmest on record, at 1.52°C (2.74°F) above the 20th century average, while the November global ocean temperature tied with 1987 and 2008 as the tenth warmest on record, at 0.39°C (0.70°F) above average.
- The January–November 2010 Northern Hemisphere land surface temperature was the second warmest such period on record, while the Southern Hemisphere was the fourth warmest on record.
Please Note: The data presented in this report are preliminary. Ranks and anomalies may change as more complete data are received and processed. Effective with the July 2009 State of the Climate Report, NCDC transitioned to the new version (version 3b) of the extended reconstructed sea surface temperature (ERSST) dataset. ERSST.v3b is an improved extended SST reconstruction over version 2. For more information about the differences between ERSST.v3b and ERSST.v2 and to access the most current data, please visit NCDC's Global Surface Temperature Anomalies page.
Introduction
Temperature anomalies for November 2010, September–November 2010, and January–November are shown on the dot maps in this section. The dot maps on the left provide a spatial representation of anomalies calculated from the Global Historical Climatology Network (GHCN) dataset of land surface stations using a 1961–1990 base period. The dot maps on the right are a product of a merged land surface and sea surface temperature (SST) anomaly analysis developed by Smith et al. (2008). For the merged land surface and SST analysis, temperature anomalies with respect to the 1971–2000 average for land and ocean are analyzed separately and then merged to form the global analysis. For more information, please visit NCDC's Global Surface Temperature Anomalies page.
November
The combined global land and ocean surface temperature for November 2010 was the second warmest November, behind 2004, since global temperature records began in 1880. The combined global land and ocean temperature was 0.69°C (1.24°F) above the 20th century average of 12.9°C (55.2°F). The combined land and ocean surface temperature for November in the Northern Hemisphere was the warmest on record, while the combined land and ocean surface temperature in the Southern Hemisphere ranked as the 13th warmest such period on record. The globally averaged land temperature was the warmest on record, at 1.52°C (2.74°F) above the 20th century average of 5.9°C (42.6°F). The Northern Hemisphere November land temperature was also the warmest on record, while the Southern Hemiphere land temperature ranked as the 21st warmest on record. More than two-thirds of the Earth's land mass is located in the Northern Hemisphere.
The El Niño-Southern Oscillation (ENSO) is a periodic fluctuation in sea surface temperature (El Niño) and the air pressure of the overlying atmosphere (Southern Oscillation) across the equatorial Pacific Ocean, affecting weather patterns in many parts of the world. In November, a moderate-to-strong cold phase (La Niña) ENSO persisted as sea surface temperaures in the eastern and equatorial Pacific Ocean remained cooler than normal. The November 2010 worldwide averaged ocean temperature tied with 1987 and 2008 as the tenth warmest on record, 0.39°C (0.70°F) above the 20th century average of 15.8°C (60.4°F). The Northern Hemisphere averaged ocean temperature was also the tenth warmest on record and the Southern Hemisphere ocean temperature tied with 1996 and 2008 as the 12th warmest on record. According to NOAA's Climate Prediction Center (CPC), La Niña is expected to peak during November 2010–January 2011 and last at least into the Northern Hemisphere spring 2011.
The most notable warm anomalies around the world during November 2010 occurred across the northern high latitudes, including Alaska and a large swath of Canada and encompassed most of Europe and Asia. The coolest anomalies were seen over Scandinavia, most of Australia, and the eastern and central Pacific Ocean.
Australia was cooler than normal for the month, particularly across much of the northern and eastern portions of the country. The Australian Bureau of Meteorology reported that nationally averaged maximum temperaures were 1.23°C below the normal, which is the lowest since 1999 and seventh lowest on record. In central Queensland, maximum temperatures were up to 6°C (10.8°F) cooler than average for November. However, maximum temperatures were more than 4°C (7.2°F) above normal along the central coast of Western Australia.
According to the United Kingdom (UK) Met Office, the UK as a whole experienced its coldest November since 1993, primarily due to a very cold week at the end of the month. Average temperatures for the month were about 1.5–2.0°C (2.7–3.6°F) below the 1971–2000 average. Most stations in Ireland reported their coldest monthly-averaged November temperatures since 1985.
Season (September–November)


The combined global land and ocean surface temperature during September–November (Northern Hemisphere fall; Southern Hemisphere spring) 2010 was the sixth warmest on record, at 0.58°C (1.04°F) above the 20th century average. The September–November globally averaged land temperature ranked as the second warmest on record, behind 2005. The seasonal temperature for the worldwide ocean surface tied with 1998 as the tenth warmest on record. During the season, the warmest temperature anomalies were present over much of the planet's surface, particularly the much of the northern high latitudes, northern Africa, eastern Europe, western Asia, and the Middle East. Cooler-than-average conditions were present across the central and eastern equatorial Pacific Ocean, most of Australia, and northwestern Europe.
According to Environment Canada, the country experienced its second warmest September–November since records began in 1948. On average, temperatures were 2.1°C (3.8°F) above normal. The warmest fall on record for Canada occurred in 1998, when the average temperature was 2.3°C (4.1°F) above normal. Both the Arctic Tundra and Arctic Mountains and Fiords climate regions experienced their second warmest fall seasons. The Arctic Tundra was 4.5°C (8.1°F) above normal while the Arctic Mountains and Fjords were 3.9°C (7.0°F) above normal.
In the Southern Hemiphere, Australia recorded its fourth coldest spring (Northern Hemisphere fall) on record. Nationally averaged maximum temperatures were 1.23°C (2.21°F) below average for the season. The Northern Territory experienced its coldest spring on record, while Queensland and South Australia had their second and third coldest springs, respectively. According to the Australian Bureau of Meteorology, widespread heavy rainfall contributed to the cooler daytime temperatures.
The average position of the upper-level ridges of high pressure and troughs of low pressure (depicted by positive and negative 500-millibar height anomalies on the  November 2010 map and
  September–November 2010, respectively) are generally reflected by areas of positive and negative temperature anomalies at the surface, respectively. For other Global products, please see the Climate Monitoring Global Products page.
Year-to-date (January–November)


The global combined land and ocean surface temperature for the year-to-date through November was 0.64°C (1.15°F) above the 20th century average—the warmest such period since records began in 1880. The combined land and ocean surface temperature through November in the Northern Hemisphere was also the warmest on record, while the combined land and ocean surface temperature in the Southern Hemisphere tied with 2005 as the fifth warmest such period on record. The globally averaged land temperature was 1.02°C (1.84°F) above average, which was the warmest January–November in the period of record.
The shift from a warm phase to a cold phase ENSO during 2010 contributed to a globally averaged January–November ocean surface temperature anomaly of 0.50°C (0.90°F) above the 20th century average, tying with 2005 as the third warmest such period on record. Images of sea surface temperature conditions are available for all weeks during 2010 from the weekly SST page.
Warmer-than-average temperatures occurred during the year-to-date (January–November) for most of the world's surface. The warmest 11-month above-average temperatures occurred throughout the high latitude regions of the Northern Hemisphere, Canada, Alaska, the tropical Atlantic Ocean, the Middle East, eastern Europe, and northern Africa. Temperatures were notably cooler across the Southern oceans, most of the eastern Pacific Ocean, western Scandinavia, parts of central Russia, and parts of Australia.
According to Environment Canada, 2010 set a record as the warmest January–November period for the country, 2.9°C (5.2°F) above normal. This value surpassed the previous record set in 2006 at 2.4°C (4.3°F) above normal. In addition to the second warmest fall (September–November) period on record during 2010, Canada also experienced its warmest spring (March–May) and winter (December 2009–February 2010) and third warmest summer (June–August) on record.
Temperature Rankings and Graphics
Current Month | Seasonal | Year-to-date
| November | Anomaly | Rank (out of 131 years) | (Next) Warmest on Record | ||||
|---|---|---|---|---|---|---|---|
| °C | °F | Year | °C | °F | |||
| Global | |||||||
| Land | +1.52 ± 0.07 | +2.74 ± 0.13 | Warmest | (2004) | +1.34 | +2.41 | |
| Ocean | +0.39 ± 0.07 | +0.70 ± 0.13 | 10th warmest* | 1997 | +0.55 | +0.99 | |
| Land and Ocean | +0.69 ± 0.08 | +1.24 ± 0.14 | 2nd warmest | 2004 | +0.72 | +1.30 | |
| Northern Hemisphere | |||||||
| Land | +1.97 ± 0.08 | +3.55 ± 0.14 | Warmest | (2001) | +1.58 | +2.84 | |
| Ocean | +0.41 ± 0.08 | +0.74 ± 0.14 | 10th warmest | 2006 | +0.65 | +1.17 | |
| Land and Ocean | +0.99 ± 0.09 | +1.78 ± 0.16 | Warmest | (2004) | +0.95 | +1.71 | |
| Southern Hemisphere | |||||||
| Land | +0.35 ± 0.06 | +0.63 ± 0.11 | 21st warmest* | 2009 | +1.11 | +2.00 | |
| Ocean | +0.39 ± 0.06 | +0.70 ± 0.11 | 12th warmest* | 1997 | +0.57 | +1.03 | |
| Land and Ocean | +0.38 ± 0.06 | +0.68 ± 0.11 | 13th warmest | 2009 | +0.62 | +1.12 | |
*Signifies a tie
*Global Ocean tied with 1987 and 2008 as the tenth warmest November on record.
*Southern Hemisphere Ocean tied with 1996 and 2008 as the 12th warmest November on record.

| September–November | Anomaly | Rank (out of 131 years) | Warmest on Record | ||||
|---|---|---|---|---|---|---|---|
| °C | °F | Year | °C | °F | |||
| Global | |||||||
| Land | +1.03 ± 0.06 | +1.85 ± 0.11 | 2nd warmest | 2005 | +1.13 | +2.03 | |
| Ocean | +0.41 ± 0.06 | +0.74 ± 0.11 | 10th warmest* | 2003 | +0.56 | +1.01 | |
| Land and Ocean | +0.58 ± 0.07 | +1.04 ± 0.13 | 6th warmest | 2005 | +0.66 | +1.19 | |
| Northern Hemisphere | |||||||
| Land | +1.24 ± 0.07 | +2.23 ± 0.13 | 2nd warmest | 2005 | +1.27 | +2.29 | |
| Ocean | +0.43 ± 0.07 | +0.77 ± 0.13 | 10th warmest | 2006 | +0.64 | +1.15 | |
| Land and Ocean | +0.74 ± 0.07 | +1.33 ± 0.13 | 2nd warmest | 2005 | +0.83 | +1.49 | |
| Southern Hemisphere | |||||||
| Land | +0.46 ± 0.05 | +0.83 ± 0.09 | 13th warmest* | 2009 | +0.93 | +1.67 | |
| Ocean | +0.41 ± 0.05 | +0.74 ± 0.09 | 11th warmest | 1997 | +0.58 | +1.04 | |
| Land and Ocean | +0.41 ± 0.05 | +0.74 ± 0.09 | 12th warmest | 1997 | +0.62 | +1.12 | |
*Signifies a tie
*Global Ocean tied with 1998 as the tenth warmest September–November on record.
*Southern Hemisphere Land tied with 1994 as the 13th warmest September–November on record.

| January–November | Anomaly | Rank (out of 131 years) | (Next) Warmest on Record | ||||
|---|---|---|---|---|---|---|---|
| °C | °F | Year | °C | °F | |||
| Global | |||||||
| Land | +1.02 ± 0.04 | +1.84 ± 0.07 | Warmest | (2007) | +1.00 | +1.80 | |
| Ocean | +0.50 ± 0.04 | +0.90 ± 0.07 | 3rd warmest* | 1998 | +0.52 | +0.94 | |
| Land and Ocean | +0.64 ± 0.05 | +1.15 ± 0.09 | Warmest | (2005) | +0.62 | +1.12 | |
| Northern Hemisphere | |||||||
| Land | +1.14 ± 0.05 | +2.05 ± 0.09 | 2nd warmest | 2007 | +1.15 | +2.07 | |
| Ocean | +0.52 ± 0.04 | +0.94 ± 0.07 | 2nd warmest* | 2005 | +0.54 | +0.97 | |
| Land and Ocean | +0.76 ± 0.05 | +1.37 ± 0.09 | Warmest | (2005) | +0.72 | +1.30 | |
| Southern Hemisphere | |||||||
| Land | +0.68 ± 0.03 | +1.22 ± 0.05 | 4th warmest | 2005 | +0.83 | +1.49 | |
| Ocean | +0.50 ± 0.03 | +0.90 ± 0.05 | 4th warmest | 1998 | +0.55 | +0.99 | |
| Land and Ocean | +0.52 ± 0.03 | +0.94 ± 0.05 | 5th warmest* | 1998 | +0.59 | +1.06 | |
*Signifies a tie
*Global Ocean tied with 2005 as the third warmest January–November on record.
*Northern Hemisphere Land tied with 2007 as the warmest January–November on record. The second warmest such period occurred in 2005.
*Northern Hemisphere Ocean tied with 2004 as the second warmest January–November on record. The warmest such period occurred in 2005.
*Southern Hemisphere Land and Ocean tied with 2005 as the fifth warmest January–November on record.


The most current data may be accessed via the Global Surface Temperature Anomalies page.
Precipitation
The maps below represent anomaly values based on the GHCN dataset of land surface stations using a base period of 1961–1990.
November


During November 2010, the most notable wetter-than-average conditions were seen across western Alaska, Central America, northern and western India, and eastern Australia. The driest anomalies were present across part of the southwestern United States, northern Scandinavia, northern Africa, and parts of East Asia.
November was very wet across Australia's eastern states. Queensland and New South Wales each recorded its wettest November since 2000 while Victoria recorded its wettest such period since 1992. Nationally averaged rainfall was 71 percent above normal. However, Western Austrlia reported its driest November since 1997.
September–November

The areas with the wettest anomalies during September–November (Northern Hemisphere fall; Southern Hemisphere spring) included Central America, Southeast Asia, much of southern India, and eastern Australia. The driest anomalies during this period were observed over northern and western Amazonia, the Hawaiian islands, French Polynesia, and part of far western Canada.
Australia experienced its wettest spring (September–November; Northern Hemisphere fall) in 2010. The Australian Bureau of Meteorology reported that nationally averaged precipitation was 163.0 mm (6.4 inches), which is 125 percent above normal and 23.1 mm (0.9 inches) greater than the previous record set in 1975. At the state level, the Northern Territory, Queensland, and New South Wales each had their wettest springs on record, while South Australia experienced its second wettest such period on record, behind 1975. However, it should be noted, that in deep contrast to most of the country, southwest Western Australia had its driest spring on record.
Year-to-date (January–November)

Global precipitation for the period January–November was well above the 1961–1990 average, ranking fourth wettest on record since 1900. Regionally, drier than average conditions were widespread across much of French Polynesia, the Solomon Islands, Hawaiian Islands, northwestern Canada, extreme northwest and northeast Brazil, and southern Peru. The wettest regions induded most of Central America, much of India, southwestern China, east Asia, Borneo, and parts of Australia.
References
Peterson, T.C. and R.S. Vose, 1997: An Overview of the Global Historical Climatology Network Database. Bull. Amer. Meteorol. Soc., 78, 2837-2849.
Quayle, R.G., T.C. Peterson, A.N. Basist, and C. S. Godfrey, 1999: An operational near-real-time global temperature index. Geophys. Res. Lett., 26, 333-335.
Smith, T.M., and R.W. Reynolds (2005), A global merged land air and sea surface temperature reconstruction based on historical observations (1880-1997), J. Clim., 18, 2021-2036.
Smith, et al (2008), Improvements to NOAA's Historical Merged Land-Ocean Surface Temperature Analysis (1880-2006), J. Climate., 21, 2283-2293.