Global Highlights:
- Based on preliminary data, the globally averaged combined land and sea surface temperature was the fifteenth warmest on record for February, the sixteenth warmest for boreal winter (December-February), and the January-February year-to-date period ranked twenty-second warmest.
- The presence of a strong La Niña contributed to a global average temperature that was the coolest since the La Niña episode of 2000-2001.
- December-February 2008 temperatures were above average in Europe, western and central Russia, the eastern and south-central contiguous U.S., and parts of eastern Asia. Cooler-than-average conditions occurred from the Middle East region to parts of China, north-central and the southwestern states of the contiguous U.S., and parts of Australia.
- Precipitation during December-February 2008 was above average in Great Britain, Scandinavia, the northeastern and central regions of the contiguous U.S., and parts of the Hawaiian Islands, Australia, and the northwestern countries of South America. Drier-than-average conditions were observed in western and south-central U.S., most of Europe, and parts of the southern countries of South America.
- Mature La Niña conditions were present across the equatorial Pacific Ocean.
Contents of this Section:
The data presented in this report are preliminary. Ranks and anomalies may change as more complete data are received and processed. The most current data may be accessed via the Global Surface Temperature Anomalies page.
Introduction
Temperature anomalies for December 2007 - February 2008 and February 2008 are shown on the dot maps below. The dot maps, below left, provide a spatial representation of anomalies calculated from the Global Historical Climatology Network (GHCN) data set of land surface stations using a 1961-1990 base period. The dot maps, below right, are a product of a merged land surface and sea surface temperature anomaly analysis developed by Smith and Reynolds (2005). Temperature anomalies with respect to the 1961-1990 mean for land and ocean are analyzed separately and then merged to form the global analysis. Additional information on this product is available.
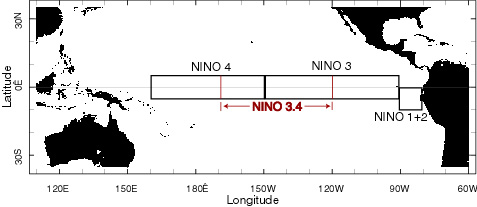
Unlike January-February 2007 when warm anomalies covered much of the globe, January-February 2008 had cooler-than-average temperatures across the Middle East region, Kazakhstan, Mongolia, Alaska, parts of the western and north-central contiguous U.S., northern Africa, and most of China. The map of temperature anomalies shows the presence of warmer-than-average temperatures across Europe, western and central Russia, central and western Australia, and the southern Plains to the eastern Great Lakes of the contiguous U.S. Warmer-than-average sea surface temperatures (SSTs) were present in the Atlantic and Indian oceans, the Niño 1+2 region, and parts of the northwest Pacific Ocean. Cooler-than-average conditions were observed in all Niño regions (with the exception of Niño 1+2 region), parts of the northeastern Pacific and some areas in the southern oceans.
During the boreal winter, temperatures were above average across Europe, western and central Russia, eastern Brazil, the eastern and south-central contiguous U.S., parts of eastern Asia, and southern parts of Chile and Argentina. Cooler-than-average conditions occurred from the Middle East region to parts of China, north-central and the southwestern states of the contiguous U.S., and eastern Australia.
As shown in the maps below, temperatures across Europe were 2-5°C (4-9°F) above average. These warm anomalous conditions resulted in the warmest winter in Finland since records began more than a century ago. During December 2007 - February 2008, Southern Finland experienced a total of 20-30 days of below zero mean temperatures, while Central Finland had only 45-55 days. This was 30-40 and 25-35 days less than typical for Southern and Central Finland, respectively. These conditions also led to a reduction of number of days that had at least 1 cm (0.4 inches) of snow on the ground, with Southern and Southwestern Finland experiencing a total of 20-30 days while Central Finland had 50-60 days. Typically, snow covers the ground more than 70 days during the winter. According to the Finnish Meteorology Institute (FMI), the second mildest winter occurred in 1924-1925.
According to reports (released on 26 February 2008), Sweden might have experienced its warmest winter since records began in 1756. The previous record was set during the winter of 1972-1973 when the mean temperature for winter was 1.9°C (3.4°F). Since the report was released, the data available at the time suggested the winter 2007-2008 mean temperature average would be near 2.0-2.2°C (3.6-4°F) (BBC News).
During February, above average temperatures were observed across Europe, most of Russia, northwestern and southern parts of Africa, southern Chile and Argentina, and the eastern and south-central states of the contiguous U.S. Meanwhile, cooler-than-average conditions were present across China, northern India, western Alaska, the northcentral states of the contiguous U.S., parts of central Africa, eastern and southern Australia, and parts of the Middle East Region.
According to the Bureau of Meteorology (BoM), New South Wales, Australia experienced anomalously cool conditions during February. The state anomaly of -2.67°C (4.81°F) was the second lowest on record, behind 1954.
February SSTs were warmer than average in the Atlantic and parts of the North Indian and northwestern Pacific oceans. Cooler-than-average conditions were present in parts of the southern oceans and in the Niño regions, with the exception of the Niño 1+2 region where the monthly temperature anomaly rose to +0.23°C (+0.41°F). Temperature anomalies across the Niño 3.4 and 4 regions remained more than 1°C (1.8°F) below average. Please see the latest ENSO discussion for additional information.

The mean position of the upper level ridges of high pressure and troughs of low pressure (depicted by positive and negative 500-millibar height anomalies on the December-February 2008 map and the February map) are generally reflected by areas of positive and negative temperature anomalies at the surface, respectively. For other Global products see the Climate Monitoring Global Products page.
Images of sea surface temperature conditions are available for all weeks during 2008 at the weekly SST page.
Temperature Rankings and Graphics
Current Month / Seasonal / Year-to-date
Effective with the February 2006 report, NCDC transitioned from the use of the Operational Global Surface Temperature Index (Quayle et al. 1999) to the blended land and ocean dataset developed by Smith and Reynolds (2005). The differences between the two methods are discussed in Smith et al. (2005).
The combined global land and ocean surface temperature was the fifteenth warmest on record in February and the sixteenth warmest on record for boreal winter (December-February). The presence of a strong La Niña contributed to a global average temperature that was the coolest since the La Niña episode of 2000-2001.
| February | Anomaly | Rank | Warmest (or Next Warmest) Year on Record |
|---|---|---|---|
GlobalLandOcean Land and Ocean |
+0.62°C (+1.12°F) +0.29°C (+0.52°F) +0.38°C (+0.68°F) |
21st warmest 12th warmest 15th warmest |
2002 (+1.65°C/2.97°F) 1998 (+0.55°C/0.99°F) 1998 (+0.82°C/1.48°F) |
Northern HemisphereLandOcean Land and Ocean |
+0.70°C (+1.26°F) +0.26°C (+0.47°F) +0.43°C (+0.77°F) |
21st warmest 10th warmest 15th warmest |
2002 (+2.14°C/3.85°F) 1998 (+0.53°C/0.95°F) 2002 (+1.04°C/1.87°F) |
Southern HemisphereLandOcean Land and Ocean |
+0.34°C (+0.61°F) +0.33°C (+0.59°F) +0.33°C (+0.59°F) |
20th warmest 20th warmest 17th warmest |
1983 (+0.94°C/1.69°F) 1998 (+0.57°C/1.03°F) 1998 (+0.61°C/1.10°F) |
| December-February | Anomaly | Rank | Warmest (or Next Warmest) Year on Record |
|---|---|---|---|
GlobalLandOcean Land and Ocean |
+0.48°C (+0.86°F) +0.26°C (+0.47°F) +0.32°C (+0.58°F) |
23rd warmest 16th warmest 16th warmest |
2007 (+1.38°C/2.48°F) 1998 (+0.55°C/0.99°F) 2007 (+0.72°C/1.30°F) |
Northern HemisphereLandOcean Land and Ocean |
+0.51°C (+0.92°F) +0.27°C (+0.49°F) +0.36°C (+0.65°F) |
26th warmest 11th warmest 14th warmest |
2007 (+1.61°C/2.90°F) 1998 (+0.52°C/0.94°F) 2007 (+0.92°C/1.66°F) |
Southern HemisphereLandOcean Land and Ocean |
+0.36°C (+0.65°F) +0.26°C (+0.47°F) +0.28°C (+0.50°F) |
15th warmest 26th warmest 23rd warmest |
1998 (+0.80°C/1.44°F) 1998 (+0.57°C/1.03°F) 1998 (+0.61°C/1.10°F) |

| January-February | Anomaly | Rank | Warmest (or Next Warmest) Year on Record |
|---|---|---|---|
GlobalLandOcean Land and Ocean |
+0.30°C (+0.54°F) +0.27°C (+0.49°F) +0.28°C (+0.50°F) |
34th warmest 15th warmest 22nd warmest |
2002 (+1.55°C/2.79°F) 1998 (+0.54°C/0.97°F) 2007 (+0.73°C/1.31°F) |
Northern HemisphereLandOcean Land and Ocean |
+0.27°C (+0.49°F) +0.26°C (+0.47°F) +0.26°C (+0.47°F) |
45th warmest 11th warmest 28th warmest |
2002 (+2.01°C/3.62°F) 1998 (+0.52°C/0.94°F) 2002 (+0.99°C/1.78°F) |
Southern HemisphereLandOcean Land and Ocean |
+0.39°C (+0.70°F) +0.29°C (+0.52°F) +0.30°C (+0.54°F) |
14th warmest 22nd warmest 18th warmest |
1998 (+0.81°C/1.46°F) 1998 (+0.56°C/1.01°F) 1998 (+0.59°C/1.06°F) |
The most current data may be accessed via the Global Surface Temperature Anomalies page.
Precipitation
The maps below represent anomaly values based on the GHCN data set of land surface stations using a base period of 1961-1990. During boreal winter, above average precipitation fell over areas that include Great Britain, Scandinavia, the northeastern and central regions of the contiguous U.S., and parts of the Hawaiian Islands, Australia, and the northwestern countries of South America. Drier-than-average conditions were observed in western and south-central U.S., most of Europe, and parts of the southern countries of South America.
During February 2008, above average precipitation fell over areas that include the Philippines, northern and eastern Australia, the Hawaiian Islands, parts of the northwestern countries of South America, and the eastern and parts of the central contiguous U.S. Drier-than-average conditions were observed across most of Europe, the south-central and western parts of the contiguous U.S., parts of Brazil and eastern Asia.
Although much needed rain fell over the southeastern region of the contiguous U.S. during February, exceptional drought continued to affect the area. Spain suffered from the worst drought in more than a decade while Portugal had the worst winter drought since 1917. Meanwhile, in the Hawaiian and the Philippine islands, heavy rain fell prompting widespread floods. Additional details on flooding and drought can also be found on the February Global Hazards page.
ENSO SST Analysis
Below average sea surface temperature (SST) anomalies continued in all the Niño regions with the exception of the Niño 1+2 region where SST anomalies were warmer than average. These conditions are indicative of a mature ENSO cold event (shown in the adjacent animation of weekly sea surface temperature anomalies). A comprehensive summary of February 2008 ENSO conditions can be found on the ENSO monitoring page. For the latest advisory on ENSO conditions go to NOAA's Climate Prediction center (CPC) and the CPC ENSO Diagnostic Discussion.
Images of sea surface temperature conditions are available for all weeks since 2003 at the weekly SST page.
References
Peterson, T.C. and R.S. Vose, 1997: An Overview of the Global Historical Climatology Network Database. Bull. Amer. Meteorol. Soc., 78, 2837-2849.
Quayle, R.G., T.C. Peterson, A.N. Basist, and C. S. Godfrey, 1999: An operational near-real-time global temperature index. Geophys. Res. Lett., 26, 333-335.
Smith, T.M., and R.W. Reynolds (2005), A global merged land air and sea surface temperature reconstruction based on historical observations (1880-1997), J. Clim., 18, 2021-2036.