Global Highlights:
- Based on preliminary data, the globally averaged combined land and sea surface temperature was the fifth warmest on record for September and the fourth warmest on record for January-September year-to-date period.
- September 2007 temperatures were above average in the contiguous U.S., Australia, and most of Alaska and Asia. Cooler-than-average conditions occurred in Peru and central Europe.
- Precipitation during September 2007 was above average in Japan, North and South Korea, the Philippines, and parts of India and Bangladesh. Drier-than-average conditions were observed in the northern and southern eastern region of the contiguous U.S., southeastern Australia, and parts of South America and eastern Asia.
- Cold phase (La Niña) ENSO conditions strengthened during September.
Contents of this Section:
The data presented in this report are preliminary. Ranks and anomalies may change as more complete data are received and processed. The most current data may be accessed via the Global Surface Temperature Anomalies page.
Introduction
Temperature anomalies for September 2007 are shown on the dot maps below. The dot map, below left, provides a spatial representation of anomalies calculated from the Global Historical Climatology Network (GHCN) data set of land surface stations using a 1961-1990 base period. The dot map, below right, is a product of a merged land surface and sea surface temperature anomaly analysis developed by Smith and Reynolds (2005). Temperature anomalies with respect to the 1961-1990 mean for land and ocean are analyzed separately and then merged to form the global analysis. Additional information on this product is available.
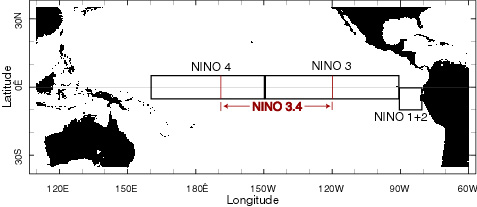
Anomalously warm temperatures have covered much of the globe throughout the year. The January-September 2007 map of temperature anomalies shows the presence of warmer-than-average temperatures across all land areas, with the exception of the southern countries located in South America and the south central states in the contiguous U.S. Warmer-than-average Sea Surface Temperatures (SSTs) occurred in the Atlantic, Indian, and the Northwest Pacific oceans. Cooler-than-average conditions were observed in the Niño 1+2 and 3 regions, the northeastern Pacific and some areas in the southern oceans.
During September, there were above average temperatures across southeastern Brazil, Paraguay, Uruguay, the contiguous U.S., Australia, northwestern and southeastern Africa, and most of Alaska and Asia. Cooler-than-average conditions occurred in Peru and central Europe. Meanwhile, SST anomalies in the Niño 3.4 region became increasingly negative during September, indicating development of an ENSO cold event (La Niña). Please see the latest ENSO discussion for additional information.
The mean position of the upper level ridges of high pressure and troughs of low pressure (depicted by positive and negative 500-millibar height anomalies on the September map) are generally reflected by areas of positive and negative temperature anomalies at the surface, respectively. For other Global products see the Climate Monitoring Global Products page.
Images of sea surface temperature conditions are available for all weeks during 2007 at the weekly SST page.
Temperature Rankings and Graphics
Effective with the February 2006 report, NCDC transitioned from the use of the Operational Global Surface Temperature Index (Quayle et al. 1999) to the blended land and ocean dataset developed by Smith and Reynolds (2005). The differences between the two methods are discussed in Smith et al. (2005).
September 2007 ranked as the fifth warmest September since records began in 1880 for combined global land and ocean surface temperatures. The September land surface temperature ranked second warmest on record, while the ocean surface temperature ranked ninth warmest in the 127-year record. The global surface temperature for the combined January-September year-to-date period was the fourth warmest January-September on record, while the global land surface temperature ranked warmest on record for January-September 2007.
| September | Anomaly | Rank | Ties | Warmest (or Next Warmest) Year on Record |
|---|---|---|---|---|
GlobalLandOcean Land and Ocean |
+0.85°C (+1.53°F) +0.38°C (+0.68°F) +0.51°C (+0.92°F) |
2nd warmest 9th warmest 5th warmest |
2000 2002 |
2005 (+1.04°C/1.87°F) 1997 (+0.54°C/0.97°F) 2005 (+0.64°C/1.15°F) |
Northern HemisphereLandOcean Land and Ocean |
+0.84°C (+1.51°F) +0.45°C (+0.81°F) +0.60°C (+1.08°F) |
2nd warmest 6th warmest 4th warmest |
2002 |
2005 (+1.20°C/2.16°F) 2003 (+0.67°C/1.21°F) 2005 (+0.83°C/1.49°F) |
Southern HemisphereLandOcean Land and Ocean |
+0.89°C (+1.60°F) +0.32°C (+0.58°F) +0.41°C (+0.74°F) |
5th warmest 11th warmest 7th warmest |
2001 |
1997 (+1.08°C/1.94°F) 1997 (+0.54°C/0.97°F) 1997 (+0.62°C/1.12°F) |

| January- September |
Anomaly | Rank | Ties | Warmest (or Next Warmest) Year on Record |
|---|---|---|---|---|
GlobalLandOcean Land and Ocean |
+1.04°C (+1.87°F) +0.41°C (+0.74°F) +0.58°C (+1.04°F) |
warmest 7th warmest 4th warmest |
2002 (+0.97°C/1.75°F) 1998 (+0.52°C/0.94°F) 1998 (+0.63°C/1.13°F) |
|
Northern HemisphereLandOcean Land and Ocean |
+1.23°C (+2.21°F) +0.44°C (+0.79°F) +0.74°C (+1.33°F) |
warmest 6th warmest warmest |
2002 (+1.10°C/1.98°F) 2005 (+0.55°C/0.99°F) 2005 (+0.71°C/1.28°F) |
|
Southern HemisphereLandOcean Land and Ocean |
+0.51°C (+0.92°F) +0.39°C (+0.70°F) +0.41°C (+0.74°F) |
5th warmest 8th warmest 8th warmest |
1988 1997 |
2005 (+0.85°C/1.53°F) 1998 (+0.54°C/0.97°F) 1998 (+0.58°C/1.04°F) |


The most current data may be accessed via the Global Surface Temperature Anomalies page.
Precipitation
The maps below represent anomaly values based on the GHCN data set of land surface stations using a base period of 1961-1990. During September 2007, above average precipitation fell over areas that include Japan, North and South Korea, the Philippines, southwestern Alaska, and parts of India, Bangladesh, Africa, and central Europe. Drier-than-average conditions were observed in the northern and southern eastern region of the contiguous U.S., southeastern Australia, and parts of South America and southeastern China. Additional details on flooding and drought can also be found on the September Global Hazards page.

ENSO SST Analysis
Sea Surface Temperature anomalies were cooler-than-normal across the eastern and central equatorial Pacific during September while warmer-than-normal anomalies were observed across the western equatorial Pacific. These conditions are indicative of a developing ENSO cold event (shown in the adjacent animation of weekly sea surface temperature anomalies). A comprehensive summary of September 2007 ENSO conditions can be found on the ENSO monitoring page. For the latest advisory on ENSO conditions go to NOAA's Climate Prediction center (CPC) and the CPC ENSO Diagnostic Discussion.
Images of sea surface temperature conditions are available for all weeks since 2003 at the weekly SST page.
References
Peterson, T.C. and R.S. Vose, 1997: An Overview of the Global Historical Climatology Network Database. Bull. Amer. Meteorol. Soc., 78, 2837-2849.
Quayle, R.G., T.C. Peterson, A.N. Basist, and C. S. Godfrey, 1999: An operational near-real-time global temperature index. Geophys. Res. Lett., 26, 333-335.
Smith, T.M., and R.W. Reynolds (2005), A global merged land air and sea surface temperature reconstruction based on historical observations (1880-1997), J. Clim., 18, 2021-2036.