Global Highlights:
- Based on preliminary data, the globally averaged combined land and sea surface temperature was the second warmest on record for the January-July year-to-date period and the seventh warmest for July.
- July 2007 temperatures were above average in the western U.S., central and southeastern Europe, eastern Brazil, northwestern Africa, southeastern Australia, and most of Asia. Cooler-than-average conditions occurred in the southern Plains to the eastern Great Lakes of the contiguous U.S., southern parts of South America, eastern parts of Asia, and northern Australia.
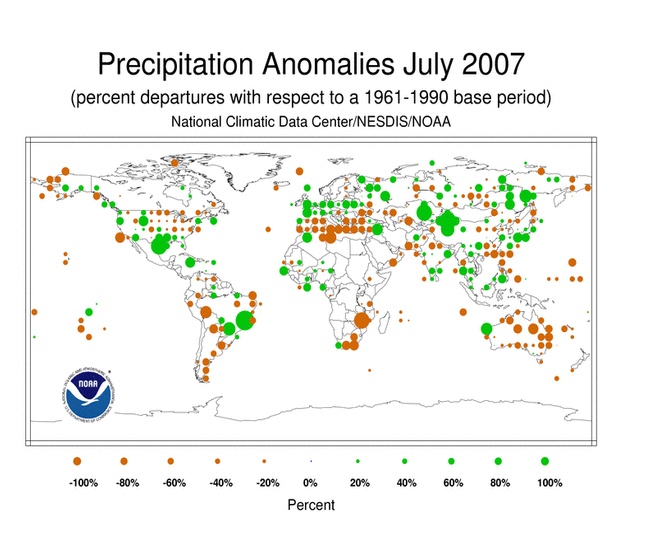
- Precipitation during July 2007 was variable in many areas. It was above average in northern Europe, the southern U.S., western parts of Africa, and southern and eastern parts of Asia. Drier-than-average conditions were observed in eastern Australia, north central and mid-Atlantic U.S., eastern Asia, parts of India, and South America.
- El Niño/Southern Oscillation (ENSO) conditions were in a neutral phase during July.
Contents of this Section:
The data presented in this report are preliminary. Ranks and anomalies may change as more complete data are received and processed. The most current data may be accessed via the Global Surface Temperature Anomalies page.
Introduction
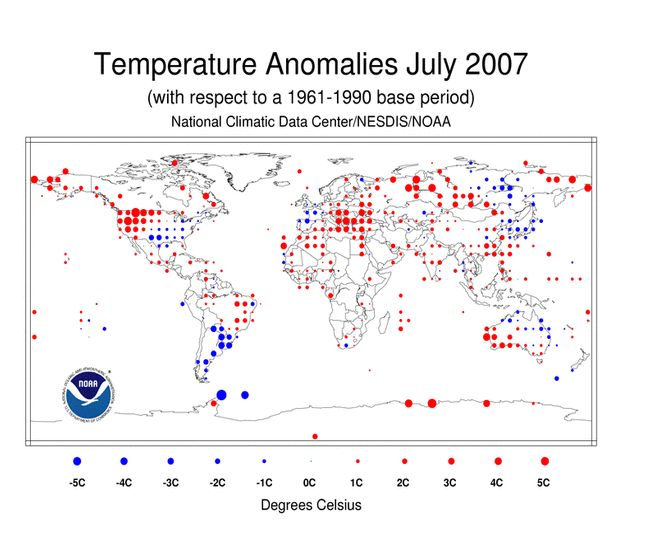
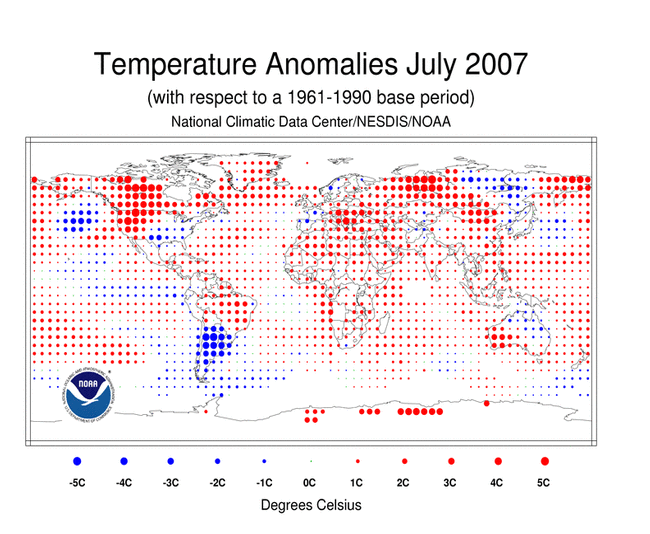
Temperature anomalies for July 2007 are shown on the dot maps below. The dot map, below left, provides a spatial representation of anomalies calculated from the Global Historical Climatology Network (GHCN) data set of land surface stations using a 1961-1990 base period. The dot map, below right, is a product of a merged land surface and sea surface temperature anomaly analysis developed by Smith and Reynolds (2005). Temperature anomalies with respect to the 1961-1990 mean for land and ocean are analyzed separately and then merged to form the global analysis. Additional information on this product is available.
Anomalously warm temperatures have covered much of the globe throughout the year. The January-July 2007 map of temperature anomalies shows the presence of warmer-than-average temperatures across all land areas, with the exception of Argentina. Warmer-than-average Sea Surface Temperatures (SSTs) occurred in the Atlantic, Indian, and the Northwest Pacific oceans. Cooler-than-average conditions were observed in the Niño 1+2 and 3 regions, the northeastern Pacific and some areas in the southern oceans.
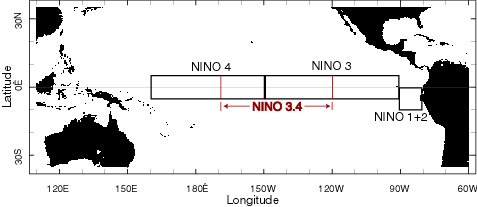
During July, there were above average temperatures across the western U.S., central and southeastern Europe, eastern Brazil, northwestern Africa, southeastern Australia, and most of Asia. The western U.S. and central and southeastern Europe suffered from severe heat waves which caused temperatures to exceeded 40°C (104°F) during July. Additional details on the effects of the heat waves can be found on the July Global Hazards page. Cooler-than-average conditions occurred in the southern Plains to the eastern Great Lakes of the contiguous U.S., southern parts of South America, eastern parts of Asia, and northern Australia. Meanwhile, SST anomalies in the Niño 3.4 region cooled slightly in July, but a neutral ENSO phase persisted. Please see the latest ENSO discussion for additional information.
The mean position of the upper level ridges of high pressure and troughs of low pressure (depicted by positive and negative 500-millibar height anomalies on the July map) are generally reflected by areas of positive and negative temperature anomalies at the surface, respectively. For other Global products see the Climate Monitoring Global Products page.
Images of sea surface temperature conditions are available for all weeks during 2007 at the weekly SST page.
Temperature Rankings and Graphics
Effective with the February 2006 report, NCDC transitioned from the use of the Operational Global Surface Temperature Index (Quayle et al. 1999) to the blended land and ocean dataset developed by Smith and Reynolds (2005). The differences between the two methods are discussed in Smith et al. (2005).
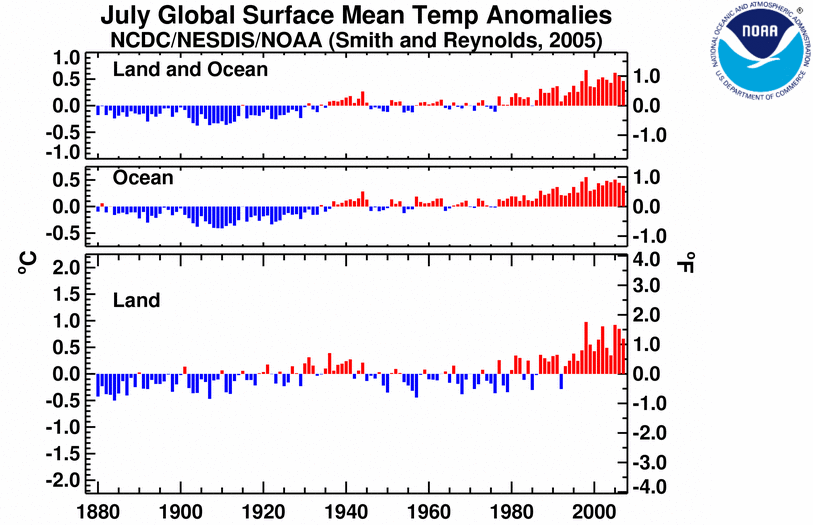
July 2007 ranked as the seventh warmest July since records began in 1880 for combined global land and ocean surface temperatures. The July land surface temperature ranked fifth warmest on record, while the ocean surface temperature ranked ninth warmest in the 127-year record. The global surface temperature for the combined January-July year-to-date period tied with 2002 and 2005 as the second warmest January-July on record, while the global land surface temperature ranked warmest on record for January-July 2007.
| July | Anomaly | Rank | Ties | Warmest (or Next Warmest) Year on Record |
|---|---|---|---|---|
GlobalLandOcean Land and Ocean |
+0.67°C (+1.21°F) +0.39°C (+0.70°F) +0.47°C (+0.85°F) |
5th warmest 9th warmest 7th warmest |
1998 (+0.98°C/1.76°F) 1998 (+0.55°C/0.99°F) 1998 (+0.67°C/1.21°F) |
|
Northern HemisphereLandOcean Land and Ocean |
+0.79°C (+1.42°F) +0.42°C (+0.76°F) +0.56°C (+1.01°F) |
5th warmest 8th warmest 6th warmest |
2002 (+1.02°C/1.84°F) 2005 (+0.64°C/1.15°F) 2005 (+0.76°C/1.37°F) |
|
Southern HemisphereLandOcean Land and Ocean |
+0.33°C (+0.59°F) +0.37°C (+0.67°F) +0.37°C (+0.67°F) |
26th warmest 9th warmest 13th warmest |
1987 |
1984 (+0.97°C/1.75°F) 1998 (+0.57°C/1.03°F) 1998 (+0.62°C/1.12°F) |

| January-July | Anomaly | Rank | Ties | Warmest (or Next Warmest) Year on Record |
|---|---|---|---|---|
GlobalLandOcean Land and Ocean |
+1.10°C (+1.98°F) +0.42°C (+0.76°F) +0.61°C (+1.10°F) |
warmest 6th warmest 2nd warmest |
2006 2002,2005 |
2002 (+1.05°C/1.89°F) 1998 (+0.53°C/0.95°F) 1998 (+0.65°C/1.17°F) |
Northern HemisphereLandOcean Land and Ocean |
+1.29°C (+2.32°F) +0.44°C (+0.79°F) +0.76°C (+1.37°F) |
warmest 4th warmest warmest |
2003 |
2002 (+1.22°C/2.20°F) 2005 (+0.53°C/0.95°F) 2002 (+0.72°C/1.30°F) |
Southern HemisphereLandOcean Land and Ocean |
+0.52°C (+0.94°F) +0.41°C (+0.74°F) +0.43°C (+0.77°F) |
5th warmest 8th warmest 6th warmest |
2004,2006 |
2005 (+0.90°C/1.62°F) 1998 (+0.56°C/1.01°F) 1998 (+0.60°C/1.08°F) |


The most current data may be accessed via the Global Surface Temperature Anomalies page.
Precipitation
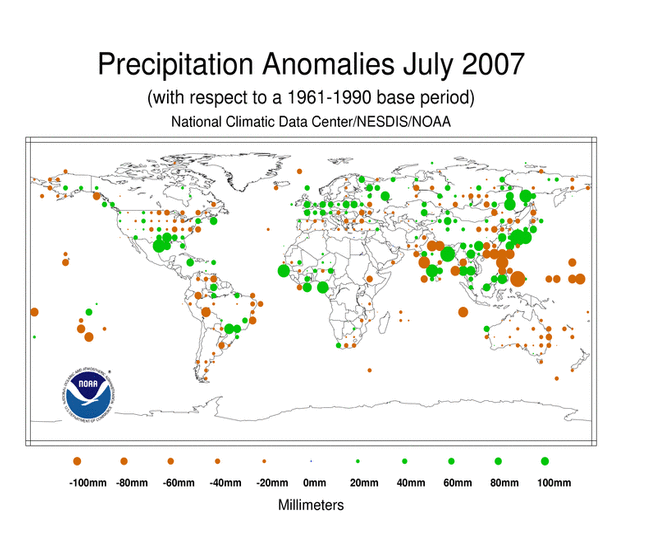
The maps below represent anomaly values based on the GHCN data set of land surface stations using a base period of 1961-1990. During July 2007, above average precipitation fell over areas that include northern Europe, especially the United Kingdom where heavy rains and floods occurred, the southern U.S., western parts of Africa, and southern and eastern parts of Asia. Drier-than-average conditions were observed in eastern Australia, north central and Mid-Atlantic U.S., eastern Asia, parts of India, and South America. Additional details on flooding and drought can also be found on the July Global Hazards page.
ENSO SST Analysis
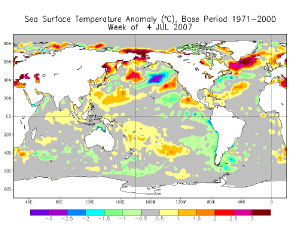
Sea Surface Temperature anomalies were slightly below average across the eastern and central equatorial Pacific during July while above average anomalies were observed across the western equatorial Pacific. These conditions are indicative of a neutral ENSO phase (shown in the adjacent animation of weekly sea surface temperature anomalies). A comprehensive summary of July 2007 ENSO conditions can be found on the ENSO monitoring page. For the latest advisory on ENSO conditions go to NOAA's Climate Prediction center (CPC) and the CPC ENSO Diagnostic Discussion.
Images of sea surface temperature conditions are available for all weeks since 2003 at the weekly SST page.
References
Peterson, T.C. and R.S. Vose, 1997: An Overview of the Global Historical Climatology Network Database. Bull. Amer. Meteorol. Soc., 78, 2837-2849.
Quayle, R.G., T.C. Peterson, A.N. Basist, and C. S. Godfrey, 1999: An operational near-real-time global temperature index. Geophys. Res. Lett., 26, 333-335.
Smith, T.M., and R.W. Reynolds (2005), A global merged land air and sea surface temperature reconstruction based on historical observations (1880-1997), J. Clim., 18, 2021-2036.