Global Highlights:
|
Contents of this Section: |
| The data presented in this report are preliminary. Ranks and anomalies may change as more complete data are received and processed. The most current data may be accessed via the Global Surface Temperature Anomalies page. |
Temperature anomalies for December
2006 are shown on the dot maps below. The dot map, below left,
provide a spatial representation of anomalies calculated from the
Global
Historical Climatology Network (GHCN) data set of land surface
stations using a 1961-1990 base period. The dot map, below right,
is a product of a merged land surface and sea surface temperature
anomaly analysis developed by Smith and Reynolds (2005).
Temperature anomalies with respect to the 1961-1990 mean for land
and ocean are analyzed separately and then merged to form the
global analysis. Additional information on this product is available. |

| During December, there
were above average temperatures across the U.S., Europe, southern
Asia, central Russia, eastern South America, and western coast of
Canada. Cooler than average temperatures were observed in the
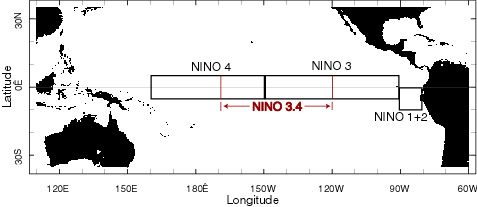
Middle East Region. Warmer than average SSTs occurred in the North
Atlantic and the Niño
regions. Temperatures in parts of these Niño regions
were more than 1°C (1.80°F) above average, and the average
temperature anomaly in the Niño 3.4 region increased in
December to approximately 1.37°C (2.47°F). Please see the
latest ENSO
discussion for additional information on the developing El
Niño event. |
 larger image |
 larger image |
The mean position of upper level ridges of high pressure and troughs of low pressure (depicted by positive and negative 500-millibar height anomalies on the December map) are generally reflected by areas of positive and negative temperature anomalies at the surface, respectively. For other Global products see the Climate Monitoring Global Products page. |
| Images of sea surface temperature conditions are available for all weeks during 2006 at the weekly SST page. |
|
| Effective with the
January, 2006 report, NCDC transitioned from the use of the
Operational Global Surface Temperature Index (Quayle et al. 1999) to the blended
land and ocean dataset developed by Smith and Reynolds (2005).
The differences between the two methods are discussed in Smith et al. 2005. December 2006 was the warmest December since global surface records began in 1880 for combined global land and ocean surface temperatures. December land surface temperatures were 4th warmest, while ocean surface temperatures were 2nd warmest in the 127-year record, behind 1997 during which the very strong 1997/1998 El Niño event was developing. The January - December 2006 land and ocean combined temperature is tied for 5th warmest on record. |
| Current Month / Year-to-date |
| December | Anomaly | Rank | Warmest Year on Record |
|---|---|---|---|
GlobalLandOcean Land and Ocean |
+1.29°C (+2.32°F) +0.51°C (+0.92°F) +0.72°C (+1.30°F) |
4th warmest 2nd warmest 1st warmest |
1939 (+1.34°C/2.41°F) 1997 (+0.56°C/1.01°F) 2003 (+0.70°C/1.26°F) |
Northern HemisphereLandOcean Land and Ocean |
+1.51°C (+2.72°F) +0.55°C (+0.99°F) +0.91°C (+1.64°F) |
4th warmest 1st warmest 2nd warmest |
1939 (+1.82°C/3.28°F) 2004 (+0.52°C/0.94°F) 2003 (+0.92°C/1.66°F) |
Southern HemisphereLandOcean Land and Ocean |
+0.65°C (+1.17°F) +0.49°C (+0.88°F) +0.51°C (+0.92°F) |
7th warmest 3rd warmest 3rd warmest |
1997 (+0.80°C/1.44°F) 1997 (+0.60°C/1.08°F) 1997 (+0.63°C/1.13°F) |
 larger image |
 larger image |
| January-December | Anomaly | Rank | Warmest Year on Record |
|---|---|---|---|
GlobalLandOcean Land and Ocean |
+0.78°C (+1.40°F) +0.45°C (+0.81°F) +0.54°C (+0.97°F) |
4th warmest 5th warmest 5th warmest |
2005 (+0.97°C/1.75°F) 2003 (+0.48°C/0.86°F) 2005 (+0.61°C/1.10°F) |
Northern HemisphereLandOcean Land and Ocean |
+0.87°C (+1.57°F) +0.49°C (+0.88°F) +0.63°C (+1.13°F) |
3rd warmest 4th warmest 2nd warmest |
2005 (+1.02°C/1.84°F) 2005 (+0.54°C/0.97°F) 2005 (+0.72°C/1.30°F) |
Southern HemisphereLandOcean Land and Ocean |
+0.54°C (+0.97°F) +0.43°C (+0.77°F) +0.44°C (+0.79°F) |
6th warmest 5th warmest 6th warmest |
2005 (+0.83°C/1.49°F) 1998 (+0.50°C/0.90°F) 1998 (+0.54°C/0.97°F) |
 larger image |
 larger image |
The most current data may be accessed via the Global Surface Temperature Anomalies page.
The maps below represent anomaly values based on the GHCN data set
of land surface stations using a base period of 1961-1990.
During December 2006, above average precipitation fell over areas
that include Scandinavia, Japan, central U.S., southeastern Africa,
and most of South America.
Below average precipitation was observed in eastern Australia,
southcentral Europe, eastern U.S., eastern Brazil, and southern
India. Additional details on flooding and drought can also be found
on the December Global Hazards
page. |
 larger image |
 larger image |
|
|

|