Global Highlights:
|
Contents of this Section: |
| The data presented in this report are preliminary. Ranks and anomalies may change as more complete data are received and processed. The most current data may be accessed via the Global Surface Temperature Anomalies page. |
Temperature anomalies for December 2005 - February 2006 and
February are shown on the four maps below. The dot map on the left
provides a spatial representation of anomalies calculated from the
Global Historical Climatology Network (GHCN) data set of land
surface stations using a 1961-1990 base period. The map on the
right is a product of a merged land surface and sea surface
temperature anomaly analysis which is based on data from the GHCN
of land temperatures and the Comprehensive Ocean-Atmosphere Data
Set (COADS) of Sea-Surface Temperature (SST) data. Temperature
anomalies with respect to 1961-1990 for land and ocean are analyzed
separately and then merged to form the global analysis. Additional
information on this product is available. |

 larger image |
 larger image |
| During February 2006,
there were above average temperatures in Alaska, Canada, Mexico,
Brazil, Niger and most of Asia. Cooler than average temperatures
were observed in Eastern Europe, the Iberian Peninsula and the U.S.
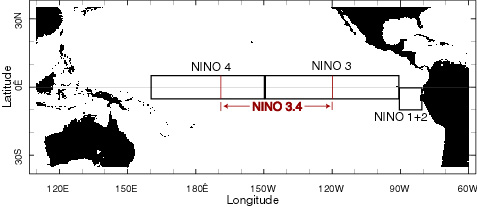
northern Rockies. Warmer than average SSTs occurred in the South Pacific and the North Atlantic. Cooler than average conditions were observed in the Niño 3.4 region, indicative of the La Niña episode that developed by mid-January, please see the latest ENSO discussion for further information. |
 larger image |
 larger image |
The mean position of upper level ridges of high pressure and troughs of low pressure (depicted by positive and negative 500 millibar height anomalies on the December 2005 - February 2006 map and the February 2006 map) are generally reflected by areas of positive and negative temperature anomalies at the surface, respectively. For other Global products see the Climate Monitoring Global Products page. |
| Images of sea surface temperature conditions are available for all weeks during 2006 at the weekly SST page. |
|
| Effective with the January 2006 report, NCDC transitioned from the use of the Operational Global Surface Temperature Index (Quayle et al. 1999) to the blended land and ocean dataset developed by Smith and Reynolds (2005). The differences between the two methods are discussed in Smith et al. 2005. |
| Current Month / Seasonal / Year-to-date |
| February | Anomaly | Rank | Warmest Year on Record |
|---|---|---|---|
GlobalLandOcean Land and Ocean |
+0.96°C (+1.73°F) +0.37°C (+0.67°F) +0.53°C (+0.95°F) |
8th warmest 6th warmest 6th warmest |
2002 (+1.62°C/2.92°F) 1998 (+0.55°C/0.99°F) 1998 (+0.82°C/1.48°F) |
Northern HemisphereLandOcean Land and Ocean |
+1.08°C (+1.94°F) +0.31°C (+0.56°F) +0.60°C (+1.08°F) |
10th warmest 6th warmest 7th warmest |
2002 (+2.12°C/3.82°F) 1998 (+0.53°C/0.95°F) 2002 (+1.03°C/1.85°F) |
Southern HemisphereLandOcean Land and Ocean |
+0.57°C (+1.03°F) +0.44°C (+0.79°F) +0.46°C (+0.83°F) |
8th warmest 8th warmest 5th warmest |
1986 (+1.23°C/2.21°F) 1998 (+0.57°C/1.03°F) 1998 (+0.62°C/1.12°F) |
 larger image |
 larger image |
| December-February | Anomaly | Rank | Warmest Year on Record |
|---|---|---|---|
GlobalLandOcean Land and Ocean |
+0.72°C (+1.30°F) +0.39°C (+0.70°F) +0.48°C (+0.86°F) |
8th warmest 6th warmest 8th warmest |
2002 (+1.20°C/2.16°F) 1998 (+0.55°C/0.99°F) 2004 (+0.65°C/1.17°F) |
Northern HemisphereLandOcean Land and Ocean |
+0.74°C (+1.33°F) +0.35°C (+0.63°F) +0.50°C (+0.90°F) |
11th warmest 6th warmest 9th warmest |
2002 (+1.55°C/2.79°F) 1998 (+0.52°C/0.94°F) 2004 (+0.81°C/1.46°F) |
Southern HemisphereLandOcean Land and Ocean |
+0.63°C (+1.13°F) +0.44°C (+0.79°F) +0.46°C (+0.83°F) |
6th warmest 6th warmest 5th warmest |
1998 (+0.81°C/1.46°F) 1998 (+0.57°C/1.03°F) 1998 (+0.61°C/1.10°F) |
 larger image |
 larger image |
| January-February | Anomaly | Rank | Warmest Year on Record |
|---|---|---|---|
GlobalLandOcean Land and Ocean |
+0.62°C (+1.12°F) +0.38°C (+0.68°F) +0.44°C (+0.79°F) |
15th warmest 6th warmest 8th warmest |
2002 (+1.53°C/2.75°F) 1998 (+0.54°C/0.97°F) 2002 (+0.71°C/1.28°F) |
Northern HemisphereLandOcean Land and Ocean |
+0.60°C (+1.08°F) +0.31°C (+0.56°F) +0.42°C (+0.76°F) |
22nd warmest 7th warmest 12th warmest |
2002 (+1.99°C/3.58°F) 1998 (+0.52°C/0.94°F) 2002 (+0.98°C/1.76°F) |
Southern HemisphereLandOcean Land and Ocean |
+0.68°C (+1.22°F) +0.44°C (+0.79°F) +0.47°C (+0.85°F) |
5th warmest 8th warmest 5th warmest |
2003 (+0.81°C/1.46°F) 1998 (+0.56°C/1.01°F) 1998 (+0.60°C/1.08°F) |
 larger image |
 larger image |
The most current data may be accessed via the Global Surface Temperature Anomalies page.
The maps below represent anomaly values based on the GHCN data set
of land surface stations using a base period of 1961-1990. During
boreal winter, above average precipitation fell over areas that
include the Amazon Basin, Iceland, southern Chile, eastern
Australia and the U.S. Pacific Northwest and Northeast regions.
Below average precipitation was observed in southern Brazil, the
majority of Europe, the western coast of Canada, along the U.S.
Gulf Coast and parts of eastern Australia. |
 larger image |
 larger image |
|
|

|