Global Highlights:
- Global average land and sea surface temperature was the second
warmest on record for August and for the boreal summer
(June-August)
- Lower tropospheric temperatures were warmer than average for
August, but near average for June-August
- Temperatures in the lower stratosphere were cooler than
average
- During June-August, above average precipitation was most
notable across southeast China, Argentina and the U.S. Gulf Coast,
with below average precipitation across the Mediterranean, northern
India and northern South America
|
|
Contents of this Section:
|
Introduction
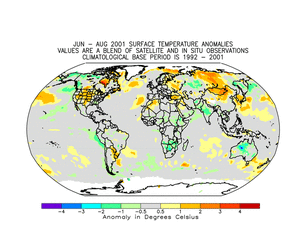
| Using a 1992-2001 base
period as shown in the adjacent blended temperature
product of satellite and in-situ data, anomalous warmth during
the period June-August in the Northern Hemisphere was linked to the
location of upper level ridges of high pressure. These ridges of
high pressure (depicted
by positive 500 millibar height anomalies) were situated across
much of Canada and the western U.S., as well as eastern Europe and
Siberian regions of the Former Soviet Union (FSU). Temperature
anomalies calculated from in-situ station
data using a 1961-1990 base period also show the warmer than
average temperatures in these regions with cooler than average
temperatures restricted to British Columbia, portions of India and
the Kamchatka Peninsula. Similar temperature distributions were
present during August. |

larger
image
|
Temperature
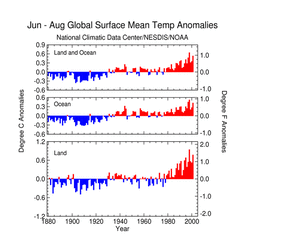
- Although neutral
ENSO conditions were present in August, the global
land and ocean temperature was second warmest in the 1880 to
present record and was 0.58°C (1.04°F) above the
long-term average (0.49°C /
0.88°F above the 1961-1990 mean)
- Temperatures averaged across land areas
also ranked second warmest, or 0.90°C (1.62°F) above the
long-term August mean
|

larger
image
|

larger
image
|
- For summer (June-August), the global average land and ocean
temperature was 0.53°C (0.95°F) above the 1880-2000 mean,
or second warmest (0.44°C
/ 0.79°F above the 1961-1990 mean)
- Northern and Southern Hemisphere temperatures were both second
warmest during June-August, or 0.67°C (1.21°F) and
0.39°C (0.70°F) above average, respectively
|
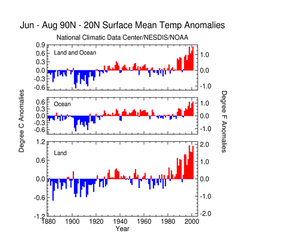
- Based on data available at the time of this report, the average
temperature approached record levels for the period June-August
across the Northern Hemisphere extratropics, with the combined land
and ocean temperature falling less than 0.01°C (0.02°F)
short of the record anomaly of 0.83°C (1.49°F) set during
the El Niño summer of 1998
|

larger
image
|
Precipitation
- Much above average precipitation over the U.S. Gulf Coast and
Southeast Asia was largely due to tropical systems
- Precipitation departures during June-August were 100-200 mm
(3.94-7.87 inches) across central Argentina
- Monsoon rains were lighter than average across much of northern
and western India
- A persistent upper level trough of low pressure brought
unusually wet weather to South Africa in August
|
 larger
image
|
References:
Peterson, T.C. and R.S. Vose, 1997: An Overview of the Global
Historical Climatology Network Database. Bull. Amer. Meteorol.
Soc., 78, 2837-2849.


 NOAA's National Centers for Environmental Information