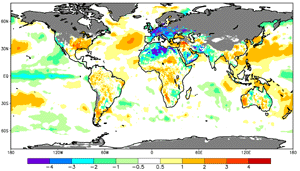
 Satellite Derived Global Temperature Anomalies November 1998 National Climatic Data Center Asheville, NC |

Overview of the U.S.
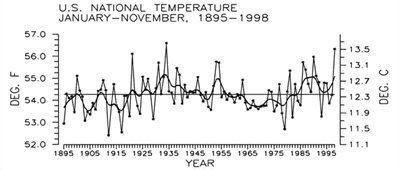
- The month of November 1998, was the 7th warmest for the U.S. as a whole. Precipitation, averaged over the U.S., was near normal; The eastern third of the U.S. was dry and the west was wet. Like January through October, the period January through November 1998 was the 2nd warmest and 3rd wettest such period on record. The warmest year was 1934 with a mean value for Jan-Nov of 56.6 degrees F. The mean value for Jan-Nov, 1998, was 56.3 degrees F. The normal value for the period Jan-Nov is 54.2 degrees F.
- Looking at October and November combined, the national average for temperature was also the 7th warmest on record with the warmest areas being the south, southeast, and north central regions. As a whole, the U.S. averaged the 18th wettest on record with the west north central having the wettest October-November on record. The driest region was the southeast with it being the 9th driest Oct-Nov on record.
- For the period June through November,1998, the U.S. experienced the 3rd warmest such period on record, with the south and northwest regions having the second warmest June-Nov on record.
- The past 12 months, December 1997 through November 1998, have been the second warmest and third wettest on record for the U.S. For this 12-month period, the northeast and east north central regions have set new records for warmest Dec-Nov on record. The coldest region was the west region.
                 PRECIPITATION AND TEMPERATURE RANKS, BASED
                 ON THE PERIOD 1895-1998.  1 = DRIEST/COLDEST,
                 104 = WETTEST/WARMEST FOR NOVEMBER 1998,
                 104 = WETTEST/WARMEST FOR OCT-NOV 1998,
                 104 = WETTEST/WARMEST FOR JUN-NOV 1998,
                 103 = WETTEST/WARMEST FOR DEC 1997-NOV 1998.

                                NOV    OCT-NOV    JUN-NOV   DEC 1997-
            REGION              1998     1998       1998    NOV 1998
            ------              ----  ---------  ---------  ---------

                      PRECIPITATION:

           NORTHEAST              9       19         36         82
           EAST NORTH CENTRAL    54       84         63         79
           CENTRAL               25       50         78         91

           SOUTHEAST             30        9         10         88
           WEST NORTH CENTRAL    92      104        101         90
           SOUTH                 65       95         71         73

           SOUTHWEST             49       84         74         82
           NORTHWEST             90       77         64         83
           WEST                  83       78         89        102

           NATIONAL              60       87         78        101

                      TEMPERATURE:

           NORTHEAST             72       71         77        103
           EAST NORTH CENTRAL    95       98        101        103
           CENTRAL               91       89         96        102

           SOUTHEAST             90       94        102         96
           WEST NORTH CENTRAL    85       92         97         99
           SOUTH                 94       98        103        101

           SOUTHWEST             83       74         89         81
           NORTHWEST             89       65        103         98
           WEST                  57       40         65         46

           NATIONAL              98       98        102        102
7th Warmest November for U.S. since 1895

larger image
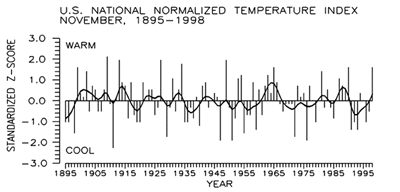
Preliminary data for November 1998 indicate that temperature averaged across the contiguous United States was much above the long-term mean ranking as the 7th warmest November since 1895.
The preliminary national standardized temperature index ranked November 1998 as the sixth warmest November on record.
larger image
 larger image |
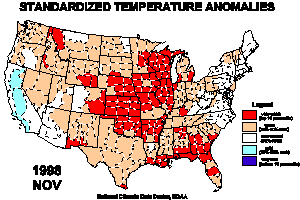
The geographical pattern of November warmth can be seen in this temperature anomaly map. The bright red areas indicate very warm temperature anomalies (i.e., anomalies in the top ten percentile for the area, or warmer than 1.28 standard deviations above the mean). |
November 1998 was the 45th wettest November since 1895
| About 8% of the country had monthly precipitation in the extremely wet (top 10 percentile) category, while another 8% was extremely dry (bottom 10 percentile). |
 larger image |

larger image
November 1998 was the 45th wettest November since 1895.
The preliminary national standardized precipitation index ranked November 1998 as the 46th wettest November on record. This standardized z-score is estimated to be accurate to within 0.159 index units.

larger image
| November 1998 was characterized by dichotomous precipitation extremes in the contiguous United States. This continues a pattern of balanced precipitation extremes that has characterized much of 1998. |
 larger image |
 larger image |
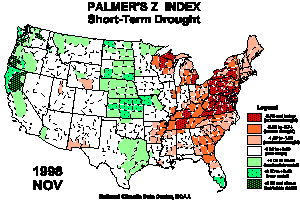
The geographical pattern of short term monthly moisture deficit (red) and moisture surplus (green) is shown by the Palmer Z Index. November 1998 was unusually wet over large parts of the Far West and Great Plains, and unusually dry over large areas from the Deep South nortward to New England and the Great Lakes. |
| The geographic patterns of long-term (cumulative) monthly drought (red) and wetness (green) are represented by the Palmer Drought Index. The PDI is best used as a drought/wet spell indicator for reservoir and groundwater applications. |
 larger image |
                   EXTREMES, 1961-90 NORMALS, AND 1998 VALUES
                   FOR NOVEMBER.  IT SHOULD BE NOTED THAT THE
                   1998 VALUES WILL CHANGE WHEN THE FINAL DATA
                   ARE PROCESSED.

                                     PRECIPITATION (INCHES)
                                   DRIEST     WETTEST   NORMAL  1998
               REGION            VALUE YEAR VALUE YEAR   PCPN   PCPN
               ------            ---------- ----------  ------ ------

              NORTHEAST            .88 1917  6.34 1983   3.84   1.71
              EAST NORTH CENTRAL   .20 1904  4.03 1931   1.89   1.75
              CENTRAL              .71 1904  7.71 1985   3.53   2.22

              SOUTHEAST            .83 1931  8.39 1948   3.30   2.06
              WEST NORTH CENTRAL   .06 1939  1.63 1896    .74   1.14
              SOUTH                .20 1949  5.21 1940   2.63   2.75

              SOUTHWEST            .06 1904  2.37 1905    .90    .68
              NORTHWEST            .30 1936  7.61 1909   3.78   5.47
              WEST                 .01 1929  5.56 1926   2.22   2.91

              NATIONAL             .88 1917  3.76 1983   2.32   2.18*

                                  * PRELIMINARY VALUE, CONFIDENCE
                                    INTERVAL + OR -  .20 INCHES

                                     TEMPERATURE (DEGREES F)
                                   COLDEST    WARMEST   NORMAL  1998
               REGION            VALUE YEAR VALUE YEAR   TEMP   TEMP
               ------            ---------- ----------  ------ ------

              NORTHEAST           32.3 1901  44.7 1931   38.7   39.5
              EAST NORTH CENTRAL  24.9 1959  39.8 1899   33.1   37.4
              CENTRAL             35.9 1976  51.4 1931   44.2   46.9

              SOUTHEAST           48.2 1976  62.4 1985   55.0   57.7
              WEST NORTH CENTRAL  17.3 1985  40.3 1949   30.9   34.8
              SOUTH               45.5 1976  58.7 1909   52.5   55.8

              SOUTHWEST           36.1 1972  46.9 1949   41.4   43.4
              NORTHWEST           27.2 1985  42.8 1899   37.0   39.7
              WEST                40.0 1994  51.8 1949   46.0   46.6

              NATIONAL            38.2 1911  46.1 1909   42.7   45.4*

                                  * PRELIMINARY VALUE, CONFIDENCE
                                    INTERVAL + OR -  .6 DEG. F.
2nd Warmest January-November for U.S. since 1895
| About 74% of the country was much warmer than normal while nearly zero percent of the country was much cooler than normal. |
 larger image |
larger image
Preliminary data indicate that the period January-November 1998 was the second warmest such period since 1895 for the contiguous United States. The 1998 year-to-date national averaged temperature was 56.3°F. The warmest January-November, at 56.6 degrees F, occurred in 1934, the warmest year on record. The 1961-1990 normal temperature for January-November is 54.2 degrees F. Ten of the last thirteen years have seen January through November as above to much-above the long-term mean.
The preliminary national standardized temperature index ranked January-November 1998 as the second warmest January-November since records began in 1895.

larger image
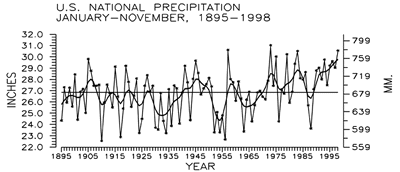
3rd Wettest January-November for U.S. since 1895
 larger image |
With a national averaged precipitation value of inches, preliminary data suggest that January-November 1998 was the wettest such 11-month period on record for the contiguous United States. The 1961-1990 normal for the same period is inches. The second wettest such eleven-month period was January-November 1973 with inches of precipitation. About 27% of the country was much wetter than normal while about one percent of the country was much drier than normal. |
larger image
Preliminary precipitation data indicate that the period January-November 1998 was the third wettest such period since 1895 for the contiguous United States. The last ten years have found January through November precipitation at above to much-above the long-term mean.
The preliminary national year-to-date standardized precipitation index ranked January-November 1998 as the second wettest January-November since 1895.

larger image
                 TEMPERATURE AND PRECIPITATION RANKINGS FOR
                 JANUARY-NOVEMBER 1998, BASED ON THE PERIOD 1895-1998.
                 1 = DRIEST/COLDEST, 104 = WETTEST/HOTTEST.

               REGION                PRECIPITATION  TEMPERATURE
               ------                -------------  -----------

              NORTHEAST                   88            104
              EAST NORTH CENTRAL          86            104
              CENTRAL                     94            103

              SOUTHEAST                   79            100
              WEST NORTH CENTRAL          93             99
              SOUTH                       64            102

              SOUTHWEST                   79             89
              NORTHWEST                   94            101
              WEST                       103             48

              NATIONAL                   102            103
        EXTREMES, 1961-90 NORMALS, AND 1998 VALUES FOR JANUARY-NOVEMBER

                                     PRECIPITATION (INCHES)
                                   DRIEST     WETTEST   NORMAL  1998
               REGION            VALUE YEAR VALUE YEAR   PCPN   PCPN
               ------            ---------- ----------  ------ ------

              NORTHEAST          29.53 1941 48.24 1996  38.18  40.80
              EAST NORTH CENTRAL 19.03 1910 35.01 1951  29.06  31.41
              CENTRAL            28.89 1901 48.60 1950  39.61  45.09

              SOUTHEAST          34.32 1954 59.24 1929  47.16  50.42
              WEST NORTH CENTRAL 10.91 1934 22.15 1915  16.27  19.13
              SOUTH              22.14 1956 44.31 1957  33.23  34.25

              SOUTHWEST           7.31 1956 20.88 1941  12.68  13.75
              NORTHWEST          13.75 1929 30.87 1983  23.47  27.74
              WEST                7.94 1929 26.48 1983  14.18  25.70

              NATIONAL           22.54 1910 31.05 1973  27.16  30.57


                                     TEMPERATURE (DEGREES F)
                                   COLDEST    WARMEST   NORMAL  1998
               REGION            VALUE YEAR VALUE YEAR   TEMP   TEMP
               ------            ---------- ----------  ------ ------

              NORTHEAST           45.3 1904  50.8 1998   47.8   50.8
              EAST NORTH CENTRAL  42.2 1917  49.8 1998   45.8   49.8
              CENTRAL             52.9 1979  58.8 1921   55.1   58.1

              SOUTHEAST           62.2 1940  66.3 1921   63.8   65.8
              WEST NORTH CENTRAL  42.1 1950  49.1 1934   45.5   47.7
              SOUTH               61.9 1979  66.4 1921   63.7   66.3

              SOUTHWEST           51.2 1917  56.4 1934   53.6   54.5
              NORTHWEST           45.4 1955  52.0 1934   48.3   50.3
              WEST                54.6 1912  59.4 1934   56.5   56.2

              NATIONAL            52.4 1912  56.6 1934   54.2   56.3
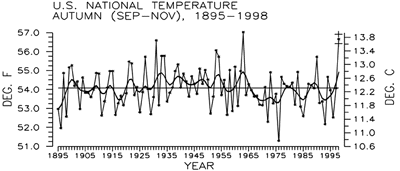
2nd Warmest Autumn for U.S. since 1895
larger image
Preliminary data for Autumn (September-November) 1998 indicate that temperature averaged across the contiguous United States was much above the long-term mean ranking as the 2nd warmest Autumn season since 1895. Less than one percent of the country was much cooler than normal while a full two-thirds of the country was much warmer than normal
The preliminary national Autumn standardized temperature index ranked September-November 1998 as the third warmest Autumn on record.

larger image
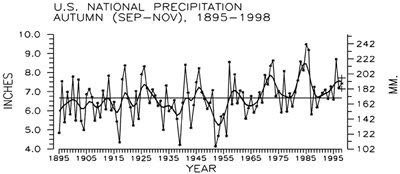
24th Wettest Autumn for U.S. since 1895
larger image
Preliminary data for November 1998 suggests that Autumn 1998 was the 24th wettest Autumn since 1895. Sixteen percent of the country was much wetter than normal while nearly 6% of the country was much drier than normal
The preliminary national Autumn standardized precipitation index ranked September-November 1998 as the 27th wettest Autumn on record.

larger image
                  TEMPERATURE AND PRECIPITATION RANKINGS FOR
                  SEP-NOV 1998, BASED ON THE PERIOD 1895-1998.
                  1 = DRIEST/COLDEST, 104 = WETTEST/HOTTEST.

               REGION                PRECIPITATION  TEMPERATURE
               ------                -------------  -----------

              NORTHEAST                    8             82
              EAST NORTH CENTRAL          56            102
              CENTRAL                     36            102

              SOUTHEAST                   41             95
              WEST NORTH CENTRAL          94            102
              SOUTH                       92            103

              SOUTHWEST                   73             90
              NORTHWEST                   66             96
              WEST                        85             60

              NATIONAL                    81            103
                    EXTREMES, 1961-90 NORMALS, AND 1998 VALUES
                             FOR SEPTEMBER-NOVEMBER

                                     PRECIPITATION (INCHES)
                                   DRIEST     WETTEST   NORMAL  1998
               REGION            VALUE YEAR VALUE YEAR   PCPN   PCPN
               ------            ---------- ----------  ------ ------

              NORTHEAST           5.01 1908 15.54 1977  10.82   7.44
              EAST NORTH CENTRAL  2.92 1976 11.82 1941   7.96   7.38
              CENTRAL             3.99 1953 14.92 1926  10.20   8.39

              SOUTHEAST           4.27 1931 17.71 1929  10.79   9.62
              WEST NORTH CENTRAL  1.21 1952  6.41 1946   3.44   4.63
              SOUTH               3.79 1917 13.88 1986   9.19  11.95

              SOUTHWEST            .95 1956  6.51 1972   3.48   3.62
              NORTHWEST           1.51 1936 11.35 1973   7.16   8.13
              WEST                 .38 1929  7.46 1982   3.85   4.74

              NATIONAL            4.14 1952  9.48 1985   7.11   7.44*

                                  * PRELIMINARY VALUE, CONFIDENCE
                                    INTERVAL + OR -  .29 INCHES

                                     TEMPERATURE (DEGREES F)
                                   COLDEST    WARMEST   NORMAL  1998
               REGION            VALUE YEAR VALUE YEAR   TEMP   TEMP
               ------            ---------- ----------  ------ ------

              NORTHEAST           45.2 1917  53.8 1931   49.1   50.6
              EAST NORTH CENTRAL  41.6 1896  52.5 1931   46.6   50.7
              CENTRAL             49.9 1976  61.2 1931   55.4   58.5

              SOUTHEAST           59.5 1976  67.9 1919   63.9   66.3
              WEST NORTH CENTRAL  38.0 1985  50.3 1963   44.5   48.4
              SOUTH               58.2 1976  68.2 1931   63.2   67.0

              SOUTHWEST           49.9 1912  56.1 1963   52.9   54.5
              NORTHWEST           41.9 1985  50.3 1963   47.3   49.4
              WEST                53.2 1916  59.2 1995   56.3   56.5

              NATIONAL            51.3 1976  57.0 1963   54.0   56.7*

                                  * PRELIMINARY VALUE, CONFIDENCE
                                    INTERVAL + OR -  .3 DEG. F.

Overview of the Globe
- When the land and ocean temperature anomalies are combined, November 1998 was the second warmest November on record. The global anomaly was 1.00 deg.F (0.56 deg.C) above the 1880-1997 mean.
- Regionally, the U.S. continued to experience near record warmth, while Europe and north Africa were well below normal. The global land temperature for November 1998 was the fourth warmest on record.
- Ocean temperatures were 0.82 deg.F (0.46 deg.C) above the 1880-1997 mean. None-the-less they were cooler than the anomaly during November 1997, when mature El Niño conditions dominated the tropical Pacific.
Year-to-Date 1998 remains warmest on record
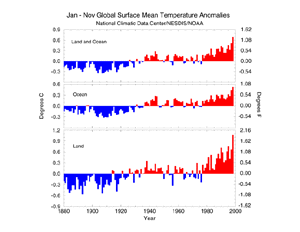 larger image Global Mean Temperature Anomalies January-November 1998 |
 larger image The period January through November 1998 was the warmest Jan-Nov on record with a global mean temperature of 14.69 deg C / 58.42 deg F. This is 0.68 deg C / 1.23 deg F above the 1880-1997 mean of 14.0 deg C / 57.19 deg F and exceeding the previous record set in 1997 by 0.18 deg C / 0.32 deg F. |
Global Mean for November falls below Record Set in 1997
 larger image Preliminary data suggest that November 1998 was the second warmest November on record. The warmest November was in 1997. At 14.08 deg C / 56.27 deg F, November 1998 was 0.59 deg C / 1.07 deg F above the 1880-1997 mean global temperature of 12.9 deg C / 55.2 deg F. November 1997 set the record at .68 deg C / 1.22 deg F above the mean. |
 larger image Global Temperature Anomalies November 1998 |
Current data are based on preliminary reports from River Forecast Center stations and First and Second Order airport stations obtained from the National Weather Service (NWS) Climate Prediction Center and real time Global Telecommunications System (GTS) monthly CLIMAT summaries. THE CURRENT DATA SHOULD BE USED WITH CAUTION. These preliminary data are useful for estimating how current anomalies compare to the historical record, however the actual values and rankings for the current year may change as the final data arrive at NCDC and are processed.
The following NCDC datasets are used for the historical U.S. data: the climate division drought database (TD-9640), and the hurricane datasets (TD-9636 and TD-9697). It should be noted that the climate division drought database consists of monthly data for 344 climate divisions in the contiguous United States. These divisional values are calculated from the 6000+ station Cooperative Observer network.
As GTS CLIMAT data are being received, scientists at The National Oceanic and Atmospheric Administration's National Climatic Data Center are automatically updating The Global Historical Climatology Network data base to maintain a global climate perspective in near real-time.
For more information, refer to ...
Global Historical
Climatology Network (GHCN)
The
Global Temperature Anomalies
SSMI
Derived Products NOAA's National Climatic Data Center is the
world's largest active archive of weather data. The preliminary
temperature and precipitation rankings are available from the
center by calling: 828-271-4800 or on the World Wide Web at:
http:/www.ncdc.noaa.gov/ol/documentlibrary/cvb.html
Historical precipitation and temperature ranking maps are also available on the Internet at: https://nic.fb4.noaa.gov//products/analysis_monitoring/regional_monitoring/usa.html.
NOAA works closely with the academic and science communities on climate-related research projects to increase the understanding of El Niño and improve forecasting techniques. NOAA's Climate Prediction Center monitors, analyzes and predicts climate events ranging from weeks to seasons for the nation. NOAA also operates the network of data buoys and satellites that provide vital information about the ocean waters, and initiates research projects to improve future climate forecasts. The long lead climate outlooks are available on the Internet at: https://nic.fb4.noaa.gov/.
 NOAA's National Centers for Environmental Information
