 Satellite Derived Global Temperature Anomalies October 1998 National Climatic Data Center |

Overview of the U.S.: Wettest and 2nd Warmest on Record
(contains material also published in the Climate Variations Bulletin)| Preliminary data indicate that the period January-October 1998 was the second warmest such period since 1895 for the contiguous United States. The 1998 year-to-date national averaged temperature was 57.4°F. The warmest January-October, at 57.7 degrees F, occurred in 1934, the warmest year on record. The 1961-1990 normal temperature for January-October is 55.3°F. Over 66% of the country was much warmer than normal while none of the country was much cooler than normal. | |
 larger image |

larger image
 |
With a national averaged precipitation value of 28.39 inches, preliminary data suggest that January-October 1998 was the wettest such 10-month period on record for the contiguous United States. The 1961-1990 normal for the same period is 24.84 inches. The second wettest such ten-month period was January-October 1973 with 28.13 inches of precipitation. Over 28% of the country was much wetter than normal while less than two percent of the country was much drier than normal. |

larger image
                TEMPERATURE AND PRECIPITATION RANKINGS FOR
                JAN-OCT 1998, BASED ON THE PERIOD 1895-1998.
                1 = DRIEST/COLDEST, 104 = WETTEST/HOTTEST.

               REGION                PRECIPITATION  TEMPERATURE
               ------                -------------  -----------

              NORTHEAST                   95            104
              EAST NORTH CENTRAL          87            103
              CENTRAL                    100            102

              SOUTHEAST                   87             92
              WEST NORTH CENTRAL          90             98
              SOUTH                       65            101

              SOUTHWEST                   79             84
              NORTHWEST                   88             99
              WEST                       104             46

              NATIONAL                   104            103
        EXTREMES, 1961-90 NORMALS, AND 1998 VALUES FOR JANUARY-OCTOBER

                                     PRECIPITATION (INCHES)
                                   DRIEST     WETTEST   NORMAL  1998
               REGION            VALUE YEAR VALUE YEAR   PCPN   PCPN
               ------            ---------- ----------  ------ ------

              NORTHEAST          26.40 1957 44.79 1996  34.34  39.09
              EAST NORTH CENTRAL 18.10 1910 33.27 1951  27.17  29.66
              CENTRAL            26.58 1930 44.82 1898  36.08  42.87

              SOUTHEAST          31.56 1954 54.83 1929  43.86  48.36
              WEST NORTH CENTRAL 10.32 1934 21.38 1915  15.53  17.99
              SOUTH              20.41 1956 41.23 1973  30.60  31.50

              SOUTHWEST           7.05 1956 20.24 1941  11.78  13.07
              NORTHWEST          13.30 1929 25.43 1950  19.69  22.27
              WEST                5.98 1966 22.79 1998  11.96  22.79

              NATIONAL           20.39 1934 28.39 1998  24.84  28.39

                                     TEMPERATURE (DEGREES F)
                                   COLDEST    WARMEST   NORMAL  1998
               REGION            VALUE YEAR VALUE YEAR   TEMP   TEMP
               ------            ---------- ----------  ------ ------

              NORTHEAST           46.5 1907  51.9 1998   48.7   51.9
              EAST NORTH CENTRAL  42.8 1917  51.1 1921   47.0   51.0
              CENTRAL             53.9 1979  60.1 1921   56.1   59.2

              SOUTHEAST           63.0 1940  67.2 1925   64.6   66.7
              WEST NORTH CENTRAL  43.0 1917  50.3 1934   46.9   48.9
              SOUTH               63.2 1979  67.7 1911   64.8   67.4

              SOUTHWEST           51.9 1917  57.8 1934   54.8   55.6
              NORTHWEST           46.7 1955  53.0 1934   49.4   51.3
              WEST                55.4 1912  60.5 1934   57.6   57.2

              NATIONAL            53.4 1912  57.7 1934   55.3   57.4
 U.S. Statewide Temperature Ranks, October 1998 |
In the United States,
October 1998 was the 32nd warmest and the 9th wettest such month
since 1895. Regionally, October 1998 was the 19th warmest such
month on record for the South region.
October 1998 was the 30th coolest such month on record for both the West and Northwest regions. It was the third consecutive such month of below normal temperatures for the West region and the fifth consecutive such month of below normal temperatures for the Northwest region |

larger image
| Based upon preliminary data, October 1998 was the 11th driest such month since 1895 for the Southeast region. Precipitation for the previous six Octobers (1992-1997) has been above- to much-above the long-term mean. |  U.S. Statewide Precipitation Ranks, October 1998 |

larger image
 |
This graph shows the monthly national temperature characteristics for July 1997 through October 1998. The values for the most recent 2 months (September and October 1998) are based on preliminary data. (Note: The values for October 1998 are 0% cold and .5% warm and are therefore of negligible size on the graph. Similarly, the values for October 1997 are 0% warm and .3% cold.) Warm temperatures dominated the contiguous U.S. during most months in 1998. The geographic patterns of monthly warm (red) and cold (blue) anomalies can be seen in this Monthly Standardized Temperature Anomalies Animation. |

larger image
| This graph shows the
monthly national precipitation characteristics for July 1997
through October 1998. The values for the most recent 2 months
(September and October 1998) are based on preliminary data.
Large areas of unusually wet conditions dominated the contiguous U.S. at the beginning (January-March) of 1998 and in October 1998. Large areas of unusually wet conditions were counterbalanced by large areas of unusually dry conditions during April-September 1998. |
 larger image |
 Jan-Oct 1998 Animation |
The geographical patterns of monthly precipitation anomalies are represented by the Palmer Z Index Animation, which is a short-term (monthly) index of drought (red areas) and wetness (green areas). |
| The geographic patterns of long-term (cumulative) monthly drought (red) and wetness (green) are represented by the Palmer Drought Index Animation. The PDI is best used as a drought/wet spell indicator for reservoir and groundwater applications. |  Jan-Oct 1998 Animation |
 Jan-Oct 1998 Animation |
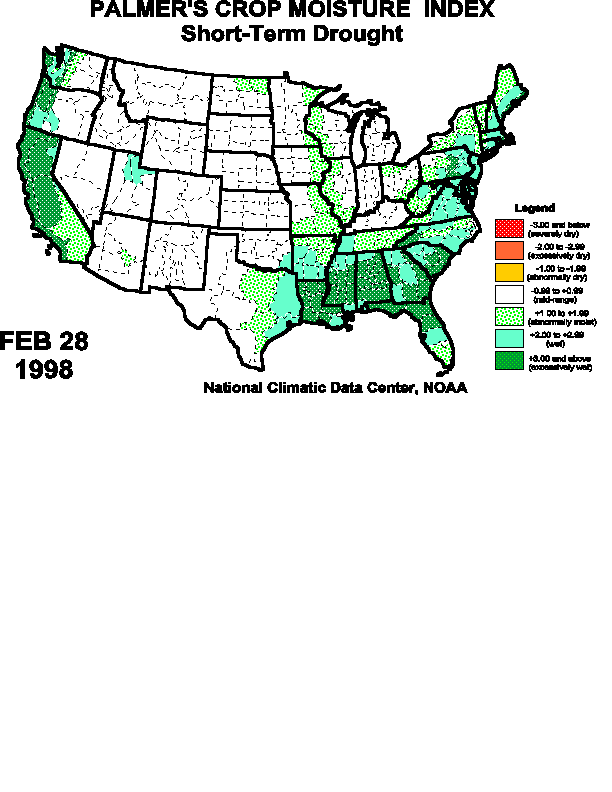
Drought and wet spells have different impacts depending on which economic sector is being examined. The impact on agriculture is illustrated by the weekly Palmer Crop Moisture Index. |
Warm in South and Dry in Southeast U.S.

larger image
South U.S. Region Temperature, October 1998
October 1998 was the 19th warmest such month on record for the South region. The South region includes Arkansas, Kansas, Louisiana, Mississippi, Oklahoma, and Texas.

larger image
Southeast U.S. Region Precipitation, October 1998
Based upon preliminary data, October 1998 was the 11th driest such month since 1895 for the Southeast region. Precipitation for the last six such months has been above- to much-above the long-term mean. The Southeast region includes Alabama, Florida, Georgia, North Carolina, South Carolina, and Virginia.
Wet in the Great Plains
| Precipitation averaged across the Great Plains ranked October 1998 as the second wettest October on record. The preliminary value for October 1998 was 3.91 inches. The wettest October occurred in 1941 with 3.96 inches. |  |

larger image
Great Plains U.S. Region Precipitation, October 1998
Cool in West and Northwest
| October 1998 was the 30th coolest such month on record for both the West and Northwest regions. It was the third consecutive such month of below normal temperatures for the West region and the fifth consecutive such month of below normal temperatures for the Northwest region. The West region includes California and Nevada while the Northwest region includes Idaho, Oregon, and Washington. |  Satellite Derived US Temperature Anomalies, October 1998 |

larger image
West U.S. Region Temperature, October 1998

larger image
Northwest U.S. Region Temperature, October 1998
Global Mean Temperature for January-October, Warmest on Record
 Global Mean Temperature Anomalies January-October 1998 |
 The period
January through October was the warmest such period on record at
58.65 degrees. This is 1.25 degrees F above the 1880-1997 mean of
57.4 degrees F and exceeding the previous record set in 1997 by
0.36 degrees F. The period
January through October was the warmest such period on record at
58.65 degrees. This is 1.25 degrees F above the 1880-1997 mean of
57.4 degrees F and exceeding the previous record set in 1997 by
0.36 degrees F. |
October 1998 Breaks Record Set in 1997
 Preliminary
data indicate October 1998 broke the record for warmth for October,
set in 1997. At 58.18 degrees Fahrenheit, October 1998 was 1.08
degrees F above the 1880-1997 mean global temperature of 57.1
degrees F. October 1997 set the record at 58.15 degrees F. Preliminary
data indicate October 1998 broke the record for warmth for October,
set in 1997. At 58.18 degrees Fahrenheit, October 1998 was 1.08
degrees F above the 1880-1997 mean global temperature of 57.1
degrees F. October 1997 set the record at 58.15 degrees F. |
 Global Temperature Anomalies October 1998 |
Land lags Ocean as La Niña strengths
| The ocean has now cooled down to below the 1997 sea surface temperatures, particularly over the equatorial eastern Pacific, where the cool La Nina signature continues to develop. It appears that the coolness over the ocean is largely being generated from subsurface currents, and this cooling effect lags over much of the global land surface. | Satellite Derived Global Temperature Anomalies, October 1998 |

Climate Prediction Center, NOAA
Monthly Sea Surface Temperature; 5N-5S, 170-120W
 Satellite Derived Global Temperature Anomalies October 1998 |
The surface warmth is most evident from northeastern China, southward to Indochina and then westward to Pakistan. Other regions of above normal temperatures include: the southern tier of North America, Argentina, western Australia, and west of the Black Sea. The coolest anomalies include eastern Australia, southwestern U.S. and northern Europe. |
| The driest region of the globe is southern Russia, where an upper level ridge dominated the region. There are also areas of below normal dryness in Argentina, and where the surface is frozen over north-central Russia and Canada. The areas with above normal wetness include north central North America, the Ganges river valley, where the strong monsoon rains persisted longer than normal, and Manchuria, where extensive rains delayed the autumn harvest. |  Satellite Derived Global Surface Wetness Anomalies October 1998 |
Wet in the Sahel
| The central and eastern Sahel experienced above normal wetness during the month of October. This promoted the growth of cereal grains and grass for pasture. Further to the east, near the horn of Africa, the rainfall was below normal, which will delay and retard the growing season in the area. |  Precipitation Anomalies October 1998 for Sahel |
| Below normal rainfall in Morocco allowed the farmers to sow there fields in anticipation of the autumn growing season. The corn growing region of northeastern South Africa was unusually wet in October, while the extreme southern tip of the country was drier than usual. |  Satellite Derived Surface Wetness Anomalies October 1998 for Africa |
Dry in Southern Russia; Wet in the Ganges River Valley
| The driest region of the globe extends from southern Russian to eastern Turkey. This area has been under high pressure during most of the month. The dryness has delayed the emergence of the winter wheat crop over the area. |  Precipitation Anomalies October 1998 for Southern Russia |
| In contrast, excessive rain extends from northern France across the Benelux countries into Poland. The soaked ground halted the harvest of sugar beets and corn, and delayed the planting of the winter wheat crop. Further to the east, the above normal wetness and temperature extended the growing season of the winter wheat crop, which usually becomes dormant by the middle of the month. |  Satellite Derived Surface Wetness Anomalies October 1998 for Europe |
Abnormal Snow and Cold in North Central Russia
| The snow cover over central Russia does not allow for the calculation of anomalies. However, the snow and wetness maps show this region has below normal snow cover, and below normal liquid water, which strongly indicate that these temperatures are cooler than normal (which corresponds with the persistent trough over this area of the world). Conversely, northern Canada has below normal snow cover and above normal wetness, indicating that temperatures are above normal. |  Global Snow Cover Anomalies October 1998 |
The Past 18 Months have either tied or broken that month's previous record

larger image
May'97-Oct'98 Avg. Global Temps vs. previous record
For more information, refer to ...
SSMI
Derived Products
Global Historical
Climatology Network (GHCN)
The
Global Temperature Anomalies
NOAA's National Climatic Data Center is the world's largest active
archive of weather data. The preliminary temperature and
precipitation rankings are available from the center by calling:
828-271-4800 or on the World Wide Web at: http:/www.ncdc.noaa.gov/ol/documentlibrary/cvb.html
Historical precipitation and temperature ranking maps are also available on the Internet at: https://nic.fb4.noaa.gov//products/analysis_monitoring/regional_monitoring/usa.ht ml.
NOAA works closely with the academic and science communities on climate-related research projects to increase the understanding of El Niño and improve forecasting techniques. NOAA's Climate Prediction Center monitors, analyzes and predicts climate events ranging from weeks to seasons for the nation. NOAA also operates the network of data buoys and satellites that provide vital information about the ocean waters, and initiates research projects to improve future climate forecasts. The long lead climate outlooks are available on the Internet at: https://nic.fb4.noaa.gov/.