

*Data are for the period June 1st–July 1st, and are from the National Interagency Fire Center.
Updated: 7 July 2010
[ June 1
 |
June 14
|
June 14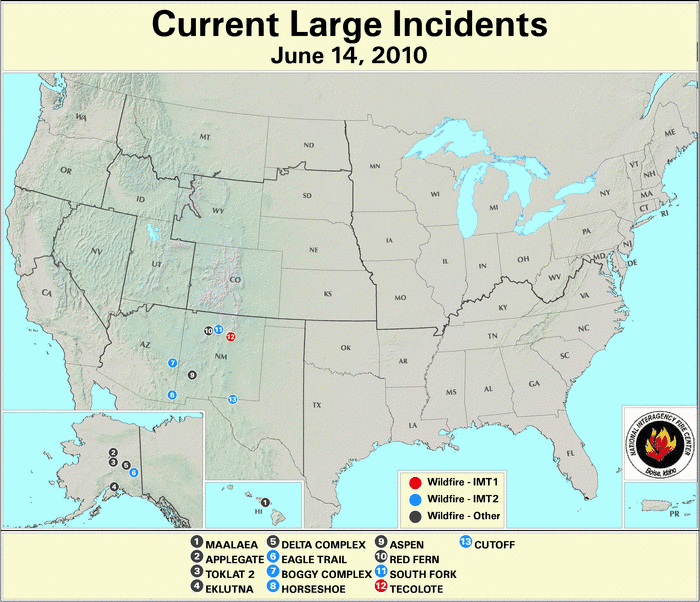 |
June 30
|
June 30 ]
]
Wildfire activity during June was near normal in terms of acreage burned with the number of reported fires much below average. The U.S. as a whole experienced above average precipitation and much above average temperatures for the month. The northern tier of the U.S. generally experienced above–average precipitation during June, while the southern half of the country had near– to below–average precipitation. The Southwest and Southeast were the driest regions, with the exception of south-central Arizona. The Great Lakes and the Pacific Northwest were the wettest areas of the country, with Michigan having its wettest June on record. Wildfire activity during the month was generally contained to those areas of the U.S. having below–average precipitation for the month. See the national temperature and precipitation State of the Climate report for additional information. Large wildfire activity at the beginning of the month was limited to the Southwest, with one fire in Colorado, two in New Mexico, one in Arizona, and one in western Texas. Nine fires were active in central Alaska where conditions have been dry for several months. By mid–month the fire activity in New Mexico increased with five wildfires burning, and another two were present in eastern Arizona. The fire activity continued in Alaska with five fires, and a fire on the Hawaiian island of Maui burned 2,300 acres. Hawaii has been experiencing Extreme (D3) and Exceptional (D4) Drought for most of 2010 year to date. On June 30th, 15 fires were burning across the country — one in northern Florida, three in both New Mexico and Arizona, two in Colorado and Idaho, and four in Alaska.

A very large wildfire affected northern Arizona, near Flagstaff, during the end of June, and was named the Shultz Fire. The fire began on June 20th, and was ignited by an abandoned camp fire. The fire burned 15,075 acres (6,070 hectares) and proved to be a challenge for firefighters due to the steep terrain in the region. At the end of the month the wildfire cost nearly $7.5 million dollars (according to the Arizona Daily Sun) and devastated the landscape and environmentally important resources in the Coconino National Forest. Numerous homes, businesses, and national park visitor centers were evacuated as a precaution. The fire was 100 percent contained on June 30th.
2010 Wildfire Statistics
(Source: NIFC)| Year–To–Date Totals as of July 1st | Nationwide Number of Fires | Nationwide Number of Acres Burned |
|---|---|---|
| 07/01/2010 | 29,811 | 1,486,681 |
| 07/01/2009 | 48,399 | 1,904,044 |
| 07/01/2008 | 36,656 | 2,173,153 |
| 07/01/2007 | 46,368 | 1,837,507 |
| 07/01/2006 | 57,248 | 3,752,513 |
| 07/01/2005 | 29,742 | 1,705,654 |
| 07/01/2004 | 38,622 | 1,673,557 |
| 07/01/2003 | 27,286 | 767,018 |
| 07/01/2002 | 44,759 | 2,817,641 |
| 07/01/2001 | 40,837 | 1,094,120 |
| 07/01/2000 | 49,000 | 1,633,941 |
| 5–yr average (2005 – 2009) |
43,682 | 2,274,574 |
| 10–yr average (2000 – 2009) |
41,891 | 1,935,915 |
According to statistics from the National Interagency Fire Center (NIFC), at the beginning of July, the number of nationwide fires year-to-date was 29,811 which burned 1,486,681 acres (601,639 hectares) with an average of 49.9 acres (20.2 hectares) per fire. Between June 1st and July 1st, approximately 812,459 acres (328,791 hectares) burned across the U.S., which is 3 percent below the 2000-2009 average and marked the fifth most (sixth least) June acreage burned since 2000. A total of 4,057 new fires were reported during the month, which is 54 percent below the 2000-2009 average and the lowest number of new June fires reported since records began in 2000. The average number of acres burned per fire was 201.8 (81.6 hectares) during June and is 94 percent above the 2000-2009 average and the second most acres burned per fire in the 11–year period of record.
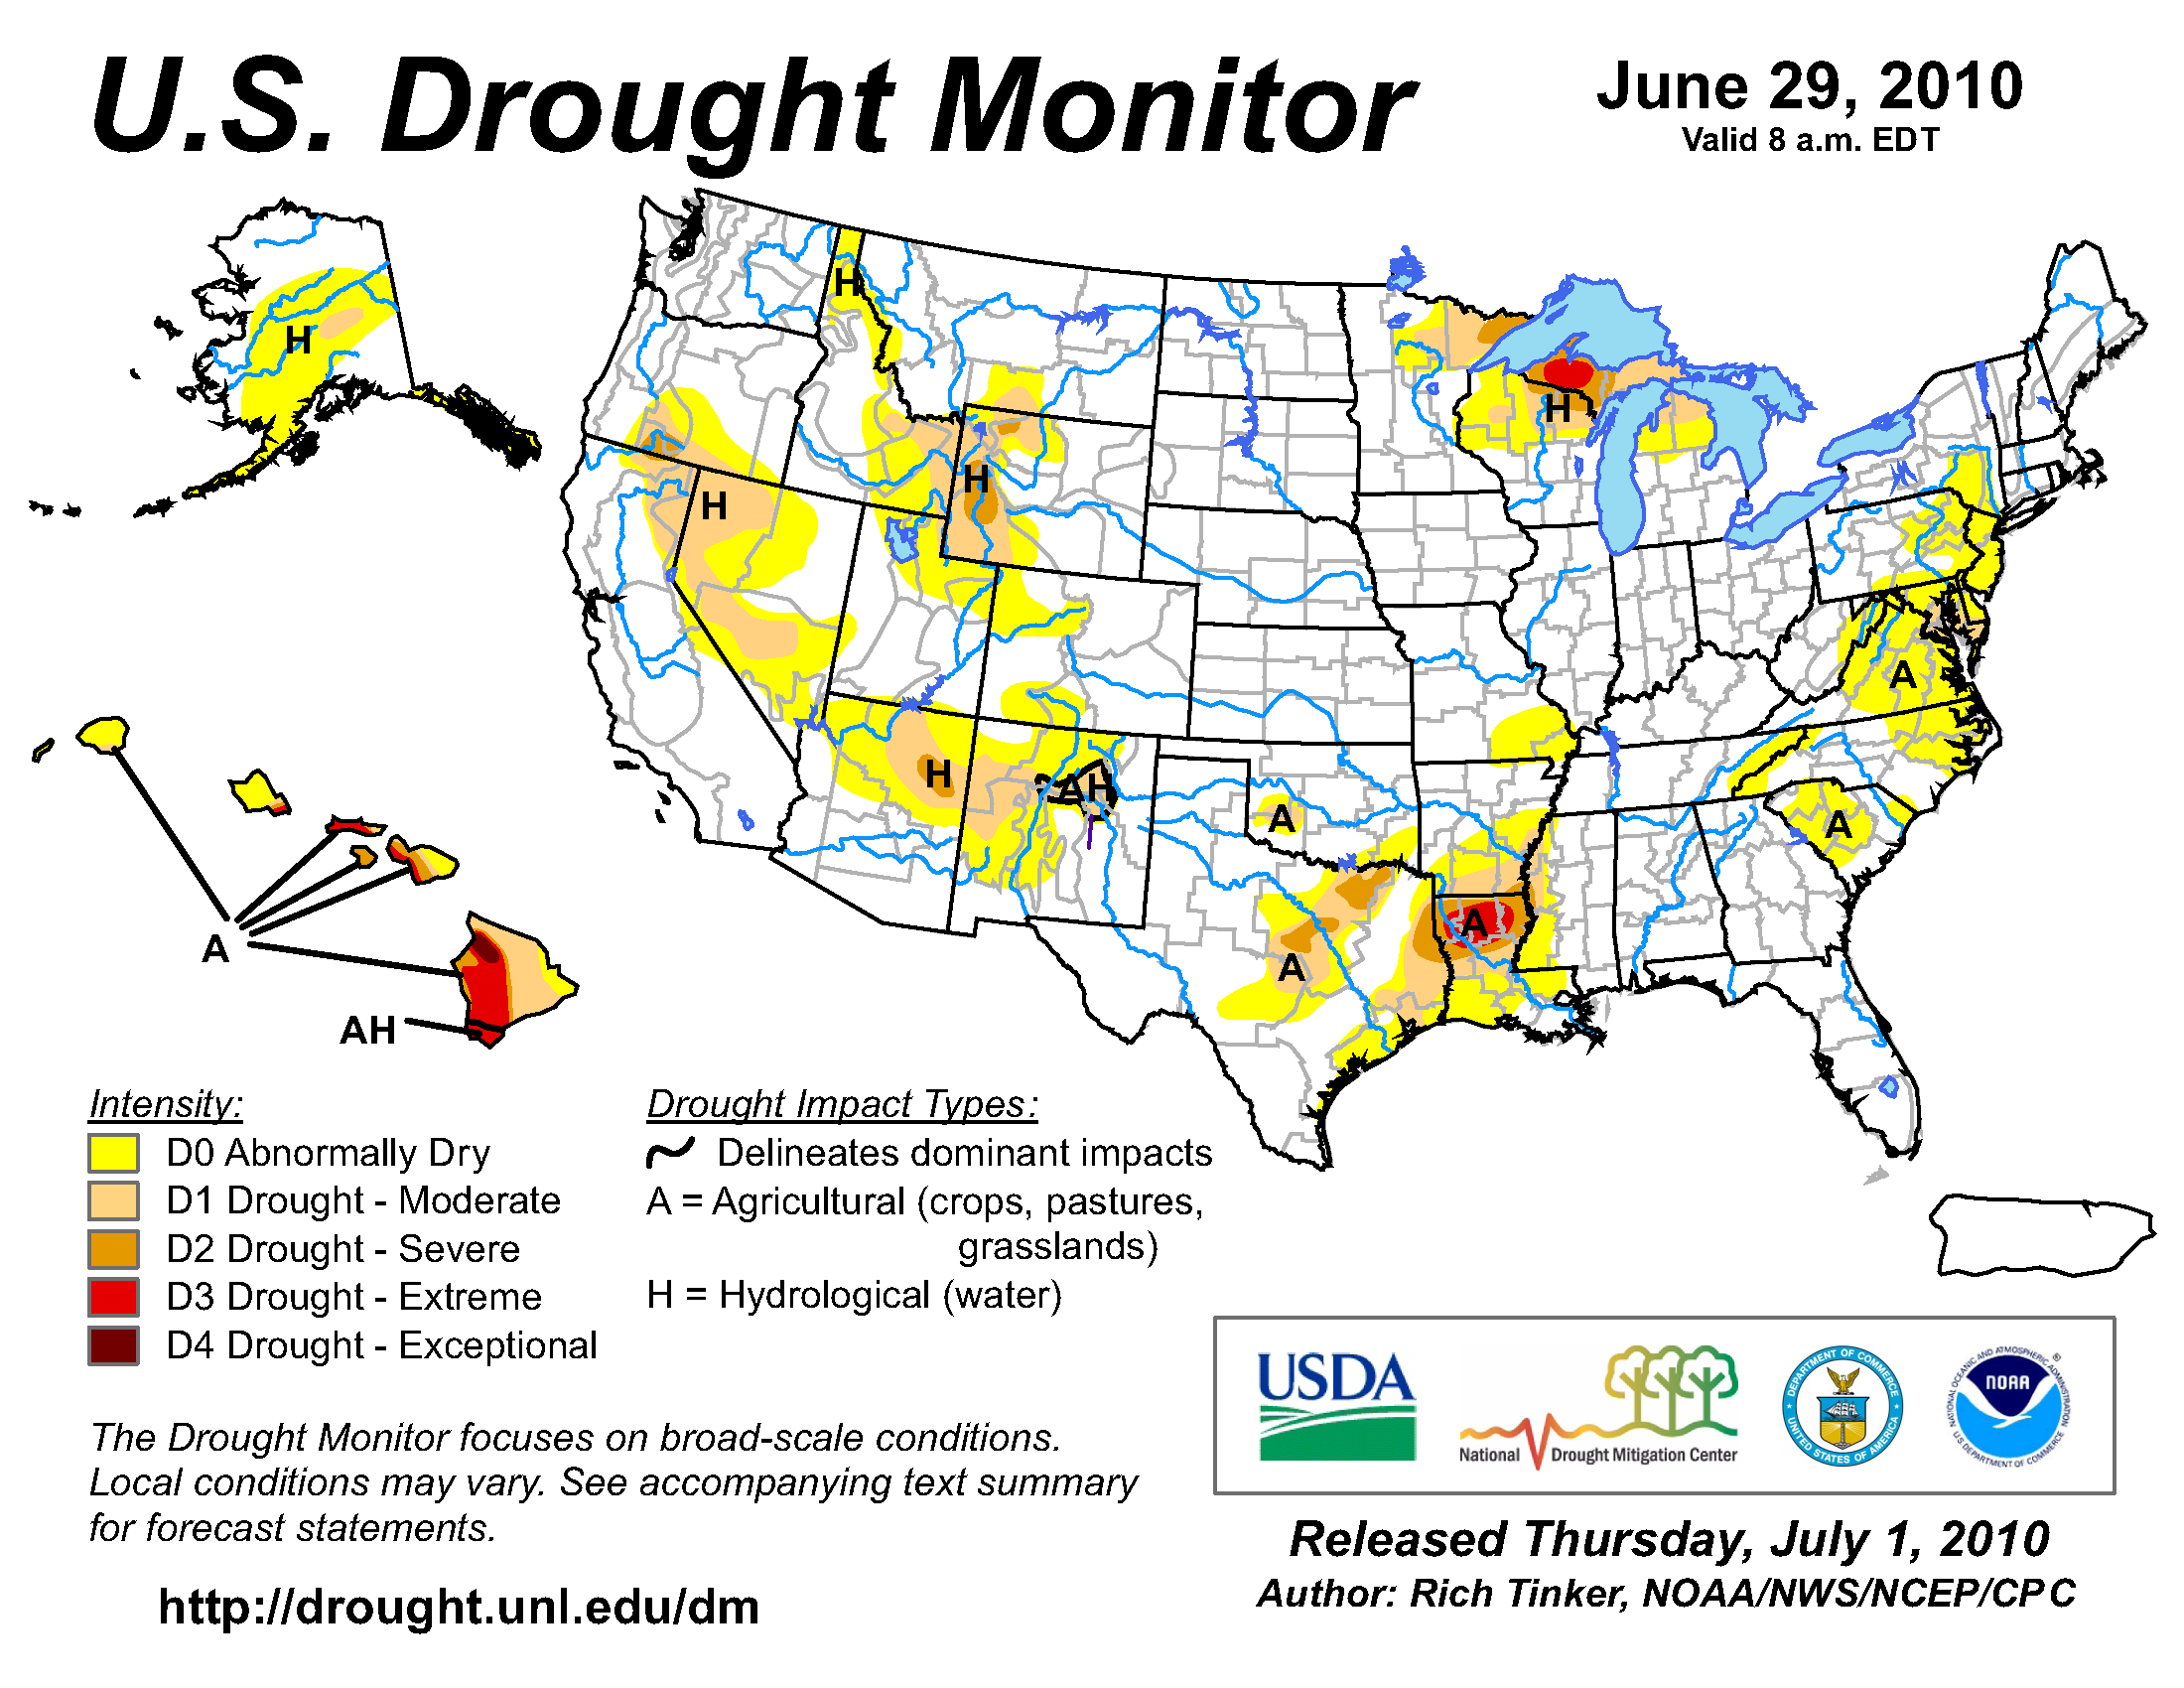
Although the contiguous U.S. experienced above–normal precipitation during June, some regions experienced worsening drought while others had drought improvement, according to the U.S. Drought Monitor. Abnormally dry conditions across the Pacific Northwest were essentially eliminated during June. Drought improved by a category (from Severe drought to Moderate Drought) across Northern California and Nevada, while the severe drought in western Wyoming shrank significantly. The extreme drought conditions in the western Great Lakes also contracted in size, but a small pocket of extreme drought continued in the western upper peninsula of Michigan. Drought worsened to extreme conditions across northern Louisiana, and severe drought was declared over a large portion of eastern Texas. The mid-Atlantic had a very dry month, and abnormally dry conditions were declared over most of the region and a moderate drought set up across southern Maryland and the Delmarva Peninsula. Dry conditions continued across Hawaii with extreme drought expanding onto the western islands. Exceptional drought continued on the Big Island, and was the only location in the U.S. experiencing drought of this magnitude. Central Alaska continued its dry streak with a continuation of moderate drought. Conversely, the southeast portions of the state received significant rainfall, eliminating the abnormally dry conditions there.

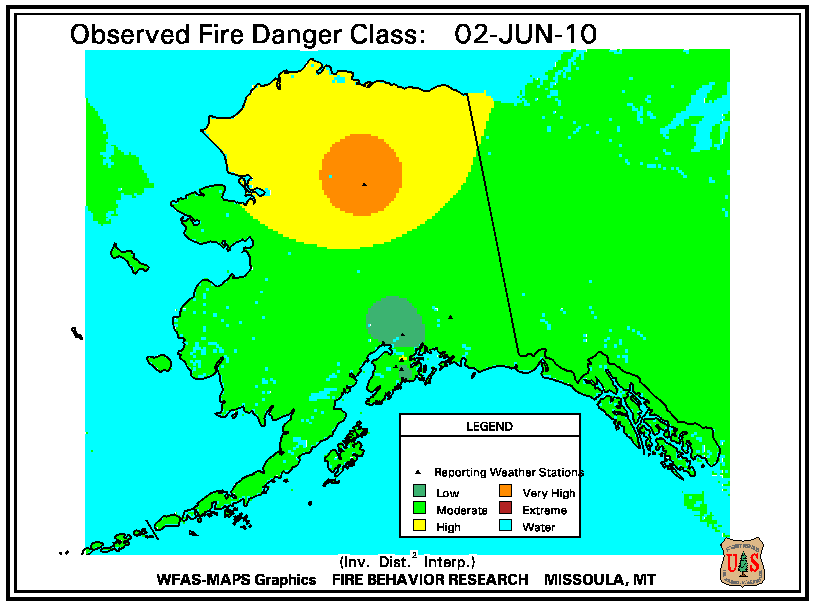
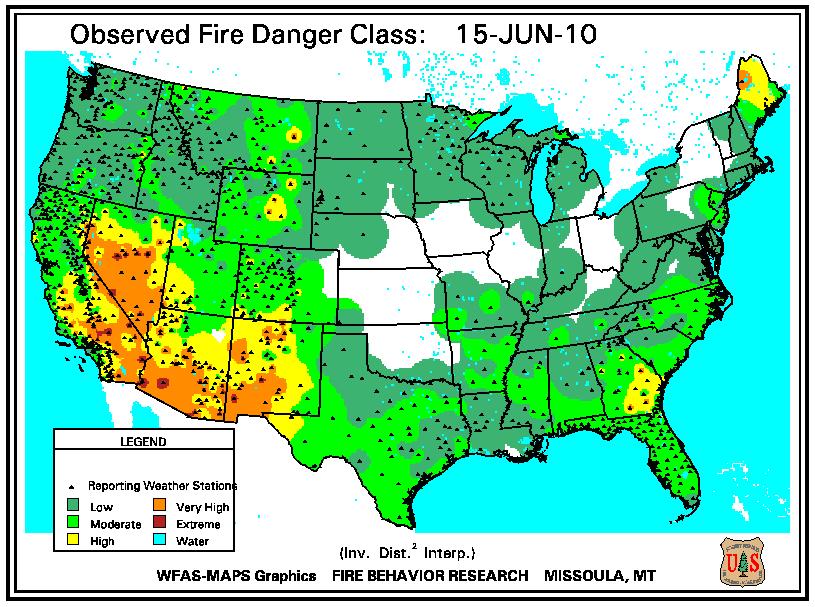
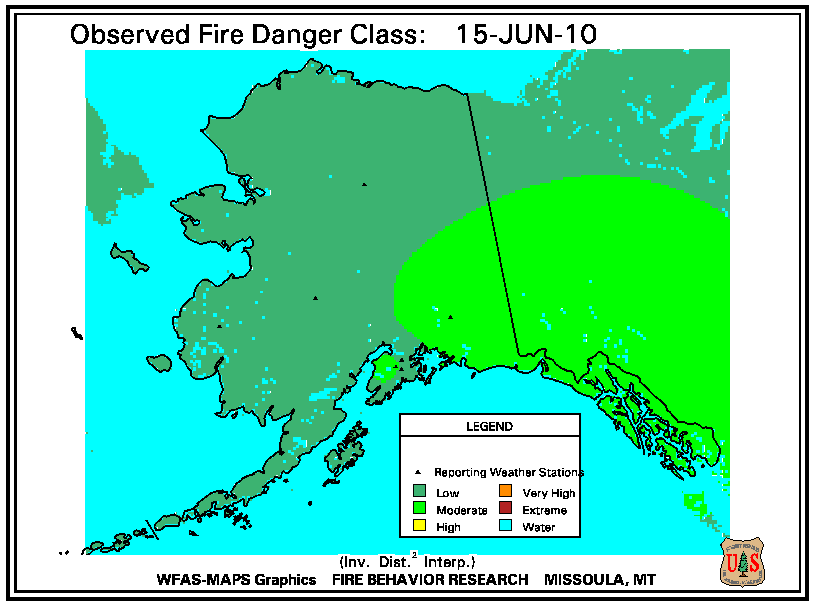
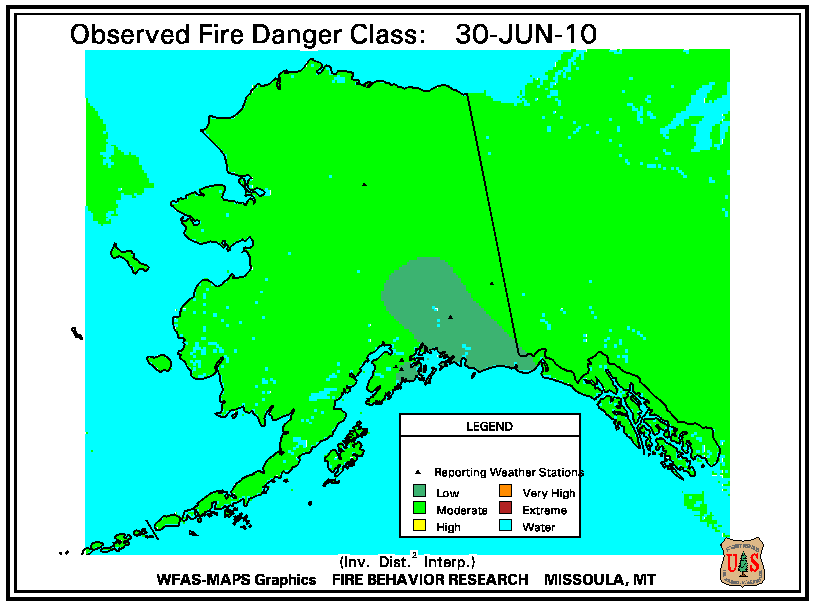
According to the U.S. Forest Service (USFS) Wildland Fire Assessment System, at the beginning of the June high fire danger was only present across the interior West. Very high fire danger was reported in central Wyoming, western Texas, much of New Mexico, central Arizona, and northern Alaska. By June 15th, the very high fire danger expanded in the West to include much of Nevada and southern California. Very high fire danger was also reported in northern Maine and southern Georgia. At the end of June, the very high fire danger subsided across much of New Mexico, western Texas, and eastern Arizona. Very high to extreme fire danger occurred in the Great Basin, central Wyoming, and Southern California.
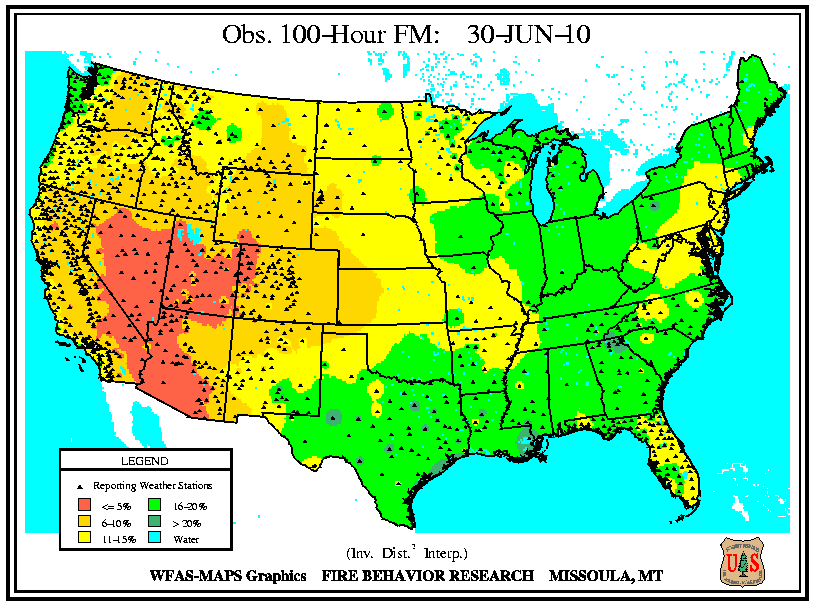
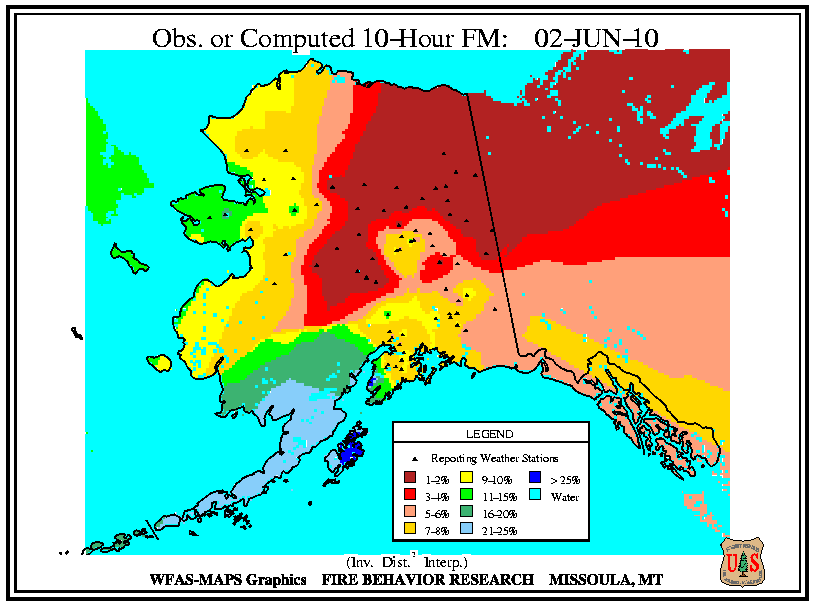
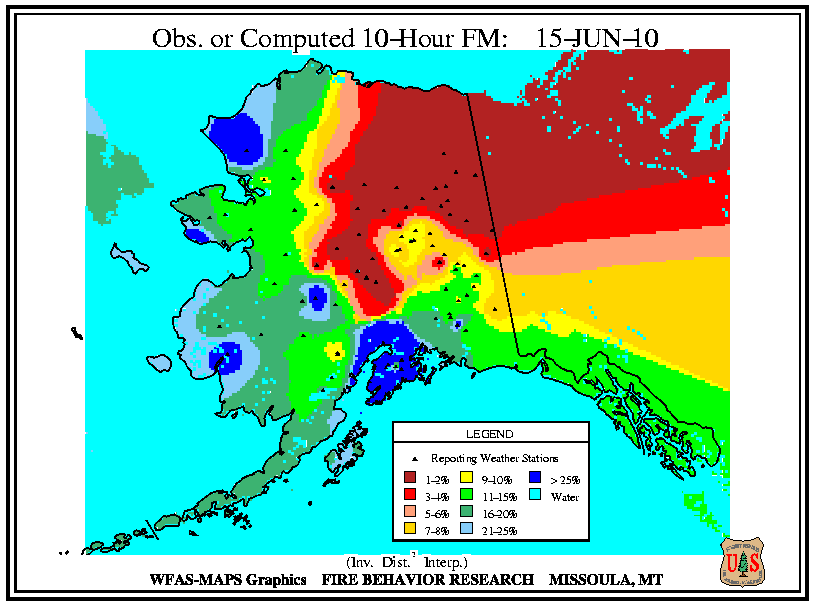
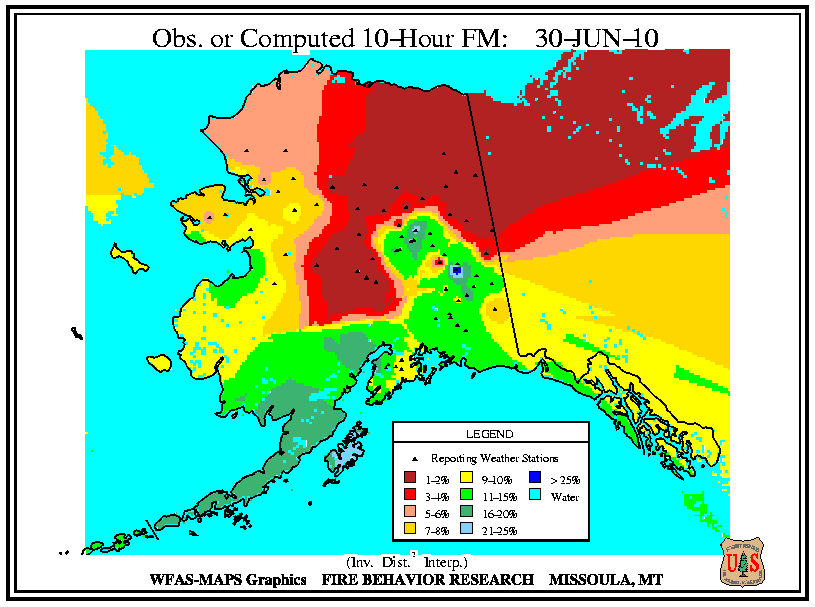
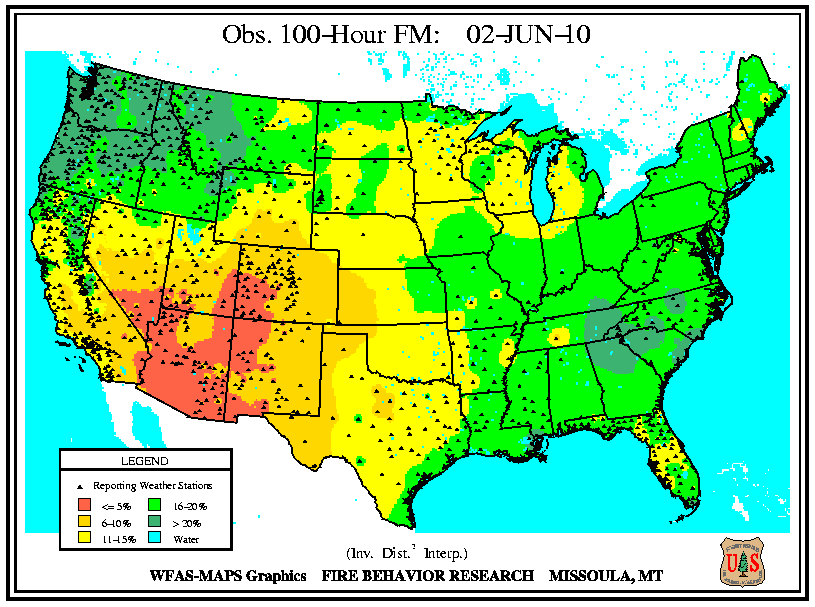
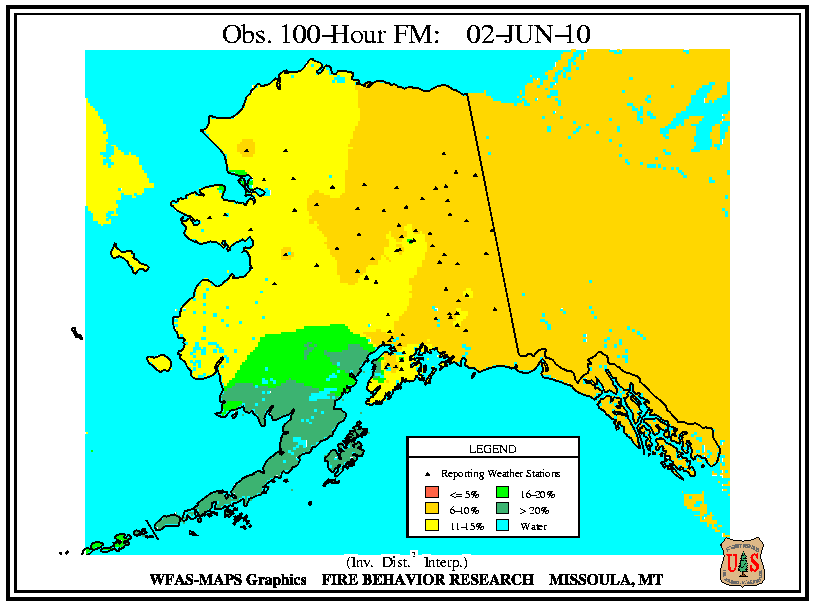
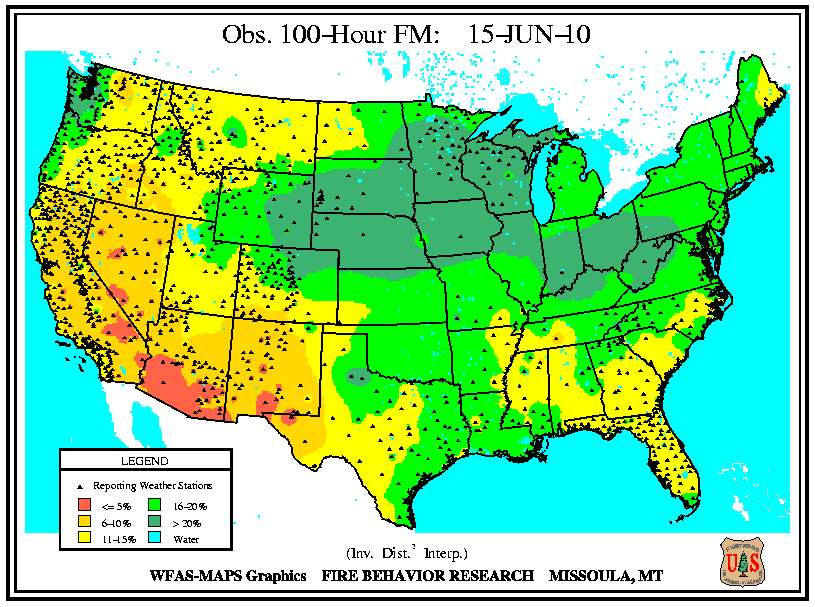
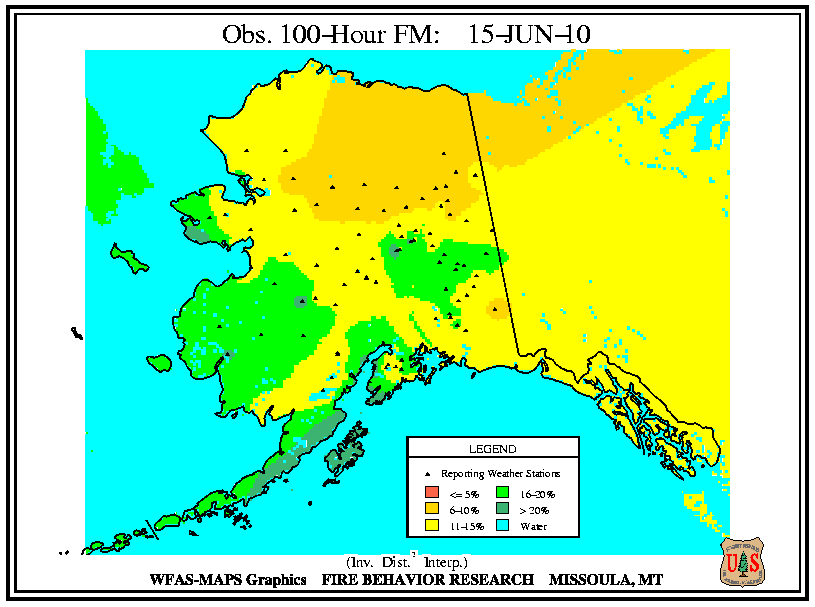
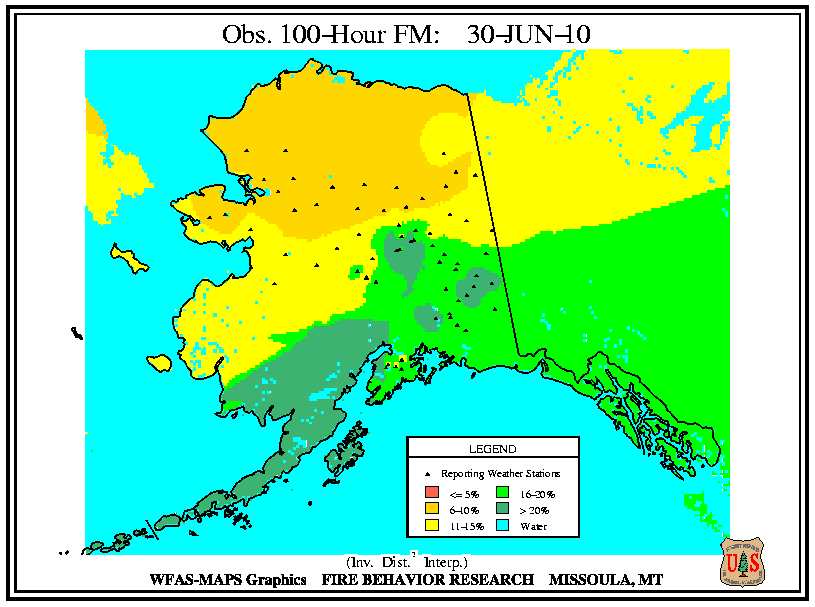
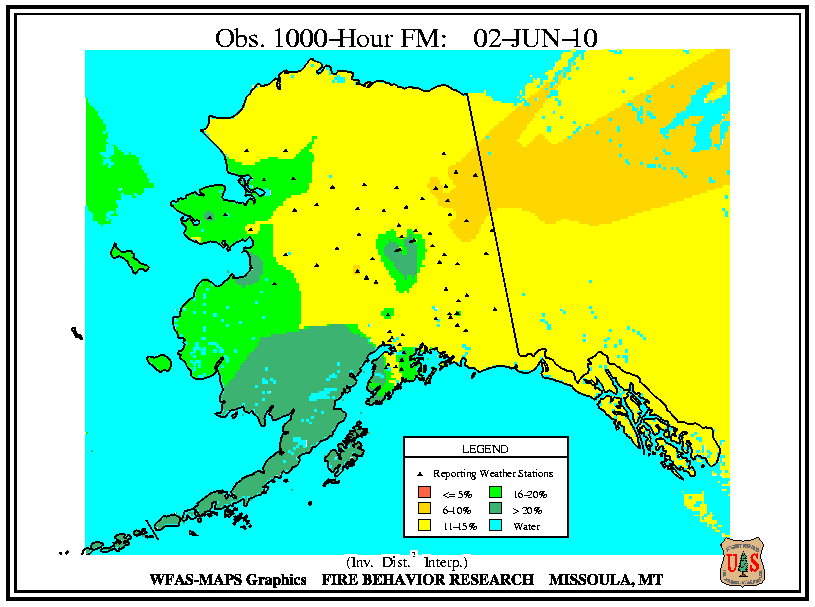
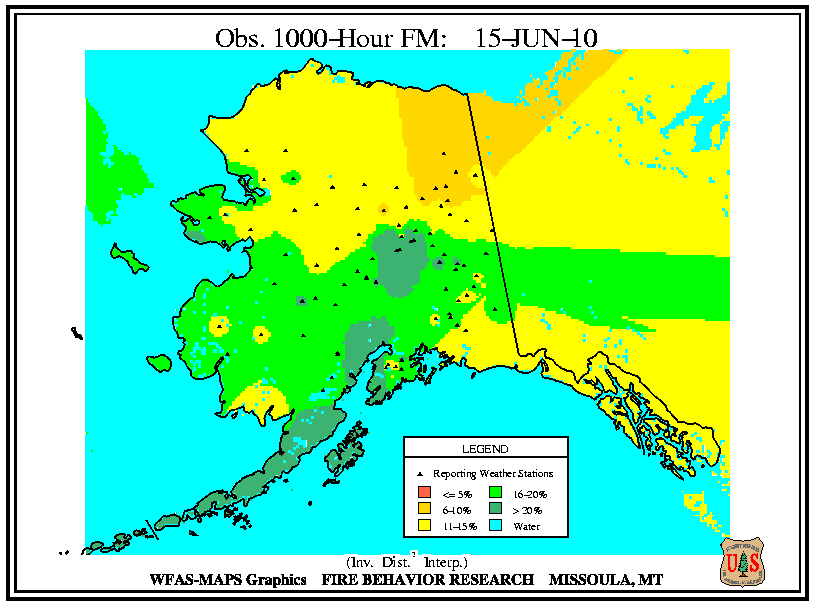
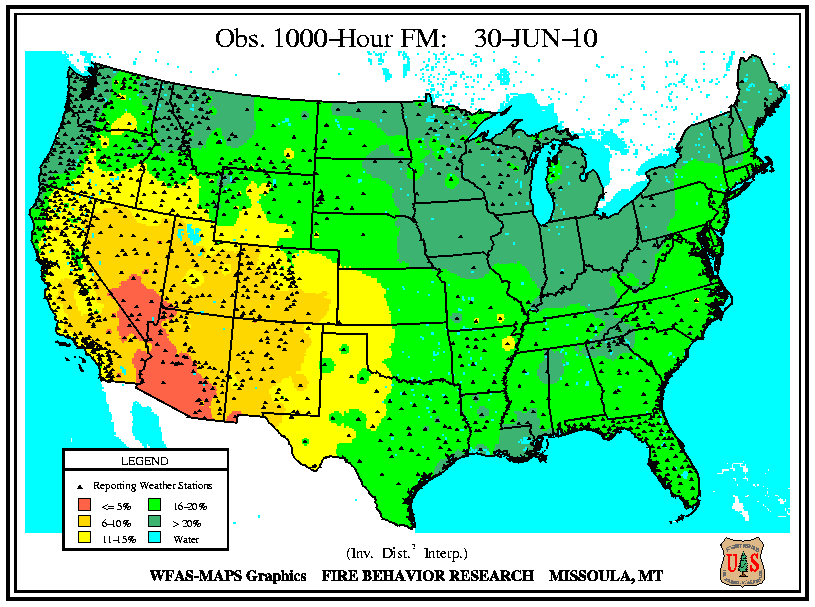
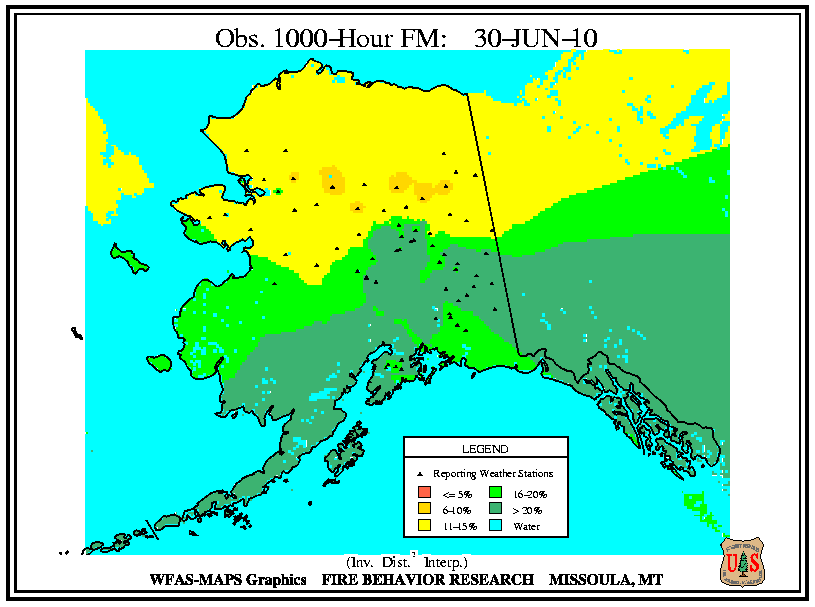
According to the USFS Wildland Fire Assessment System, the driest 10-hour and 100-hour fuels at the beginning of June were occurring in the Southwest, with moderately dry small fuels across the upper Midwest, southern Plains and the southeast Atlantic Coast. Dry large fuels (1,000-hour) were widespread across the Southwest, with the driest large fuels occurring in Arizona. In Alaska, only small and medium size fuels were dry (10-hour and 100-hour) across most of the state, except for the western regions where small fuels were not dry. On the 15th, the dryness of 10-hour and 100-hour fuels expanded to encompass much of the Southeast. The dryness in the West also expanded to cover most of the area west of the Rockies, except coastal Oregon and Washington. The 1,000-hour fuel moistures remained generally the same by mid-month. By June 30th, the 10-hour and 100-hour fuel moistures were extremely dry over the West, with the driest fuel moistures in the Great Basin. Fuels were also dry for much of the Plains, Midwest, and Northeast. Conditions improved for the Southeast. The largest fuels remained generally unchanged by the end of the month, with the driest large fuels occurring in Arizona and Nevada. In Alaska, dry fuels of all sizes were reported across the northern two-thirds of the state, with high fuel moistures along the southern coasts.
Did You Know?
Dead Fuel Moisture
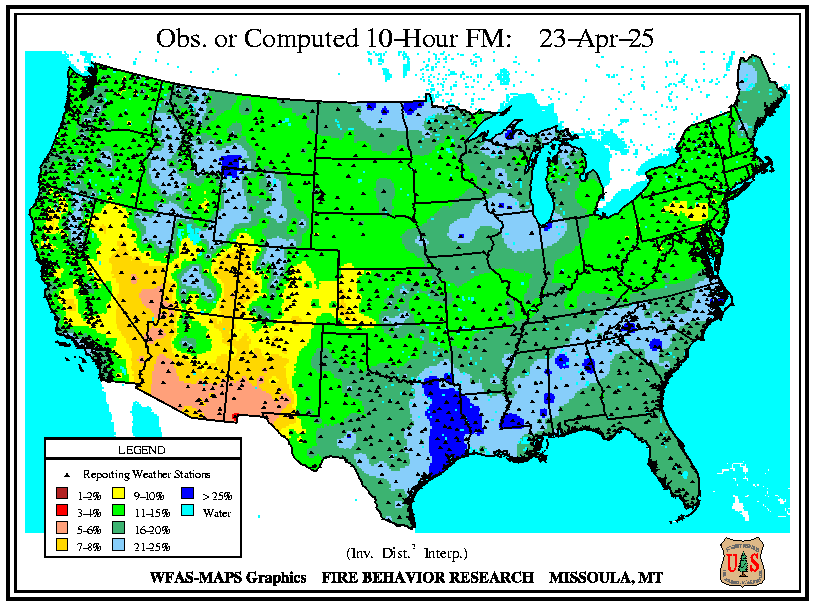
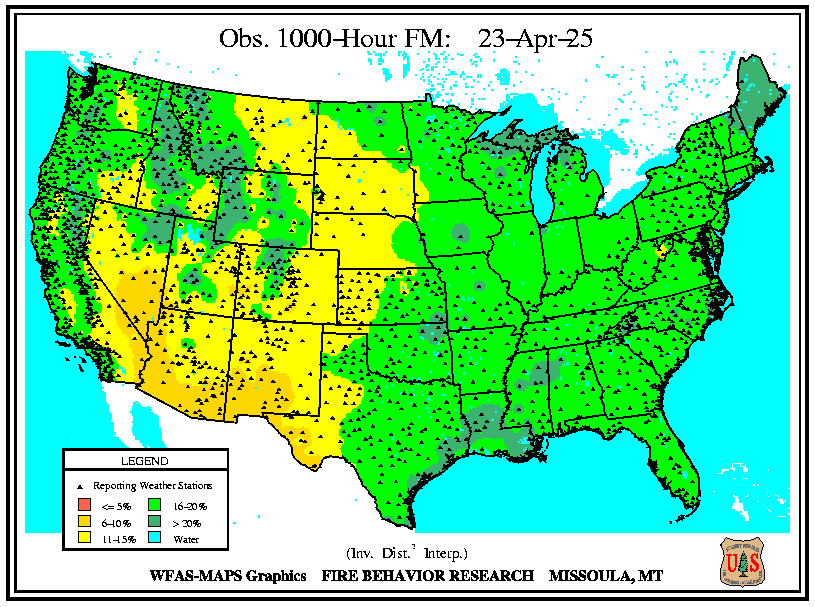
The fuel moisture index is a tool that is widely used to understand the fire potential for locations across the country. Fuel moisture is a measure of the amount of water in a fuel (vegetation) available to a fire, and is expressed as a percent of the dry weight of that specific fuel. For example, if a fuel were totally dry, the fuel moisture content would be zero percent. Fuel moisture is dependent upon both environmental conditions (such as weather, local topography, and length of day) and vegetation characteristics. When fuel moisture content is high, fires do not ignite readily, or at all, because heat energy has to be used to evaporate and drive water from the plant before it can burn. When the fuel moisture content is low, fires start easily and will spread rapidly - all of the heat energy goes directly into the burning flame itself. When the fuel moisture content is less than 30 percent, that fuel is essentially considered to be dead. Dead fuels respond solely to current environmental conditions and are critical in determining fire potential. The dead fuel moisture threshold (10–hour, 100–hour, or 1,000–hour), called a time lag, is based upon how long it would take for 2/3 of the dead fuel to respond to atmospheric moisture. Small fuels (less than 1/4 inch in diameter), such as grass, leaves, and mulch respond more quickly to changes in the atmospheric moisture content, and take 10 hours to adjust to moist/dry conditions. Larger fuels lose or gain moisture less rapidly through time. Fuels that are 3 inches to 8 inches in diameter, such as dead fallen trees and brush piles can take up to 1,000 hours to adjust to moist conditions, and are represented by the 1,000–hour dead fuel moisture index. 1,000+ hour fuels do not burn easily, but if they do burn, they will generate extreme heat often causing dangerous fire behavior conditions.
| Time Lag | Fuel Size | Determination |
|---|---|---|
| 10–hour | 0.25 to 1 inch diameter | Computed from observation time temperature, humidity, and cloudiness. Can also be an observed value, from a standard set of fuel sticks that are weighed as part of the fire weather observation. |
| 100–hour | 1 to 3 inches diameter | Computed from 24–hour average conditions composed of day length, hours of rain, and daily temperature/humidity ranges. |
| 1000–hour | 3 to 8 inches diameter | Computed from a 7–day average conditions composed of day length, hours of rain, and daily temperature/humidity ranges. |
Check out the Wildand Fire Assessment System for additional information.

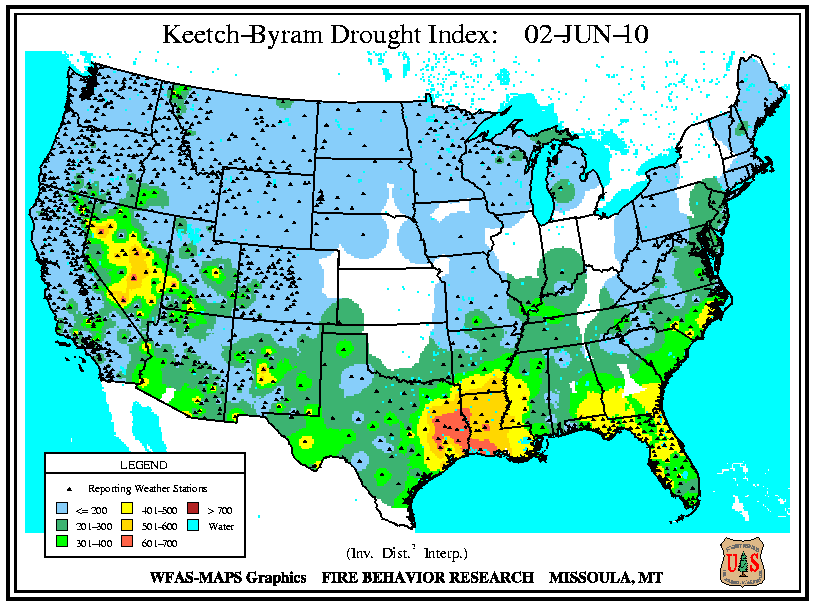
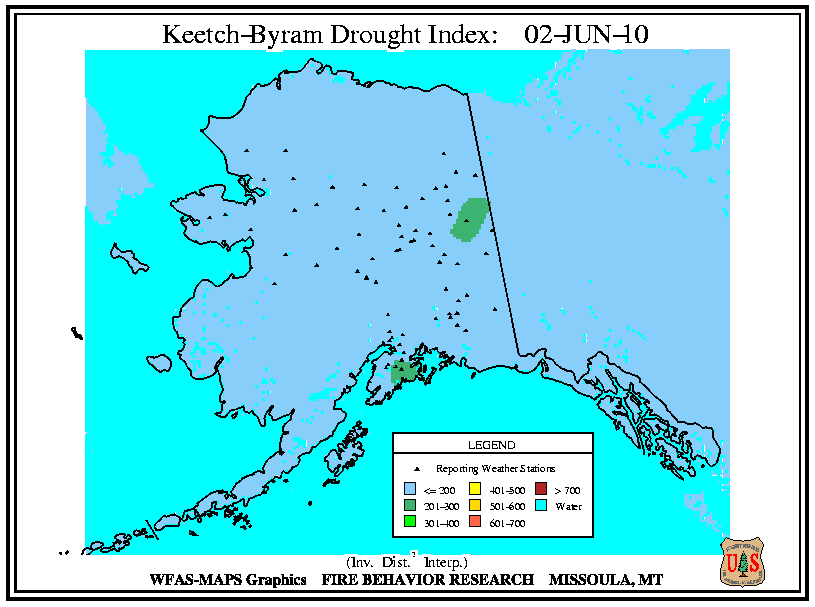
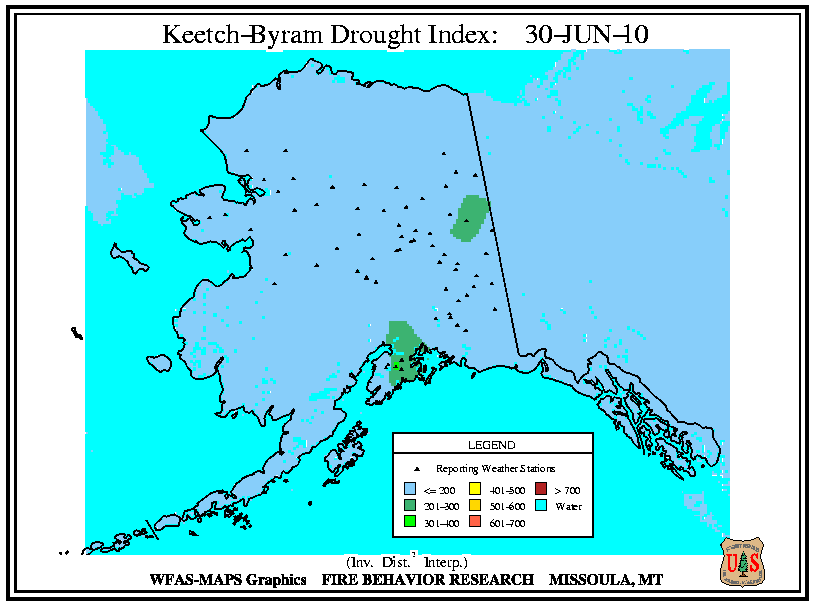
According to the USFS Wildland Fire Assessment System, at the beginning of the month, high Keetch–Byram Drought Index (KBDI) values were confined to central Nevada and portions of the Gulf Coast. By mid-June, the high KBDI values expanded along the entire Southeast coast into the Mid-Atlantic, as well as into the lower Mississippi River Valley. As the month progressed, conditions at the end of the month worsened in the Great Basin and southern Arizona with KBDI values exceeding 600. High KBDI values also expanded further northward along the Mississippi River, and northward along the Mid-Atlantic coast with high KBDI values extending into New Jersey.