El Niño Conditions Developing
Sea Surface Temperatures (SSTs) and Mixed Layer Conditions:

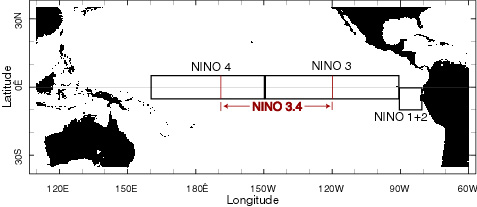
June saw a transition from ENSO-neutral to El Niño conditions across the equatorial Pacific Ocean. Sea surface temperature (SST) anomalies in the Niño 3.4 region increased for a sixth consecutive month and, as with May, the SST anomalies of all four Niño regions were above average. Although an El Niño event is defined as having a minimum of five consecutive three-month periods in which the Niño 3.4 SST anomaly exceeds +0.5°C (+0.9°F), El Niño conditions (SST anomalies surpassing +0.5°C) were present in all of the Niño regions in June.
For the most recent equatorial Pacific Ocean surface temperatures, please visit NOAA's Tropical Atmosphere Ocean (TAO) project and for weekly or monthly Niño region average SST and anomaly values, visit the Climate Prediction Center's Atmospheric and SST Index values page.

Subsurface oceanic heat content anomalies for the equatorial Pacific Ocean continued to increase in June in response to a deepening of the thermocline. Such increases in surface and subsurface oceanic temperature anomalies typically precede the development of an El Niño.
While the most recent (April – June) Oceanic Niño Index (ONI) value of +0.2°C (+0.4°F) has not yet exceeded the critical +0.5°C threshold that would mark the start of an El Niño event, the past four ONI values have all shown an increase over the preceding value. A continuation of this warming trend into July would result in the onset of an El Niño event by the end of that month. (NOTE: For NOAA's official ENSO classification scheme, please see NOAA's El Niño/La Niña Index Definition). Five consecutive values at or below this threshold constitutes a La Niña episode.


Current observations, recent trends, and the dynamic computer models are converging on a consensus for the development of an El Niño event over the summer, although there exists a wide range of estimates regarding the strength of the event. Historically, impacts over the United States from El Niño tend to be weak during the summer and strengthen toward the winter months. Fall Atlantic hurricane activity may be suppressed during an El Niño due to increased vertical wind shear above the tropical Atlantic.

Equatorial Zonal Winds (U-Component Winds) and Sea-Level Topography:

Trade winds continued to be weaker than normal during June over much of the tropical Pacific, but especially so in eastern regions. However, toward the end of the month, low–level tropospheric winds increased slightly over the western tropical Pacific. Collectively, the recent oceanic and atmospheric anomalies were consistent with a developing El Niño event.


Pacific sea levels measured by the NASA/JPL Jason satellite reflected developing El Niño conditions across the tropical Pacific Ocean in June. Below-average sea level was developing across the western Pacific to about 160°W, while an area of above-average sea level anomalies was growing in the eastern tropical Pacific east of that longitude. This pattern is historically consistent with El Niño activity.
Outgoing Longwave Radiation (OLR):
Although anomalies remained slightly above normal for June, Outgoing Longwave Radiation (OLR) values decreased for the seventh consecutive month, from +2.3 W/m2 in December to +0.3 W/m2 in June. The map below on the left shows the spatial pattern of global OLR (in W/m2) measured by satellite during June. Weekly OLR anomalies dropped below average toward the end of the month. The level of OLR is related to the amount of cloudiness, and hence convective activity over the region. A lack of convection along the Equator near the Date Line has persisted since the development of the cold event in late May 2007, but cloudiness and convective activity in this region increased markedly toward the end of June, while concurrently, convection has become increasingly suppressed over Indonesia, which combined indicates strengthening El Niño conditions.


The monthly OLR anomaly for June marked the 29th consecutive month that the OLR index had a positive monthly value. Persistently high positive OLR indices are typical of the mature phase of a La Niña episode, while negative values indicate the presence of increased convection and warm phase conditions.
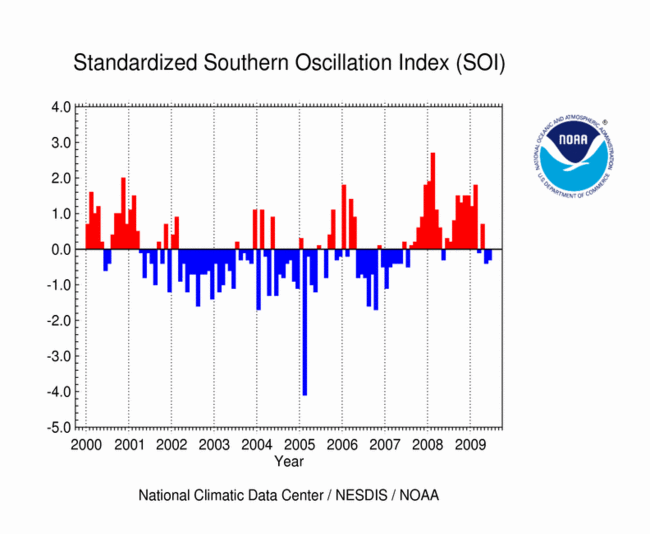
Southern Oscillation Index (SOI):

The Southern Oscillation Index (SOI), a measure of the surface pressure difference between Tahiti and Darwin (Australia), was –0.3 for the month of June; up from –0.4 in May, but fostering the development of a negative SOI phase. Prolonged periods of negative SOI values correspond to warmer–than–normal sea surface temperatures and El Niño episodes.
Additional Links
- ENSO Monitoring
- NOAA El Niño / La Niña Index Definition
- NOAA's Pacific Marine Environmental Laboratory (PMEL):
- NOAA's Climate Prediction Center (CPC):
- NOAA's Physical Science Laboratory
- NASA/JPL Ocean Surface Topography from Space
- Australian Bureau of Meteorology (BoM) Climate Driver Update
- IRI - International Research Institute