|
Sea-Surface
Temperatures (SSTs) and
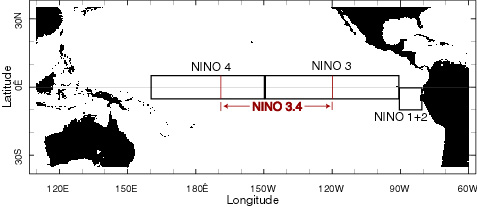
Mixed-Layer Conditions: In the central equatorial Pacific, SST anomalies increased significantly in July, which led to an increase in the monthly averaged Niño 3.4 index. Above average ocean temperatures were also observed in the mixed-layer, with the largest anomalies west of 140°W. In addition, the depth of the 20°C isotherm increased as well in July, with the anomalies reaching 15-20 m in the central Pacific. In the western equatorial Pacific, above normal SST anomalies also increased during July, which was reflected in the monthly averaged SST anomaly in the Niño 4 Index (map of Niño regions). For the most recent ocean surface temperature conditions, please see the loop of satellite-derived weekly SST anomalies for July. The observed gradient in SSTs across the equatorial Pacific has increased over the past several months, and this can be seen in the data from NCDC's Extended Reconstructed Sea Surface Temperature dataset (ERSST version 2). For July, the Niño 3.4 index increased to +0.67°C (+1.2°F) above normal, and the 3-month running mean increased as well. (NOTE: A running 3-month mean SST anomaly above +0.5°C in the Niño 3.4 region is one indicator that an El Niño is occurring. For the official NOAA classification scheme, please see NOAA's El Niño/La Niña Index Definition and see the CPC ENSO Diagnostic Discussion for their latest official assessment of ENSO conditions.) |
 |
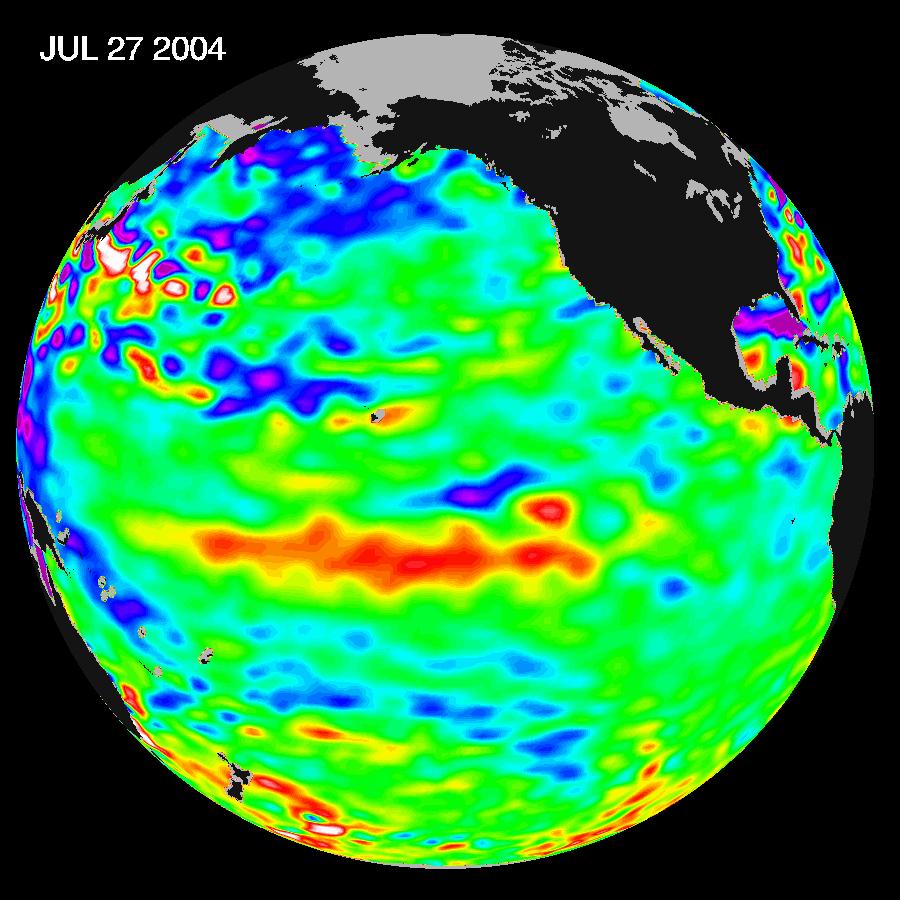
Equatorial Zonal
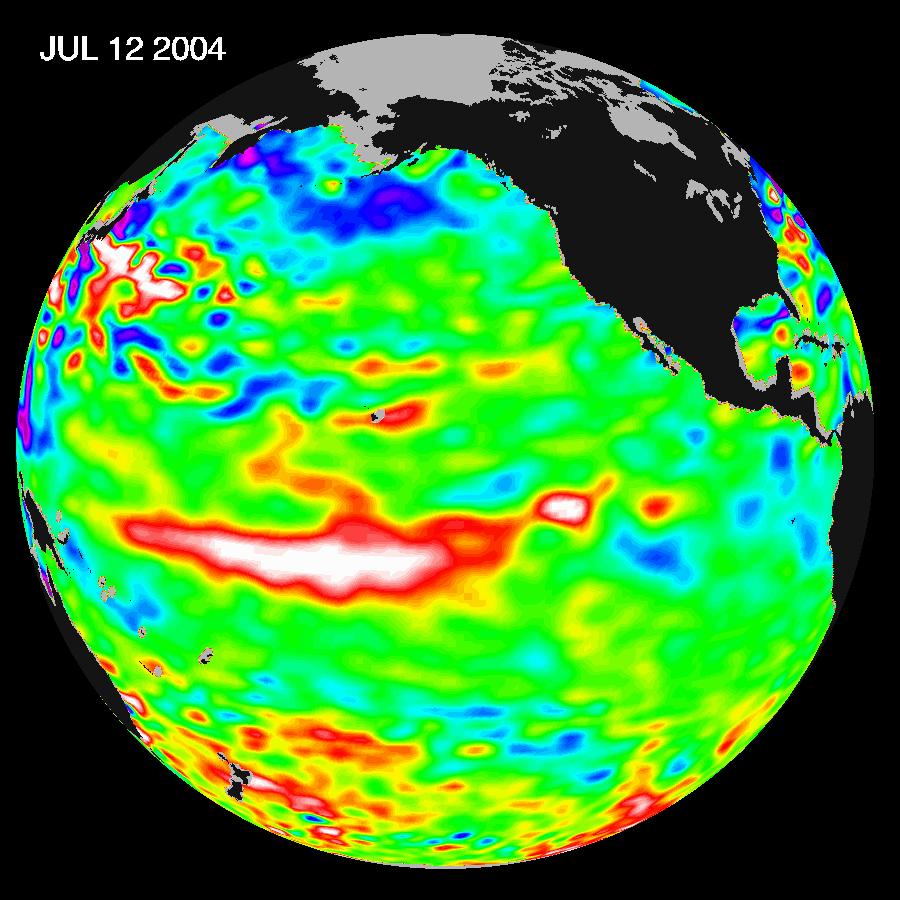
Winds (U-Component Winds) and Sea-Level Topography: Easterly trade wind flow weakened during July across the equatorial Pacific basin, resulting in positive zonal wind anomalies for the month. The decrease in the trade winds resulted in weaker equatorial upwelling, which led to an increase in the average SST anomalies in the central equatorial Pacific. Below average SSTs remained in the eastern equatorial Pacific and along the South American coast. The July average zonal wind field clearly illustrates that westerly zonal wind anomalies were present in the equatorial Pacific from Indonesia eastward to 130°W. The observed weakening of the trade winds in late June and early July helped to generate an oceanic Kelvin wave. This Kelvin wave has moved eastward in July, and is expected to reach the South American coast sometime in August. Satellite altimetry of ocean surface topography from the NASA/JPL Jason-1 satellite over the Pacific basin and global oceans is shown to the left. Increases in sea-level, shown on these images as positive sea-level anomalies, developed in the central equatorial Pacific in mid-July and moved eastward in late July (see the 12 July 2004 and 27 July 2004 overpasses). |
|
Outgoing Longwave Radiation (OLR): The monthly averaged OLR index value for July was positive across the region centered over the dateline in the western Pacific between 160°E and 160°W. Since the beginning of 2004 there has been no consistent trend in the OLR index, which has shifted sign several times after a nine-month period of positive values. The map to the left shows the spatial pattern of global OLR anomalies in July. The negative OLR anomalies in the western Pacific north of New Guinea reflected areas of enhanced tropical convection associated with two Northwest Pacific typhoons, while the positive OLR anomalies south of New Guinea in the Coral Sea were associated with below normal convection in the South Pacific Convergence Zone (SPCZ). Also of note are the positive anomalies and suppressed tropical convection observed in July over the central and eastern Pacific just north of the equator. High frequency variability in OLR is typically associated with the Madden-Julian Oscillation (MJO) (MJO related convective activity propagates west to east in the near-equatorial region from the Indian Ocean into the Pacific Ocean approximately every 30-60 days). The latest MJO activity can be seen in CPC's graphs of Daily MJO Indices. |
 |
Southern Oscillation Index (SOI): Since November 2003, the SOI has switched signs numerous times, reflecting the lack of any consistent mean-sea-level pressure pattern across the tropical Pacific associated with ENSO. However, the standardized SOI remained negative for the second straight month in July, with an averaged index value of -0.7 for the month. This is comparable to the negative SOI values observed during the 2002-2003 El Niño. The negative SOI the past two months is consistent with ENSO warm event (i.e. El Niño) conditions and the above normal SSTs that were observed in the central equatorial Pacific during July. |
Additional Links
- ENSO Monitoring
- NOAA El Niño / La Niña Index Definition
- NOAA's Pacific Marine Environmental Laboratory (PMEL):
- NOAA's Climate Prediction Center (CPC):
- NOAA's Physical Science Laboratory
- NASA/JPL Ocean Surface Topography from Space
- Australian Bureau of Meteorology (BoM) Climate Driver Update
- IRI - International Research Institute