|
Contents Of This Report: |


|
Please note that the values presented in this report are based on preliminary data. They will change when the final data are processed, but will not be replaced on these pages.
National Drought Overview
|
|
[top]
Detailed Drought Discussion
Overview
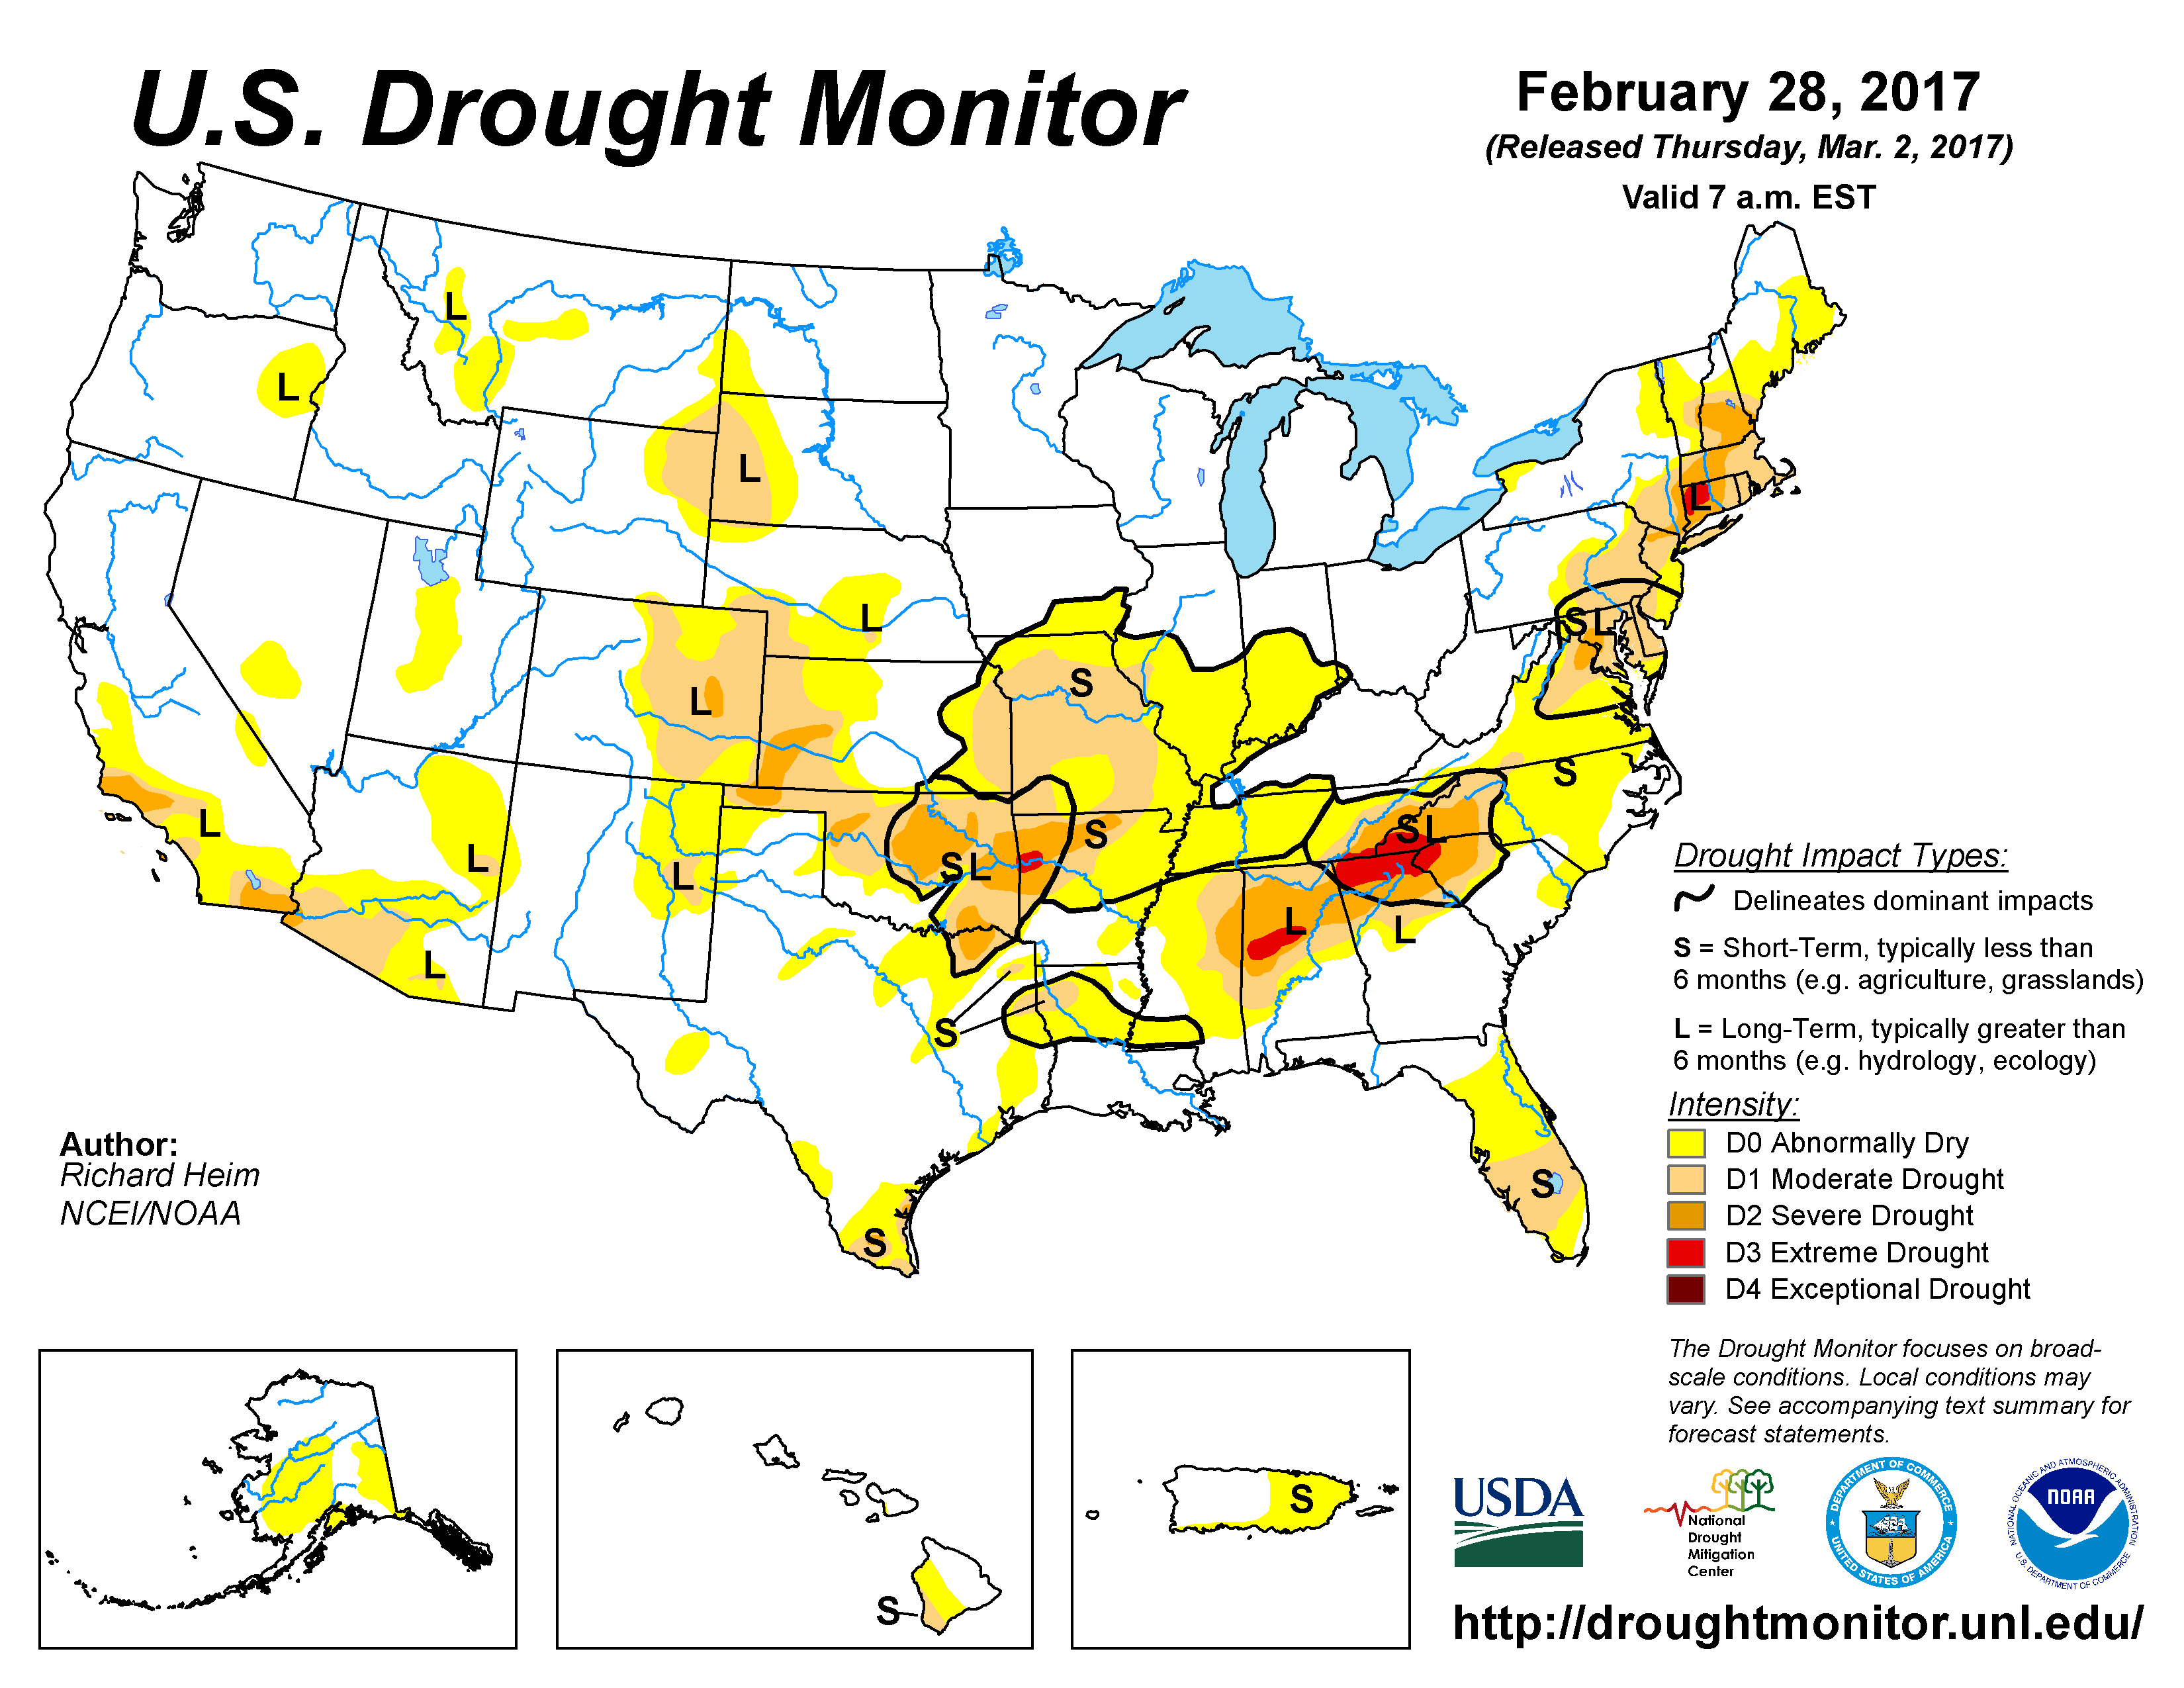
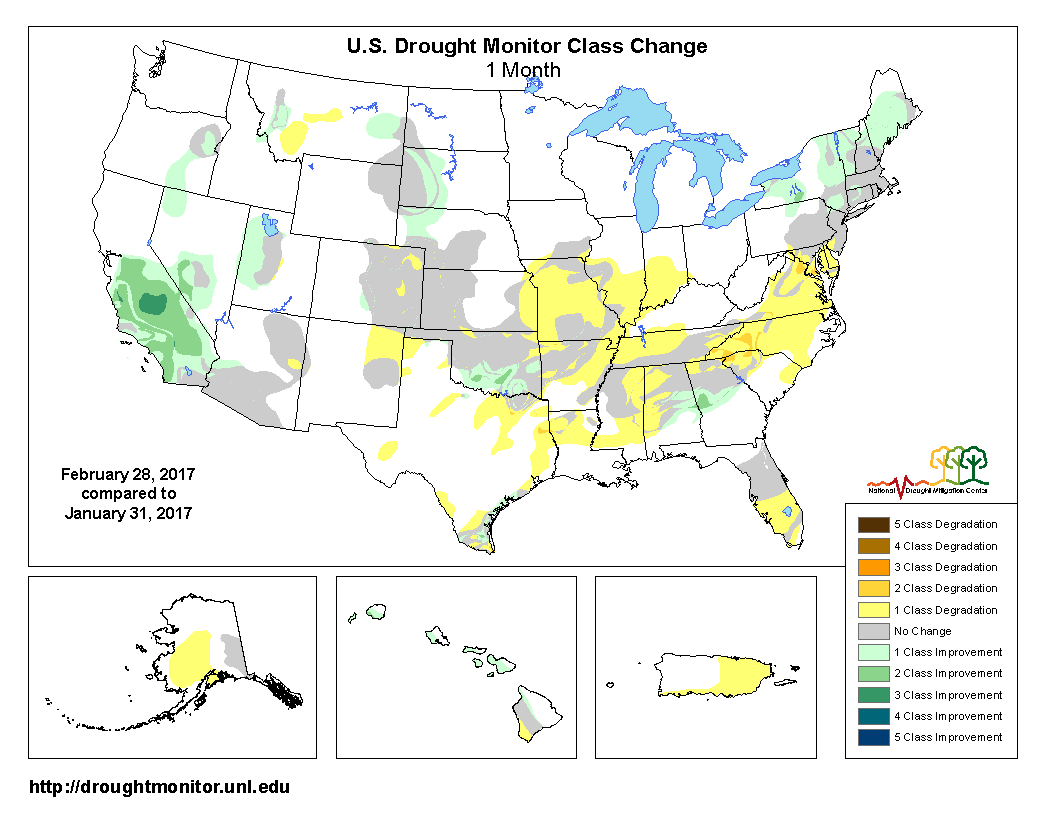
The U.S. Drought Monitor drought map valid February 28, 2017.
During February 2017, the weather over the CONUS was dominated by a strong westerly circulation which sent many fronts and low pressure systems across the country. The weather systems funneled Pacific moisture into the West where above-normal precipitation further contracted drought and abnormal dryness. They tapped Gulf of Mexico moisture to drop above-normal precipitation over parts of the Southern Plains, but upper-level ridging reduced the effectiveness of the troughs and fronts as they moved east of the Rockies and kept precipitation below normal in many areas in the central and eastern CONUS. Above-normal precipitation contracted drought and abnormal dryness in the Northeast. But, with below-normal precipitation and enhanced evapotranspiration associated with the above-normal temperatures, drought and abnormal dryness expanded from the Mid-Mississippi Valley to Mid-Atlantic Coast. Alaska was drier than normal in the west and south, where abnormal dryness expand, and wetter than normal in the northeast. In Hawaii, February was drier than normal in the southern islands to wetter than normal in the northern islands; drought and abnormal dryness contracted in the wet areas and drought expanded over the Big Island. Puerto Rico was drier than normal except in the northwest where it was wetter than normal for the month; abnormal dryness expanded in the south and east. With drought expanding in some areas and contracting in others, the USDM-based national moderate-to-exceptional drought footprint decreased only slightly across the CONUS from 14.6 percent at the end of January to 14.1 percent at the end of February (from 12.2 percent to 11.8 percent for all of the U.S.). According to the Palmer Drought Index, which goes back to the beginning of the 20th century, about 12.4 percent of the CONUS was in moderate to extreme drought at the end of February, an increase from last month's 6.8 percent.

Drought conditions at the end of the month, as depicted on the February 28th, 2017 USDM map, included the following CONUS core drought and abnormally dry areas:
- Pockets of abnormally dry (D0) to severe (D2) drought conditions lingered in parts of the western U.S., mainly southern California to Arizona and the High Plains of New Mexico to Wyoming;
- Abnormally dry to severe drought conditions continued in the Northern Plains and moderate (D1) to extreme (D2) drought continued in parts of the Southern Plains to Lower Mississippi Valley;
- Abnormally dry to extreme drought conditions continued in parts of the Northeast;
- Abnormally dry to moderate drought conditions expanded in parts of the Midwest; and
- Abnormal dryness and moderate to extreme drought expanded in the Southeast.
Palmer Drought Index
The Palmer drought indices measure the balance between moisture demand (evapotranspiration driven by temperature) and moisture supply (precipitation). The Palmer Z Index depicts moisture conditions for the current month, while the Palmer Hydrological Drought Index (PHDI) and Palmer Drought Severity Index (PDSI) depict the current month's cumulative moisture conditions integrated over the last several months. While both the PDSI and PHDI indices show long-term moisture conditions, the PDSI depicts meteorological drought while the PHDI depicts hydrological drought. The PDSI map shows less severe and extensive drought in parts of the northeastern and southeastern U.S. than the PHDI map because the meteorological conditions that produce drought and wet spell conditions are not as long-lasting as the hydrological impacts.
|
 |
Used together, the Palmer Z Index and PHDI maps show that short-term dry conditions occurred across parts of the Central Plains, most of the Lower to Mid-Mississippi Valley and Ohio Valley, all of the Southeast to Mid-Atlantic states, and parts of southern New England. This short-term dryness intensified the existing long-term drought conditions in the Southeast; expanded drought conditions in parts of the Plains, Lower to Mid-Mississippi Valley, and Mid-Atlantic states; and reduced long-term wet conditions in the Ohio Valley and parts of the coastal Southeast and Mid-Atlantic states (PHDI map for January vs. February). Short-term wet conditions intensified long-term wet conditions in parts of the West and Upper Mississippi Valley.
Standardized Precipitation Index
The Standardized Precipitation Index (SPI) measures moisture supply. The SPI maps here show the spatial extent of anomalously wet and dry areas at time scales ranging from 1 month to 24 months.
 |
 |
 |

The SPI maps illustrate how moisture conditions have varied considerably through time and space over the last two years. Southern New England to southeast Pennsylvania was dry at the 1-3 month time scales, but dryness covers more of this region at the 6-24 month time scales. The Mid-Atlantic region was dry at the 1-3 month time scales, but wet conditions dominate along the coast at 6-24 months. Severe dryness covered the entire Southeast to Lower Mississippi Valley on the 1-month map, but the dryness in the Southeast is concentrated more along the southern Appalachians (the western Carolinas to northern Alabama) at the 2- to 12-month time scales. Parts of Florida are dry at all time scales. The 1-month map shows widespread dryness across the Mid-Mississippi to Ohio Valleys. The dryness is concentrated along the Mid-Mississippi Valley at 2-3 months, then spreads all along the Mid- to Lower Mississippi Valley at 6 months. Parts of the Central to Northern Plains are dry at the 1-month, 6-month, and 9-month time scales. Otherwise, near-normal to wet conditions dominate. Of particular note are the wet conditions in the West and Great Lakes at all time scales.
 |
 |
 |
Standardized Precipitation Evapotranspiration Index
The SPI measures water supply (precipitation), while the SPEI (Standardized Precipitation Evapotranspiration Index) measures the combination of water supply (precipitation) and water demand (evapotranspiration as computed from temperature). Warmer temperatures tend to increase evapotranspiration, which generally makes droughts more intense.
 1-month SPEI for current month.
|
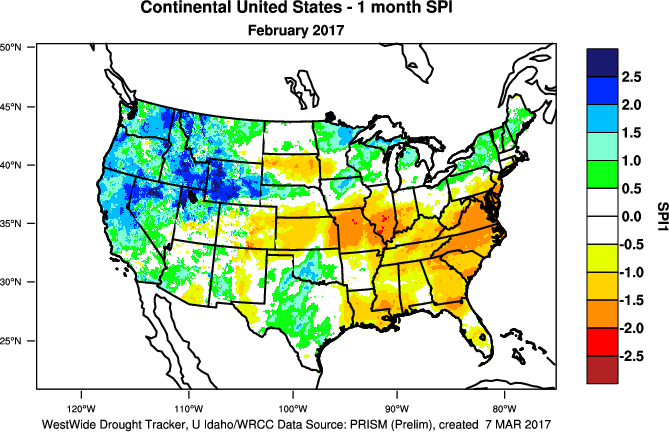 1-month SPI for current month.
|
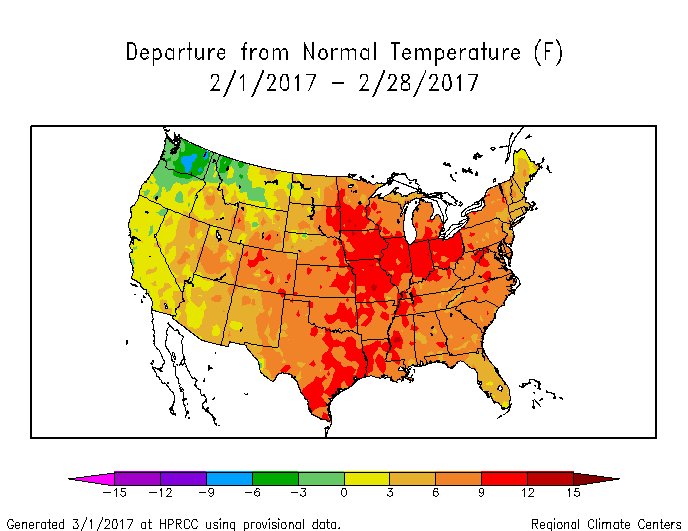
February 2017 temperatures were colder than normal in parts of the Pacific Northwest but warmer than normal across the rest of the country and significantly warmer than normal from the Plains to the East Coast. The above-normal temperatures increased evapotranspiration which exacerbated drought conditions in the areas that had below-normal precipitation. This is reflected on the SPEI and corresponding SPI maps for February (SPEI map vs. SPI map).
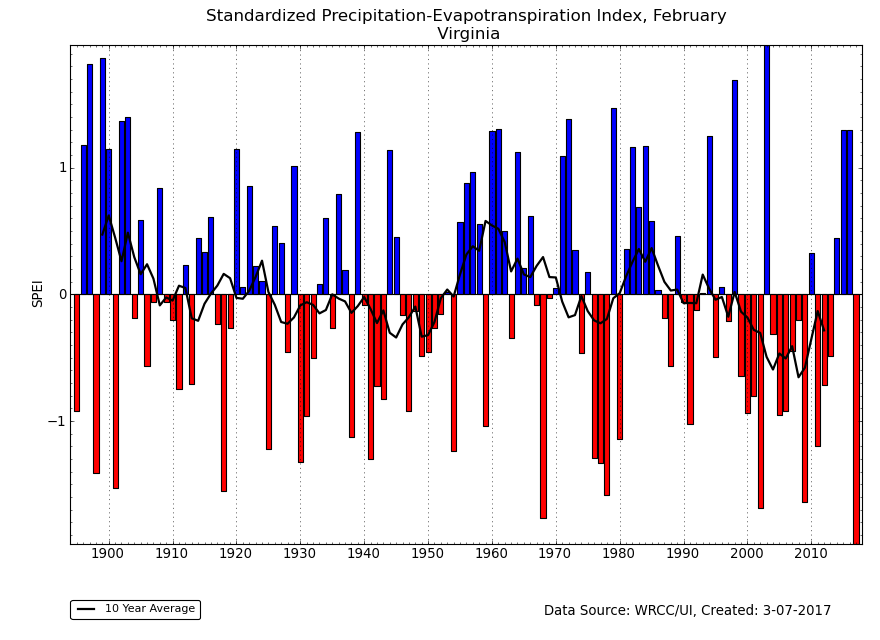
 1-month SPEI for Missouri, February, 1895-2017.
|
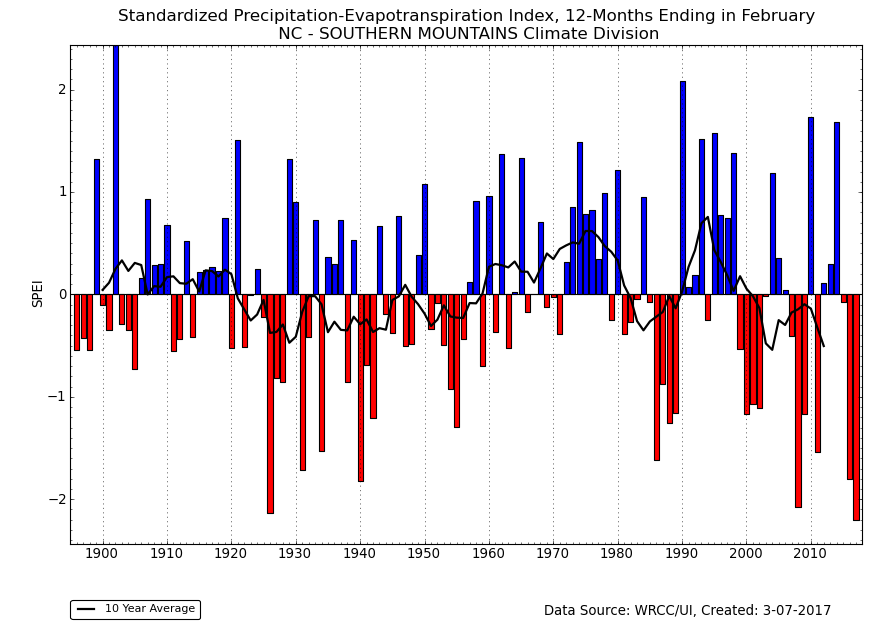
1-month SPEI for North Carolina, February, 1895-2017.
|
Record SPEI values were set on a statewide basis in February. Record-warm temperatures combined with the fourth driest February in the 1895-2017 record to give Virginia a record dry SPEI. Virginia's SPI was fifth driest. A record warm and fifth driest February gave North Carolina a record dry SPEI. A record warm and seventh driest February gave Missouri a record dry SPEI for February. Missouri's SPI was also fifth driest on record. A record warm and ninth driest February gave Illinois the second driest SPEI for February.
 12-month SPEI for current month.
|
 12-month SPI for current month.
|
The persistent record and near-record warmth over the last two, three, six, and 12 months kept evapotranspiration rates higher than normal, but above-normal precipitation in many areas over these periods kept SPEI values near the SPI values. This was especially true in the West where precipitation during October and December 2016 and January and February 2017 has made up for the precipitation deficits of the last 12 months. Significant deficits were still apparent in the Southeast and Northeast during the last 3 to 12 months on both maps, with the unusually warm and persistent temperatures over the last 12 months enhancing drought conditions (SPEI maps for last 3 and 12 months) (SPI maps for last 3 and 12 months).
 72-month SPEI for California, February, 1895-2017.
|
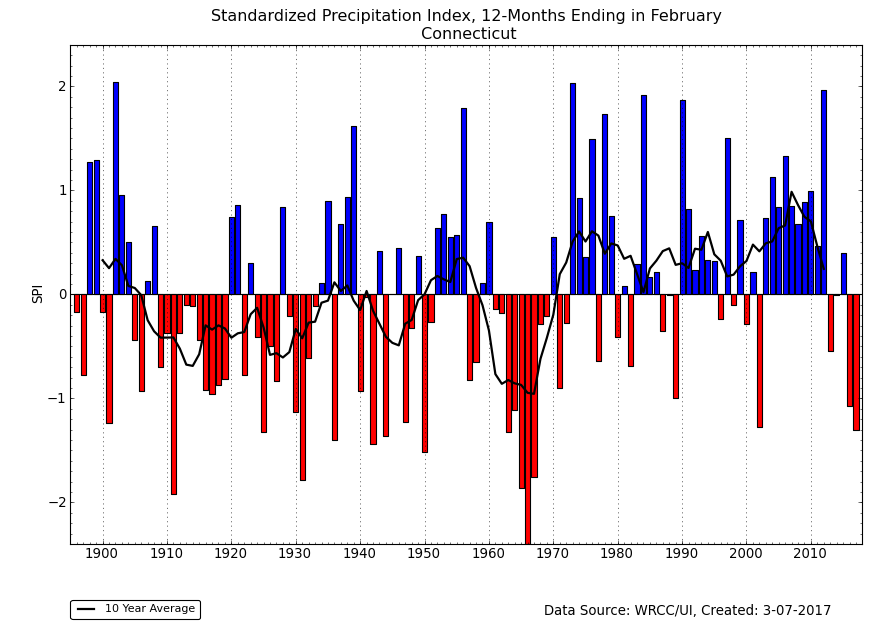
 24-month SPEI for Connecticut, February, 1895-2017.
|
The heavy precipitation of the last several months has given California the second wettest March-February 12-month period in the 1895-2017 record, and has dislodged the SPEI from record levels at all time scales. The February 2017 SPEI for California is near zero for the last 36 months, 21st driest at the 60-month time scale, and only 17th driest at the 72-month time scale.
On the other hand, continued dryness in southern New England has intensified or at least prolonged drought. The last five years (last five March-February 12-month periods) in Connecticut have been drier to much drier than average and accompanied by record to near-record warm temperatures. This combination resulted in the state having the third driest 24-month SPEI and fifth driest 12-month SPEI for February 2017. The 24-month SPI tied for seventh driest and 12-month SPI was 12th driest.
 |
 |
 |
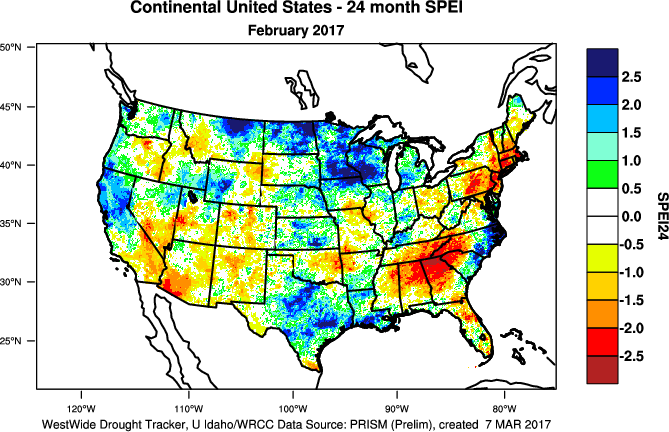
Significant differences between the SPEI and SPI maps still appear in the West beginning at the 24-month time frame (SPEI vs. SPI) and become increasingly significant at the 36-month (SPEI vs. SPI), 48-month (SPEI vs. SPI), 60-month (SPEI vs. SPI), and even 72-month (SPEI vs. SPI) time scales. At the 60- and 72-month time scales, deficits are evident in the Southern Plains, suggesting a basis for concern that deep soil moisture/groundwater reserves have not been replenished from earlier (e.g., 2011-2012) droughts, and that this sets the stage for rapid onset of drought impacts when dry conditions return there. Significant differences are also evident in the Northeast and Southeast at the 24-month time scale.
Regional Discussion
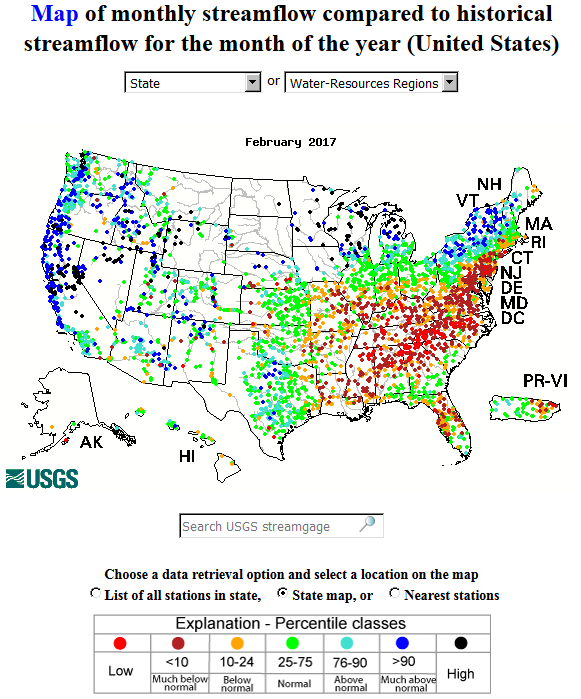 USGS streamflow percentiles
|
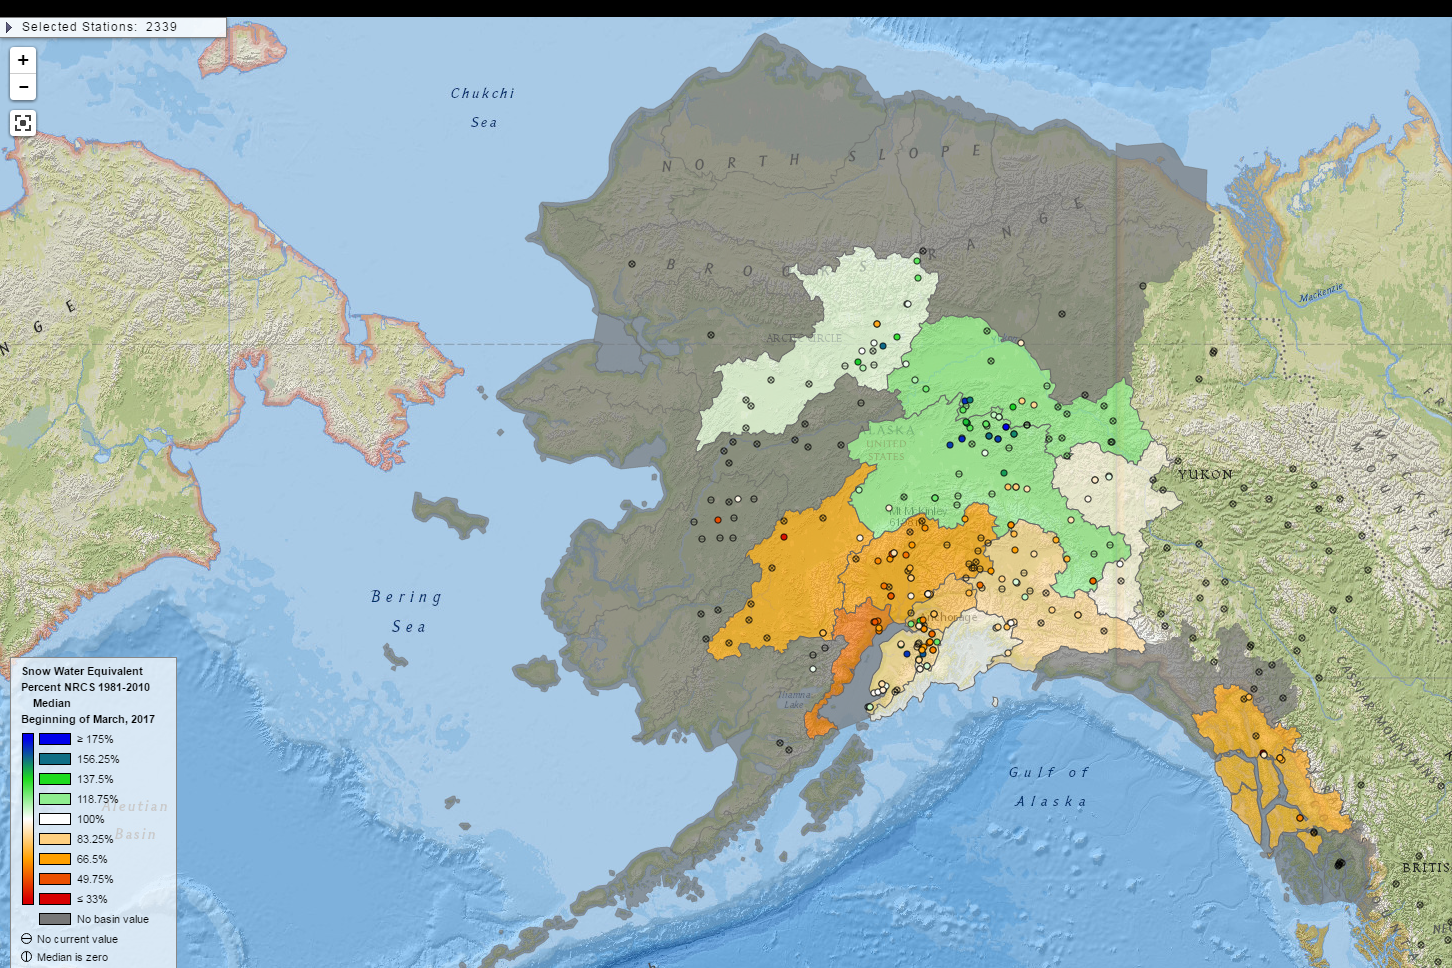
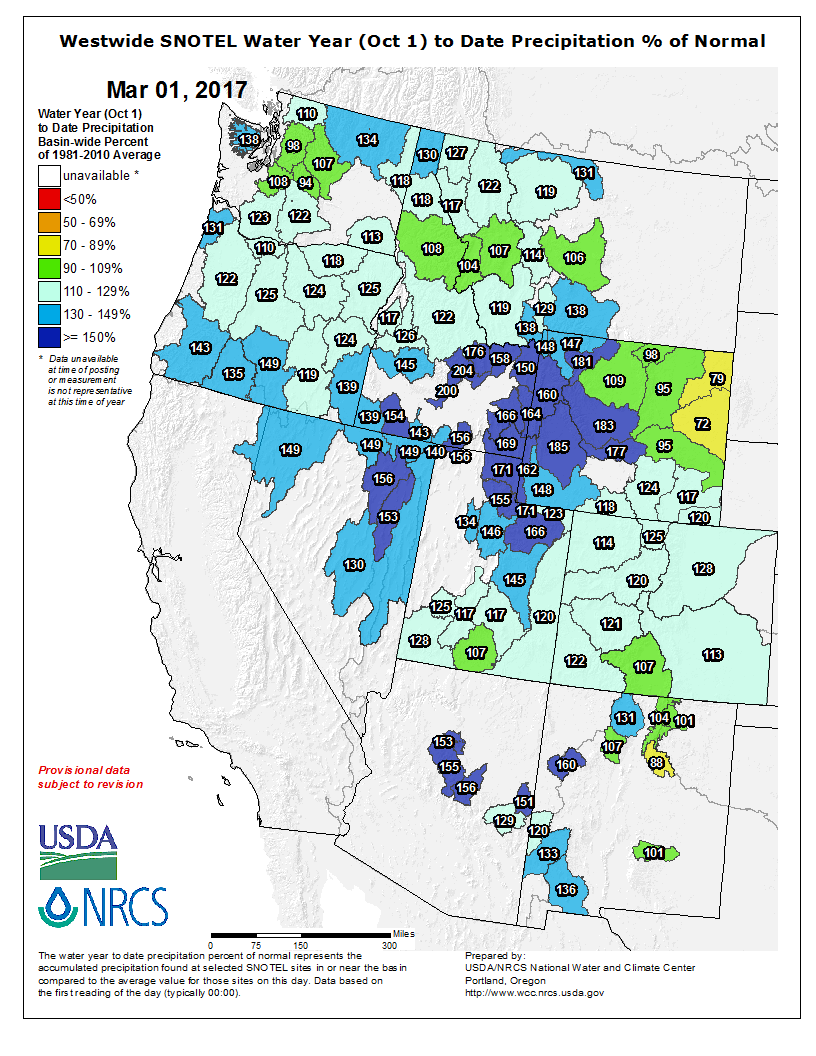
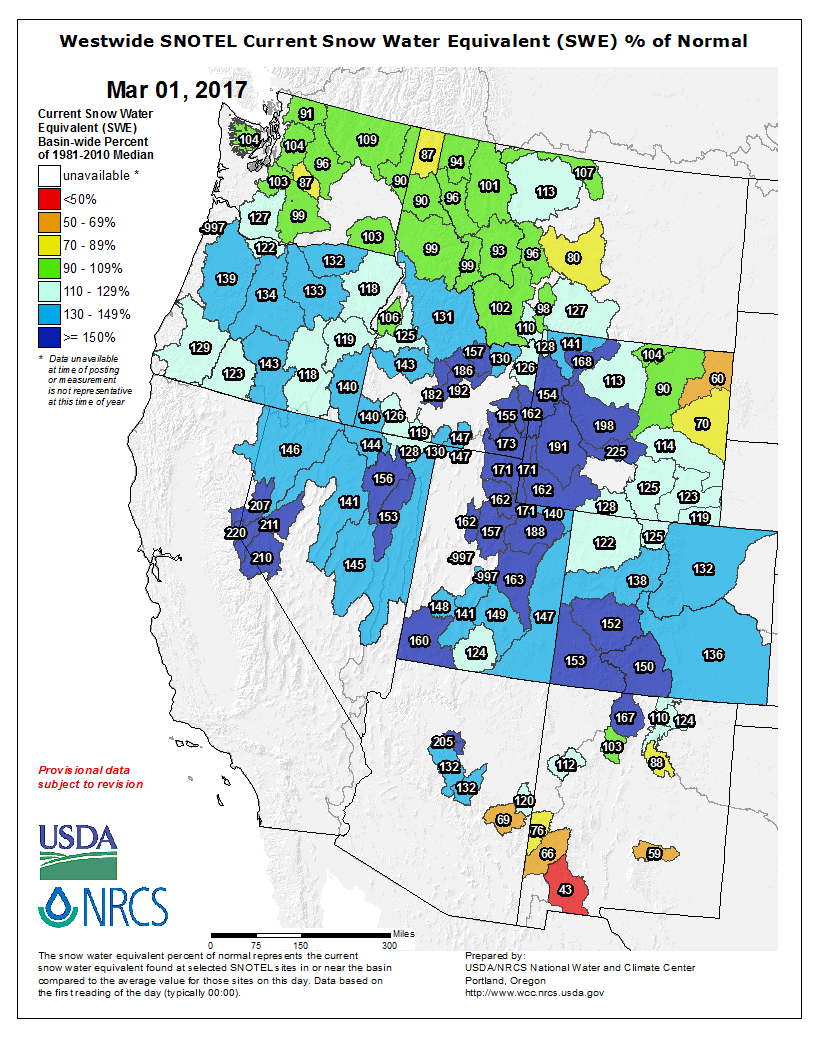
 USDA NRCS mountain snowpack
|
 USDA NRCS reservoir percentiles
|
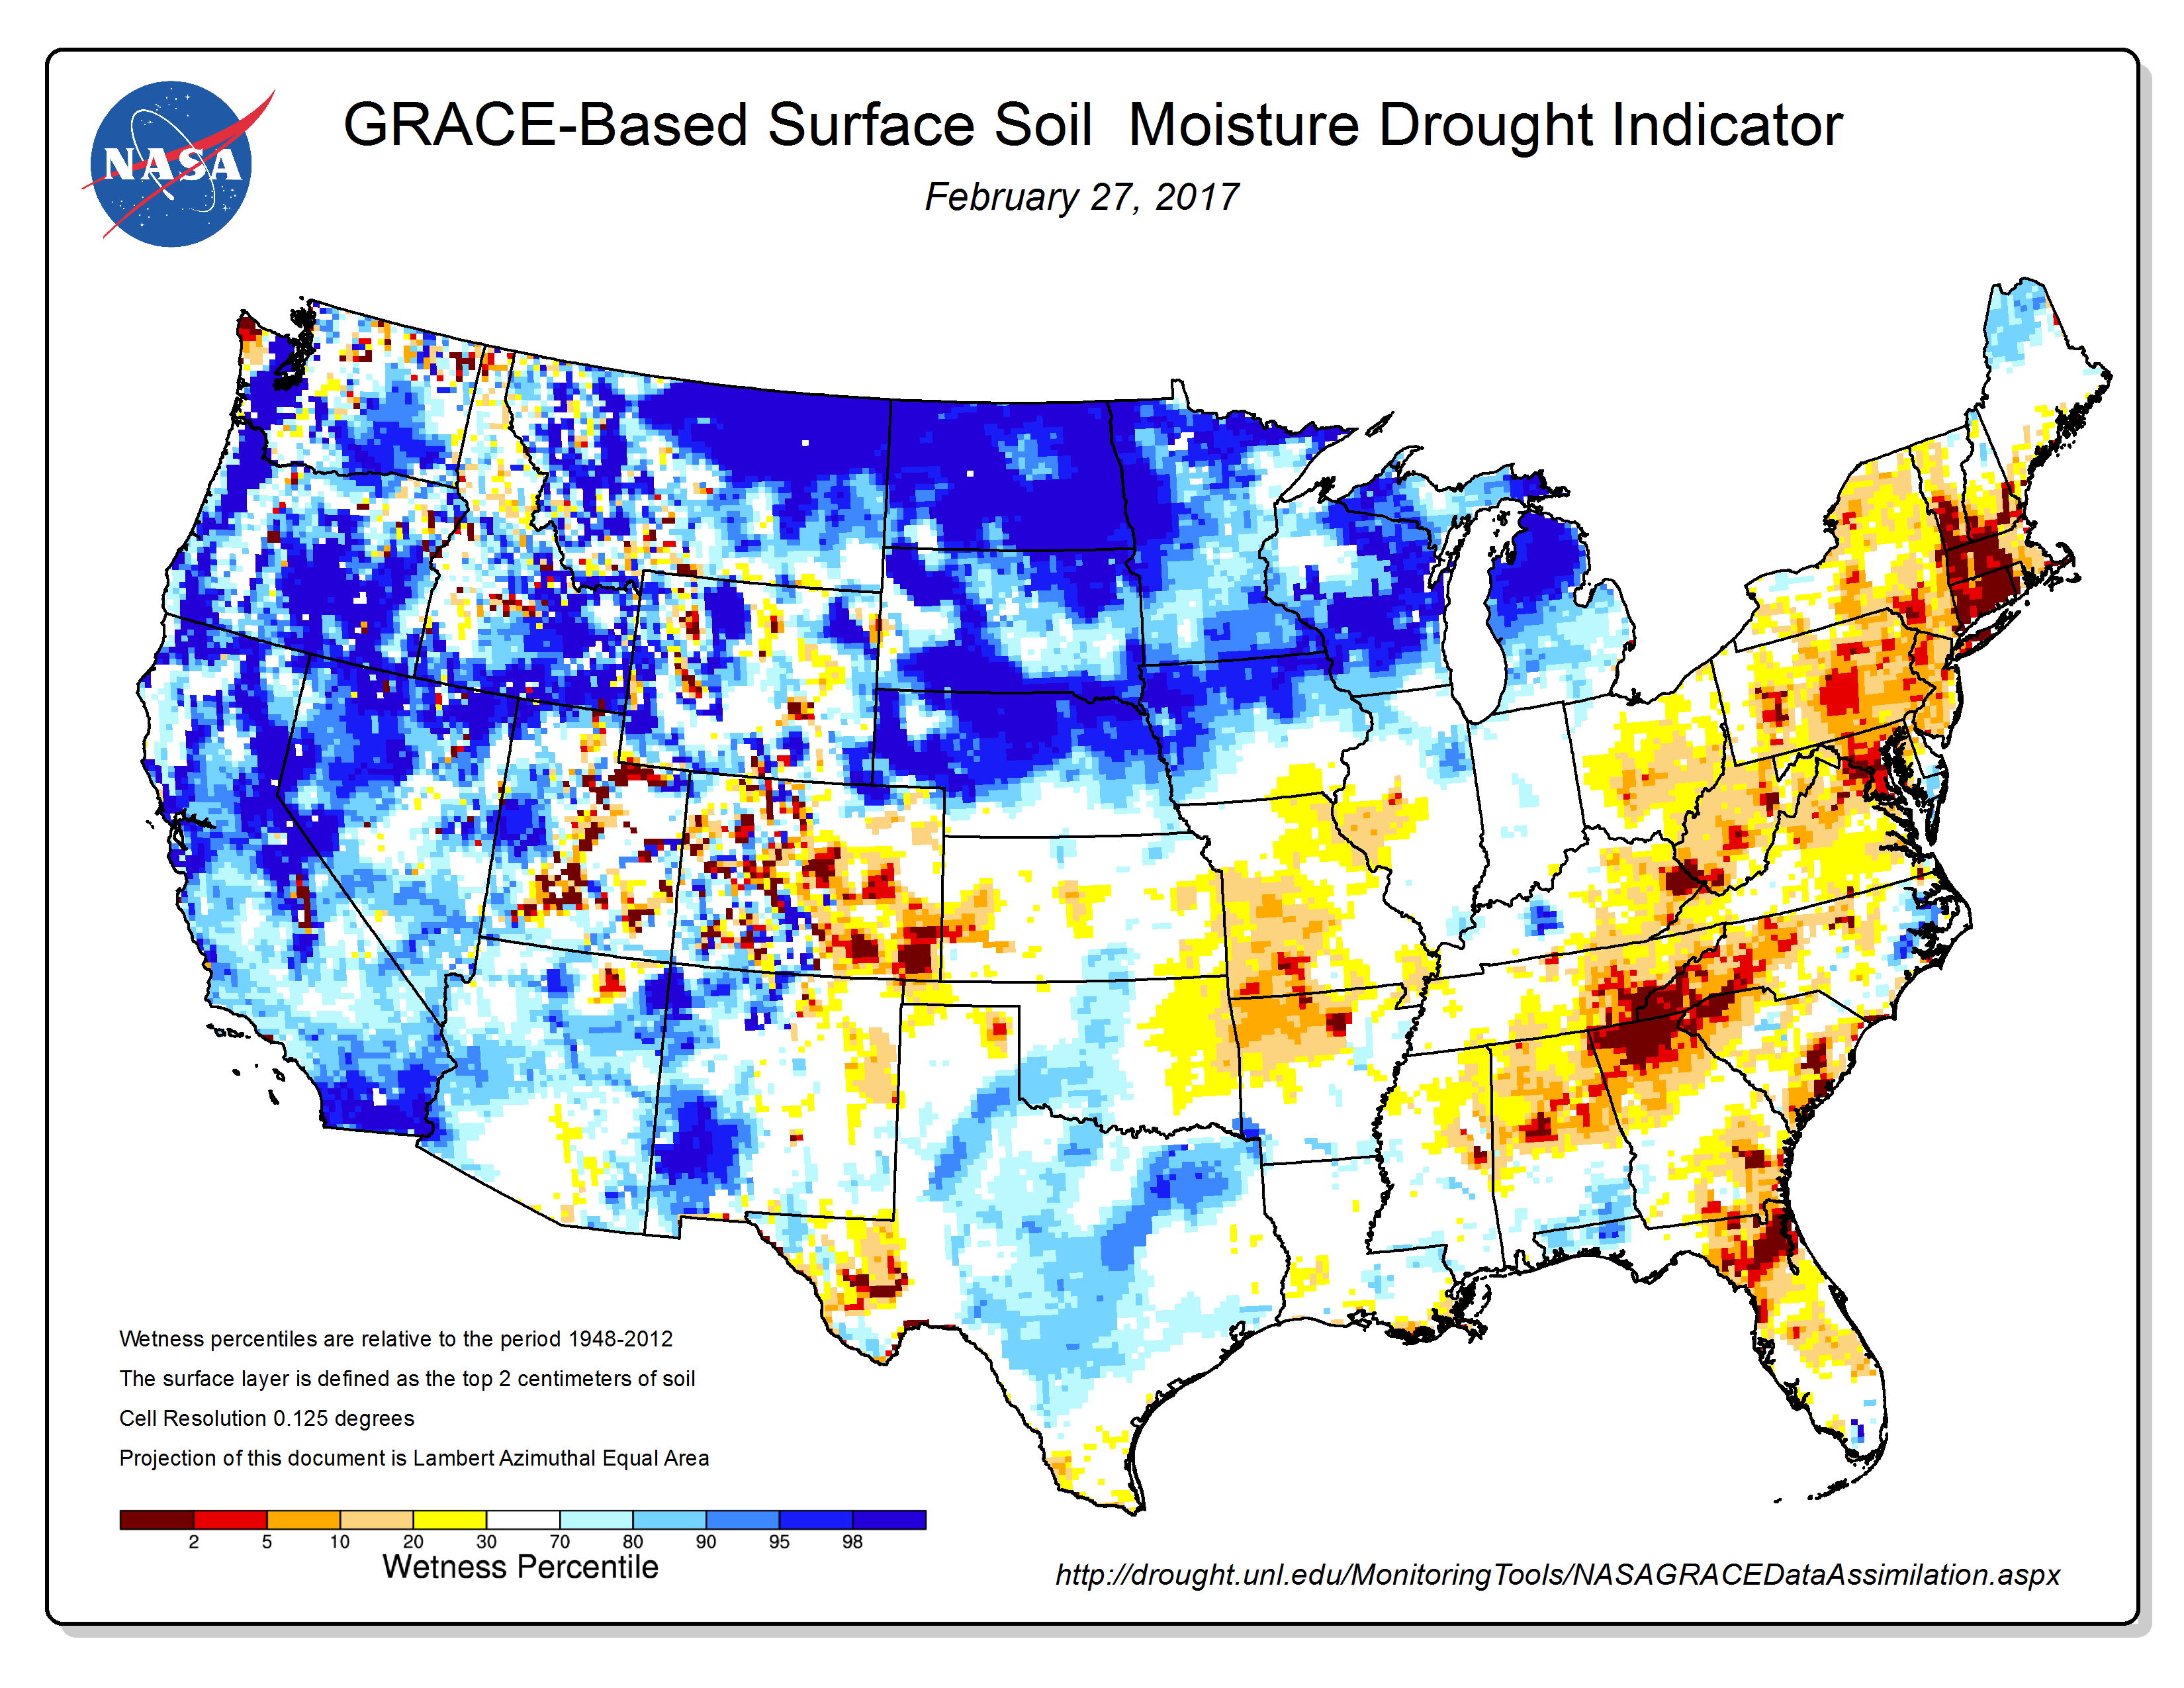
 NLDAS soil moisture percentiles
|
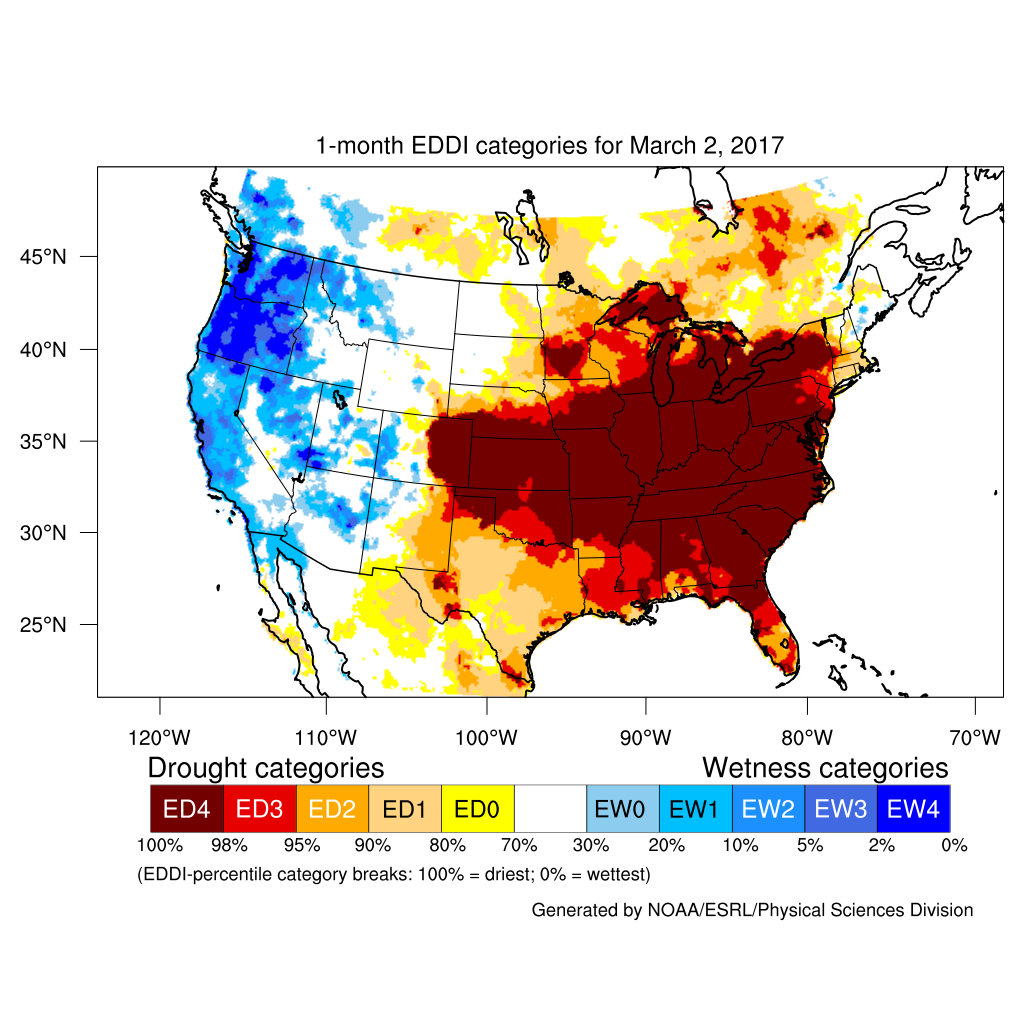 Evaporative Drought Demand Index (EDDI)
|
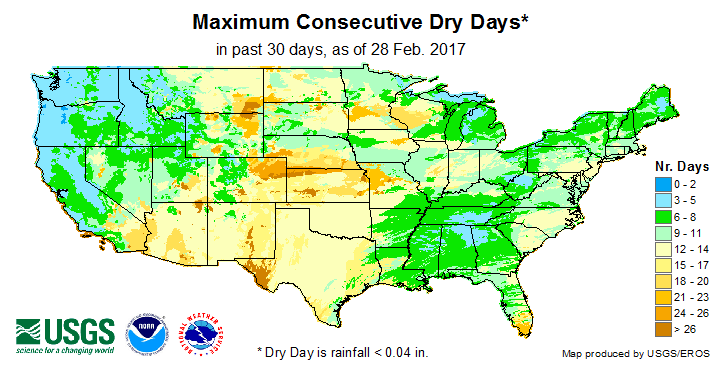 USGS maximum consecutive dry days
|
CONUS Agricultural & Hydrological Impacts:
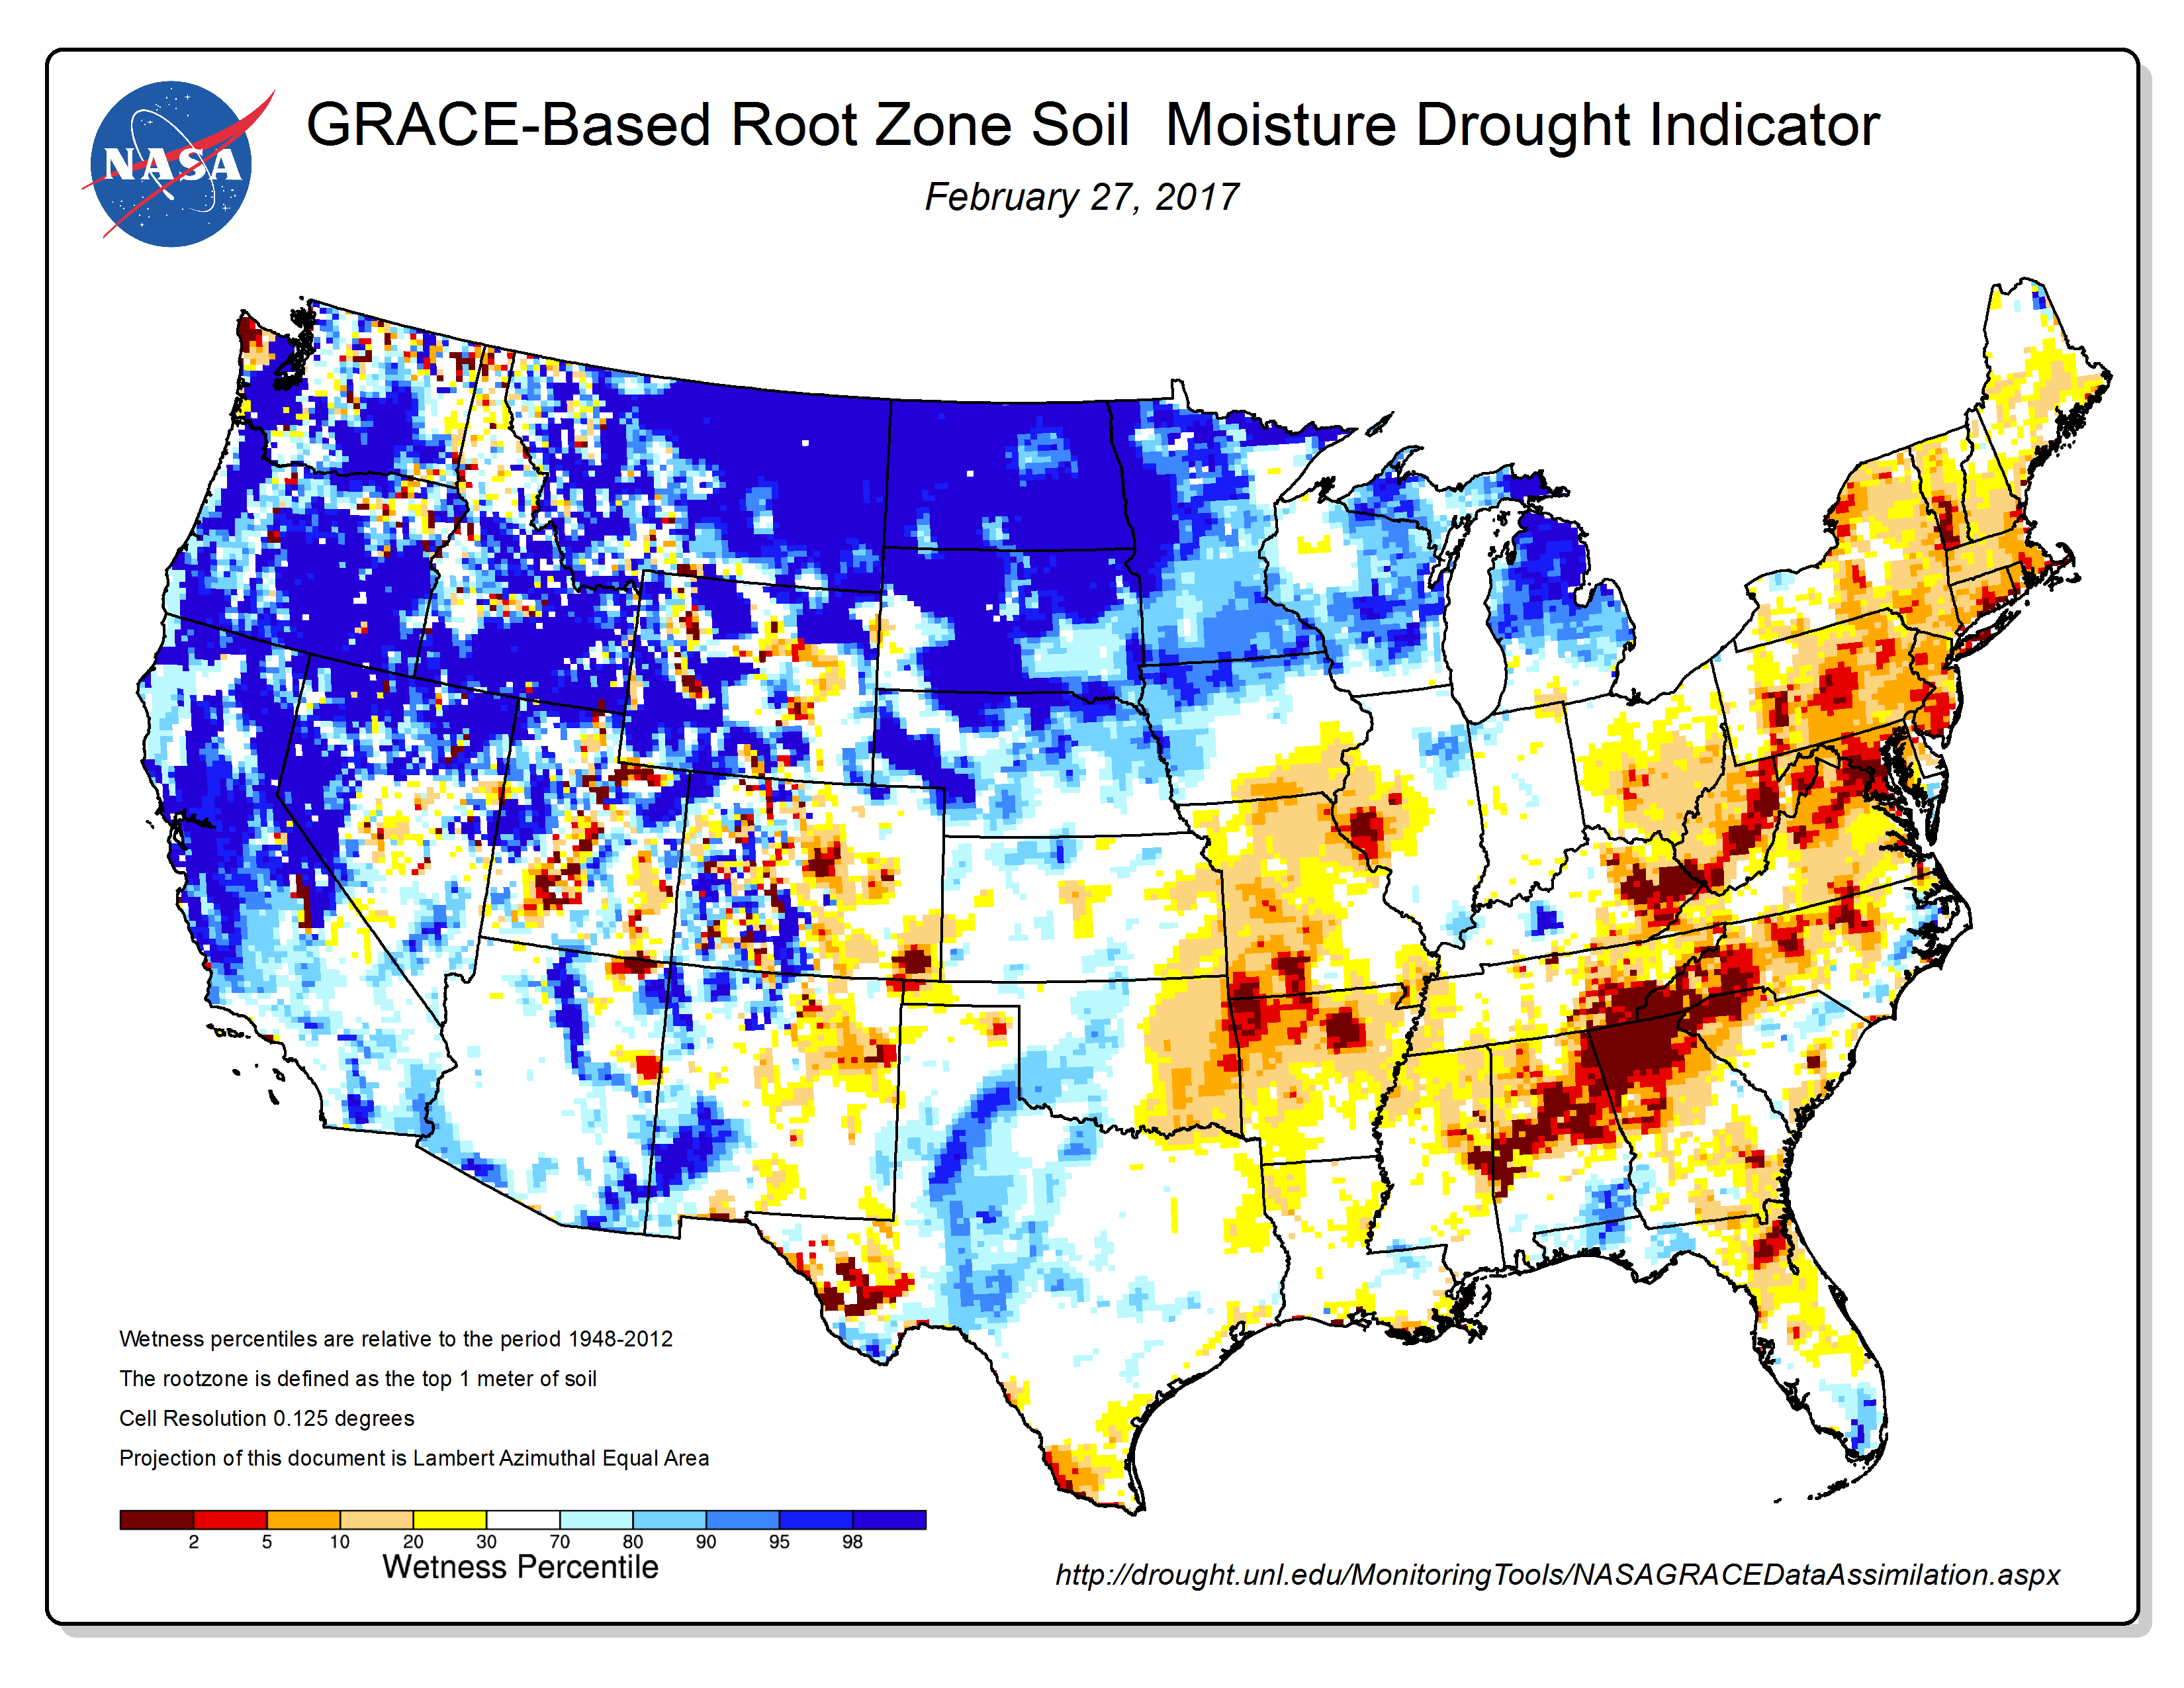
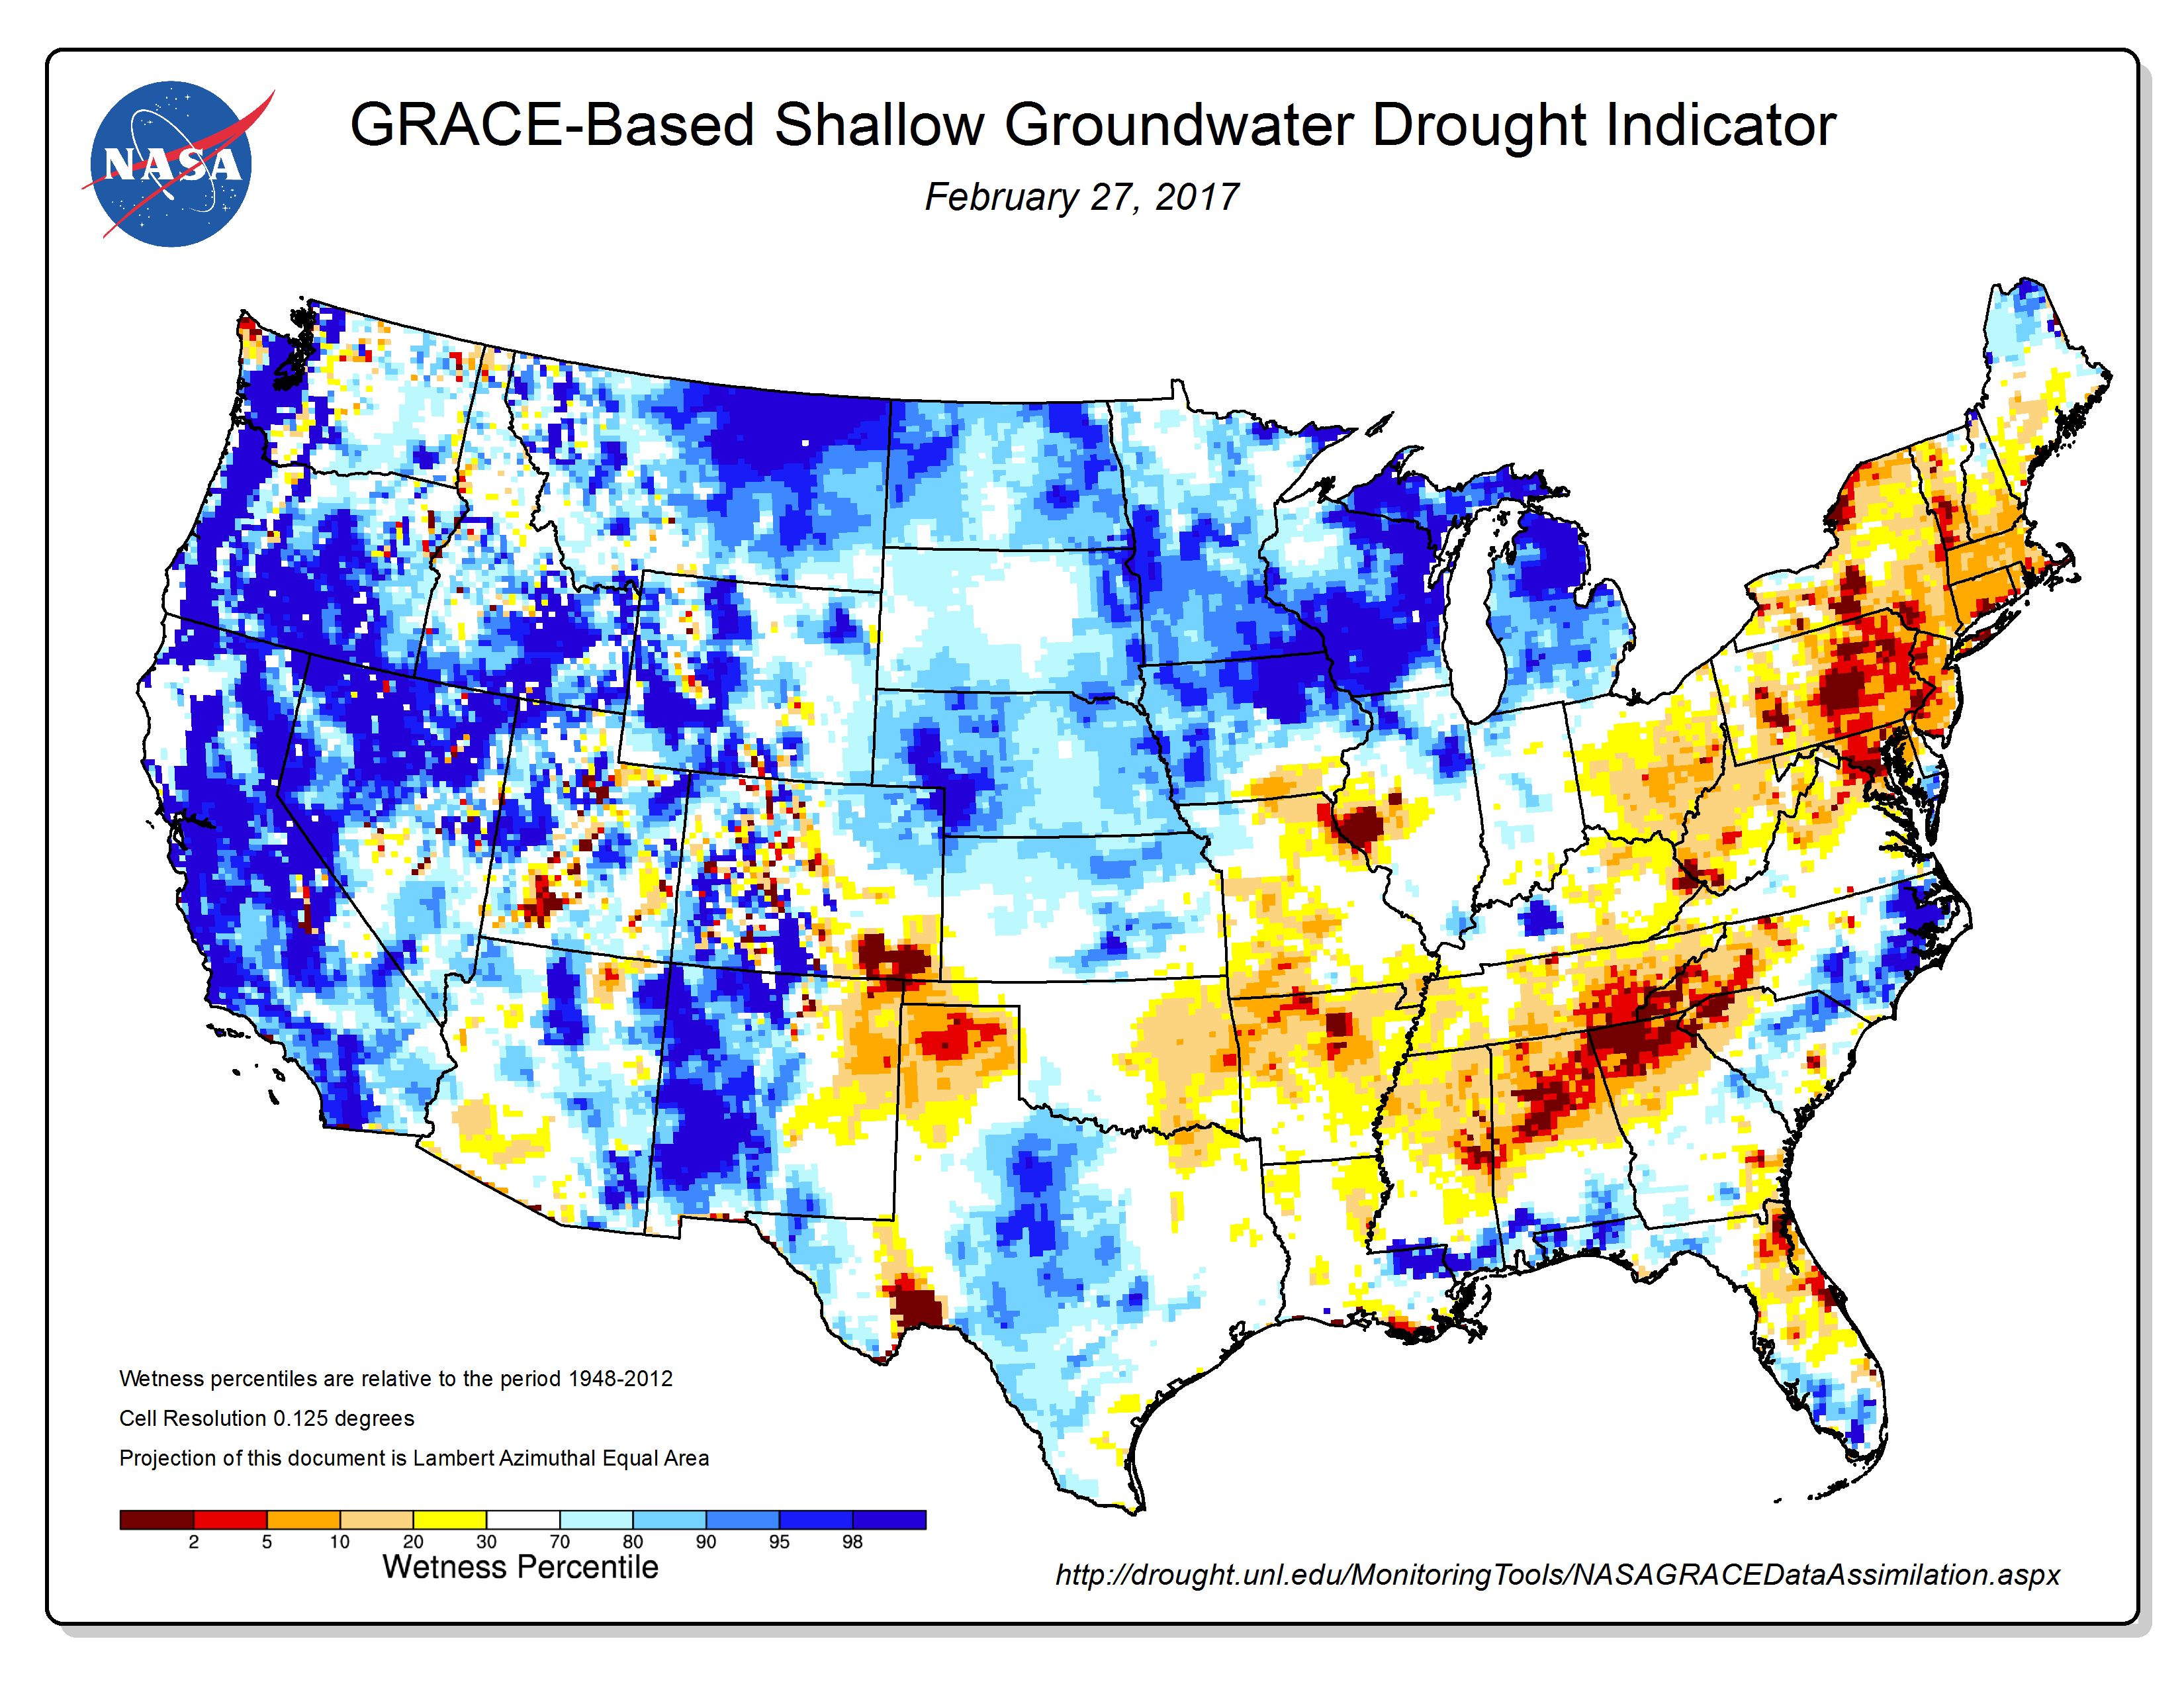
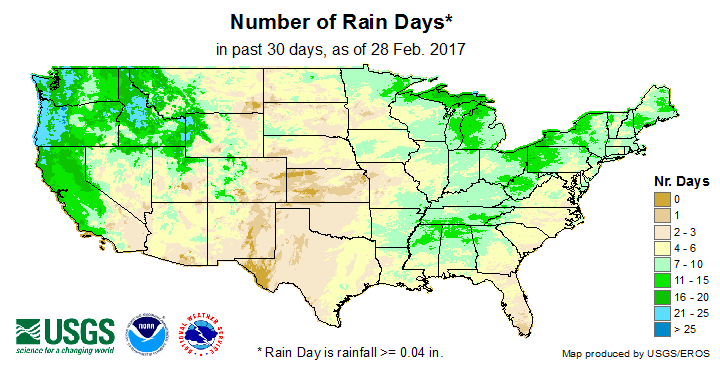
Drought conditions at the end of February 2017 were reflected in a number of meteorological, hydrological, and agricultural indicators, both observed and modeled. These include: evapotranspiration (EDDI, ESI) and soil moisture (USDA observations, SMOS satellite-based model, Leaky Bucket model, CPC model, NLDAS model topsoil and total column, VIC model, NASA GRACE surface and root zone soil moisture). The widespread above-normal precipitation during February continued to improve conditions in the West, including soil moisture, mountain snowpack, and reservoir levels. But where the dry conditions have lasted for several months, hydrological conditions such as streamflow and groundwater supplies (USGS observations, NASA GRACE estimates) were reduced, especially in the Southeast and Northeast. The dry conditions during February in parts of the Plains are reflected in number of rain days and maximum consecutive number of dry days as well as total precipitation. On a national scale, as of February 28th, 2017, 19 percent of the nation's cattle inventory, 20 percent of the nation's hay, 22 percent of winter wheat production, eight percent of corn production, and seven percent of soybean production were in drought. These percentages are at or above the values for the end of January. As noted by the U.S. Department of Agriculture (USDA), the persistence of the unseasonably warm weather east of the Rockies has ushered winter wheat out of dormancy up to a month ahead of normal. The warm temperatures and unusually early green up have increased evapotranspiration and heightened the need for soil moisture in areas wrestling with winter-time drought, at a time when crop-water demands are typically minimal. Already, this early in the season, 27 percent of the winter wheat in Colorado and 21 percent of the winter wheat in Kansas was rated in poor to very poor condition. The pasture and range land poor to very poor percentages were 44 percent in Virginia, 37 percent in Oklahoma, 36 percent in Wyoming, 35 percent in Florida, 33 percent in Tennessee, 30 percent in Colorado, and 24 percent in North Carolina.
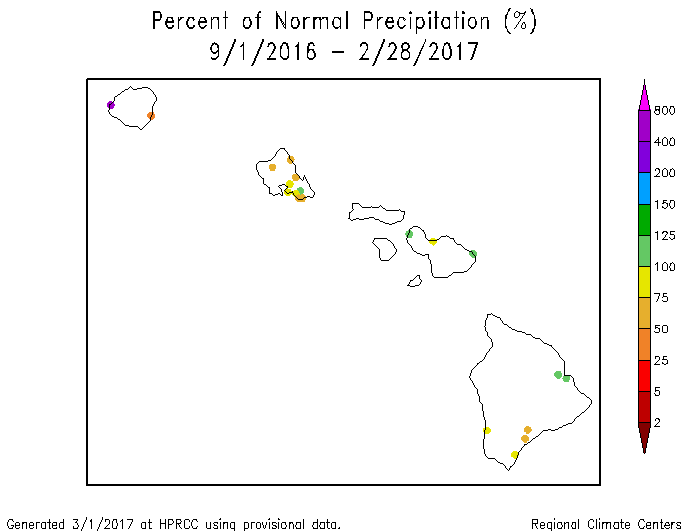
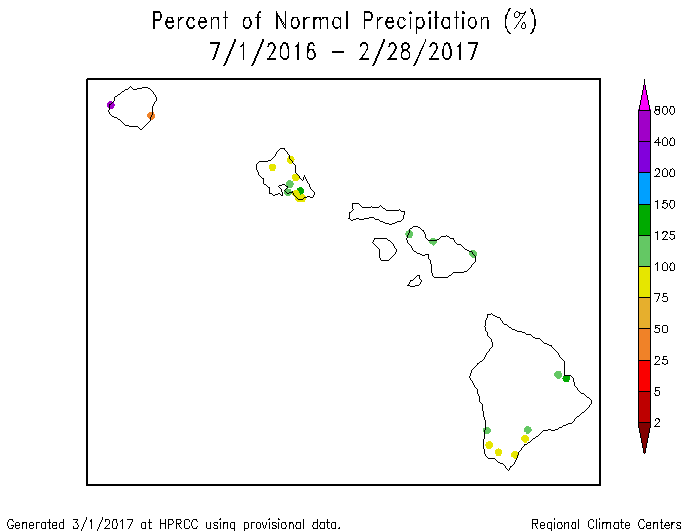
Hawaii: February 2017 was drier than normal in the southern islands to wetter than normal in the northern islands of Hawaii. Drier-than-normal conditions dominate for the last 2, 3, 5, and 6 months, but a mixed precipitation anomaly pattern is evident at the longer time scales (last 8, 11, 12, 24, and 36 months). Abnormally dry conditions shrank during February, covering about a fourth of the state on the February 28th, 2017 USDM map, but drought expanded to about seven percent.
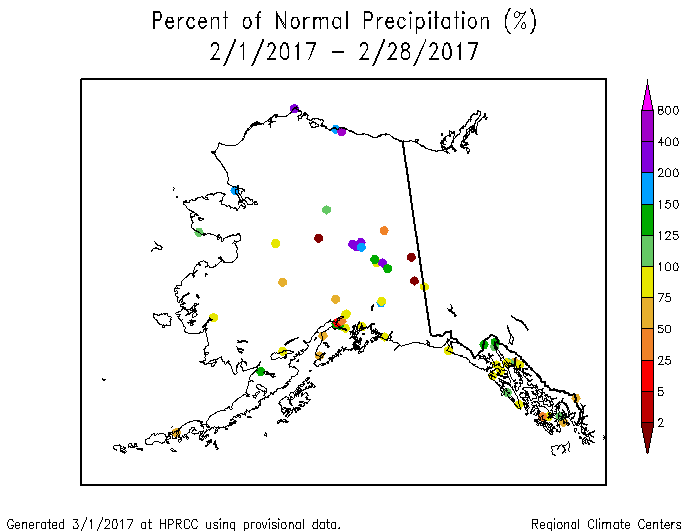
Alaska gridded percent of normal precipitation map for the current month.
Alaska: February was drier than normal in the west and south, and wetter than normal in the northeastern portions of Alaska (as seen on the climate division, gridded, low elevation station, and high elevation station SNOTEL maps). A similar pattern is evident for the last two (climate division, gridded, low elevation station maps) to three (climate division, gridded, low elevation station maps) months. Most of the state is drier than normal for the water year to date (last five months, October-February) (low elevation station and SNOTEL high elevation station and basinwide maps) and a similar pattern is evident for the last six months (climate division, gridded, low elevation station maps). An increasingly wetter to mixed pattern of anomalies can be seen at the longer time scales on the climate division and station maps (last 8, 11, 12, 24, and 36 months). February was warmer than normal in the northeast and cooler than normal in the southwest (climate division, gridded, low elevation station maps). A similar temperature anomaly pattern can be seen at 2 (climate division, gridded, low elevation station maps) and 3 (climate division, gridded, low elevation station maps) months, although the warm anomalies have expanded. Warmer-than-normal temperatures dominate at the 5-, 6- (climate division, gridded maps), and 12-month (climate division, low elevation station maps) time scales. Mountain snowpack and snow water content were below normal at most stations and basins. About a third of the state was abnormally dry on the February 28th USDM map.
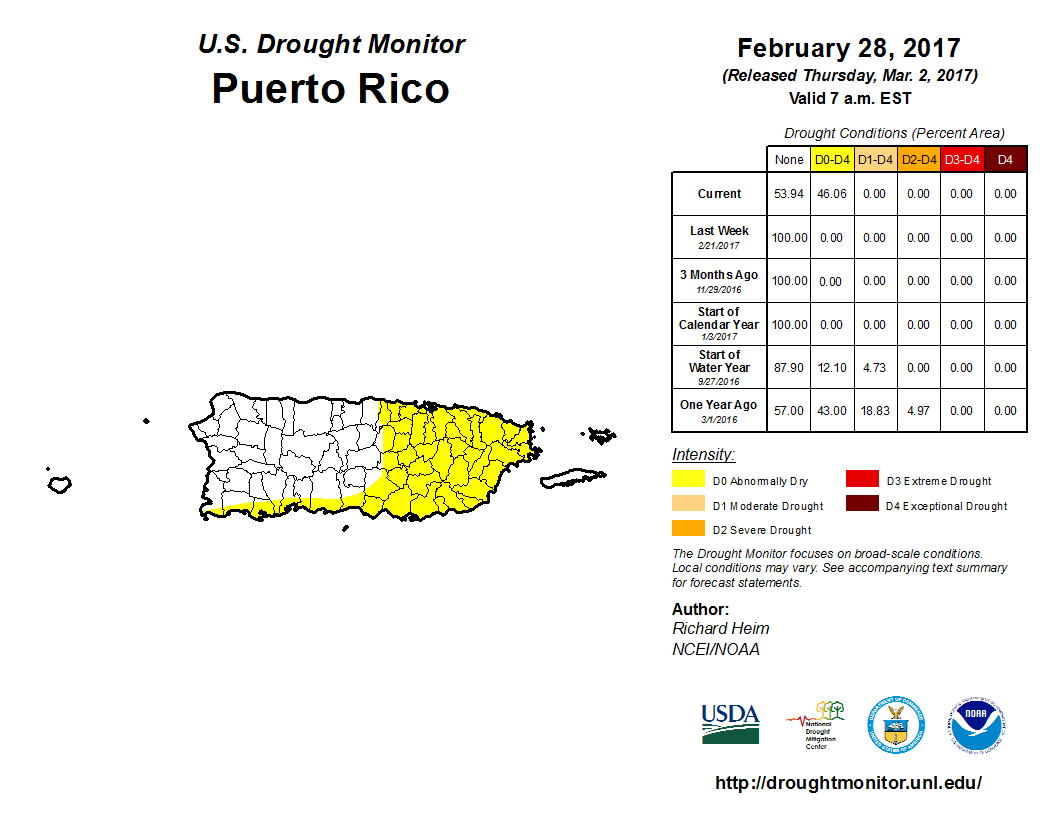
Puerto Rico: Puerto Rico was drier than normal during February except in the northwest where it was wetter than normal for the month. A similar pattern was evident for the last two to three months. Wet conditions dominate at the 5- to 6-month time scales. Soils were dry along the southern coast and becoming drier in the interior, and streamflow was below normal in the northeast. Abnormal dryness had spread to a little less than half of Puerto Rico on the February 28th, 2017 USDM map.
CONUS State Precipitation Ranks:
|

|
February 2017 was drier than normal across the Central Plains to Ohio Valley, Lower Mississippi Valley, Southeast to southern New England, and parts of the Northern Plains and Southwest. Twenty-two states ranked in the driest third of the 1895-2017 record, including seven which ranked in the top ten category. These included Virginia (fourth driest February), North Carolina (fifth driest), Missouri (seventh driest), South Carolina (eighth driest), Maryland (eighth driest), Illinois (ninth driest), and Delaware (ninth driest).
| January-February 2017 was drier than normal from the Mid-Mississippi Valley to Mid-Atlantic Coast and in a few other areas of the CONUS. Precipitation during January prevented any state in the CONUS from ranking in the top ten driest category for the month to date, although 12 ranked in their driest third of the historical record. |

|

|

|
The last three months were drier than normal along the Mid-Mississippi Valley and along the Mid-Atlantic Coast to southern New England, with a few other areas drier than normal. Ten states ranked in their driest third of the historical record for December-February, including Missouri which had the tenth driest winter.
|

|
September 2016-February 2017 was drier than normal from the Lower to Mid-Mississippi Valley eastward to the Appalachians and westward to the Plains of Texas and Oklahoma. Other parts of the Southeast, Northeast, and Central High Plains were drier than normal. Fourteen states ranked in their driest third of the historical record for September-February, including Arkansas which had the ninth driest such 6-month period.
 |

|
March 2016-February 2017 was drier than normal in the Southeast and Northeast plus scattered parts of the West and Southern Plains to Mid-Mississippi Valley. Thirteen states in the Southeast and Northeast ranked in their driest third of the historical record, including Connecticut which had the third driest March-February and Massachusetts which ranked ninth driest.

|
|
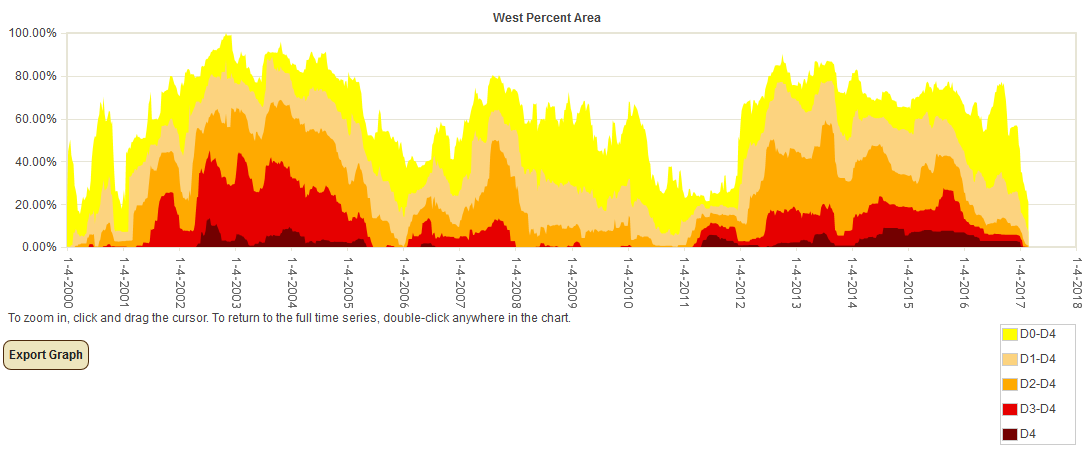
Percent area of the Western U.S. in moderate to extreme drought, January 1900 to present, based on the Palmer Drought Index.
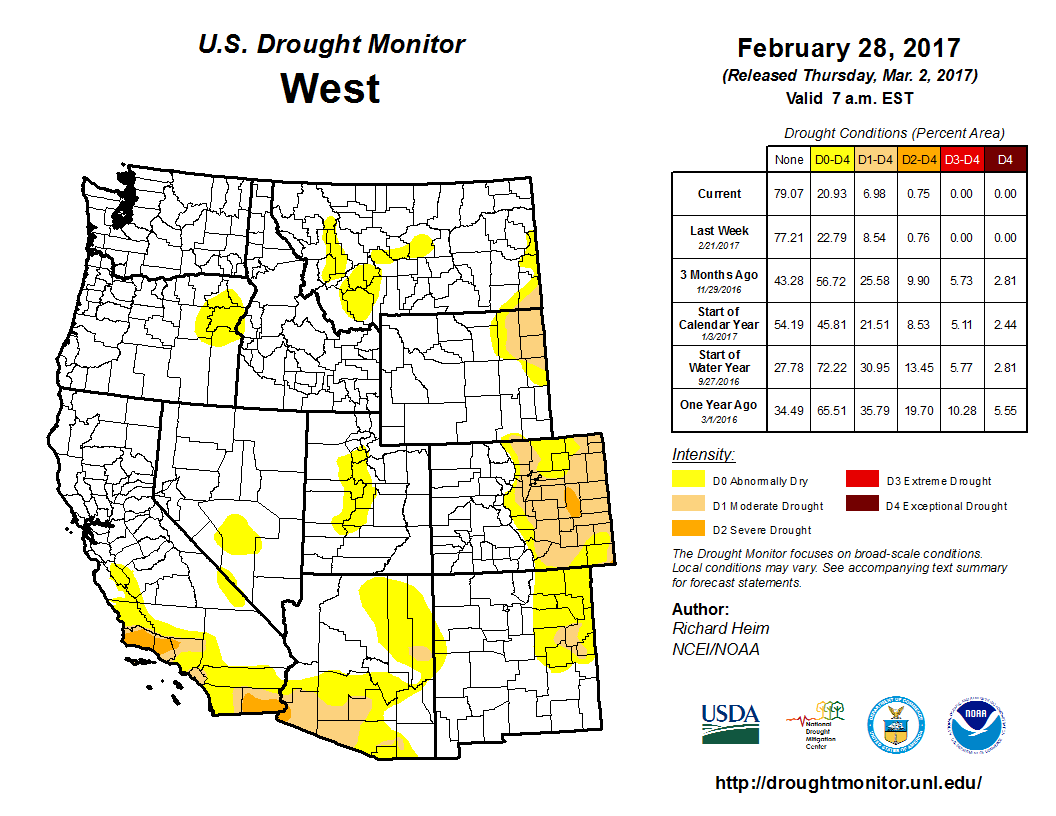
February 2017 continued the wetter-than-normal pattern across much of the West. The water year to date (October 1-February 28) has been wetter than normal for most of the West. The precipitation has increased streamflow, refilled reservoirs (especially in California), and increased mountain snowpack. The slow melting during spring of a thick winter snowpack provides an important water source for the West during the summer dry season.
The above-normal precipitation which has fallen in recent months across the West eliminated drought on the Palmer drought analysis. But there are still some hydrological concerns, especially some reservoirs in coastal southwest California which haven't recovered, as well as dryness in the Four Corners states and Wyoming. These are reflected on the USDM analysis which shows 7.0 percent of the West still experiencing moderate to severe drought at the end of February, compared to 13.4 percent at the end of January.
 Western North Carolina 24-Month SPEI, February, 1895-2017.
|
 Northern Georgia 24-Month SPEI, February, 1895-2017.
|
Much of the Southeast has experienced extremely dry and record warm conditions during the last 12 months. The core dry area has been from the Southern Appalachians to northeast Alabama, with western North Carolina to northern Georgia having the driest March-February on record and Upstate South Carolina the driest September-February. Based on the SPI, March 2015-February 2017 was the driest such 24-month period on record for western North Carolina.
|
 |
 |
|
Many individual weather stations in this region reported record dry conditions during the last 6 and 12 months as well as record heat (last 1, 6, and 12 months). The combination of heat and dryness resulted in the driest 12-month, 24-month, and 36-month SPEI in the 1895-2017 record for western North Carolina (12-, 24-, 36-month SPEI) and northern Georgia (12-, 24-, 36-month SPEI). |
 The PHDI rapidly reached extreme drought severity in western North Carolina (climate division 1), northern Georgia (climate divisions 1, 2, 3), and Upstate South Carolina (climate divisions 1, 2). The February 2017 PHDI in northeast Georgia (climate division 3) was second only to the record drought of 1925. |
|
|
 |
The extreme dryness was reflected in many other indicators, including record-dry streamflow, record-low groundwater and baseflow, and low soil moisture. According to February 26th USDA reports, 50 percent of the topsoil and 25 percent of the subsoil was short or very short of moisture (dry or very dry) in North Carolina, with the driest soil located in western North Carolina. The percentages for Florida were 51 percent (topsoil) and 48 percent (subsoil). With water supply systems still adequate, few water supply impacts were apparent in western North Carolina communities, and this is early in the growing season so widespread agricultural impacts were not widely reported. Nevertheless, according to February 26th USDA reports, a fourth or more of the pasture and rangeland was in poor to very poor condition in Florida (35%) and North Carolina (24%).

According to the February 28th USDM, about a third of the Southeast was experiencing moderate to extreme drought, with the most severe conditions stretching from the western Carolinas to northern Georgia and across parts of the northern half of Alabama.
|
Missouri statewide 1-Month SPEI, February, 1895-2017.
|
3-month SPI map, December 2016-February 2017.
|
Much of the Midwest experienced extremely dry and record warm conditions during February. Much of the dryness during the last one to six months was centered along the Mid-Mississippi Valley and stretched from northern Arkansas to southern Illinois, with Missouri, Arkansas, and Illinois experiencing the brunt of the dryness on a statewide basis. As noted earlier, February 2017 was the seventh driest February in the 1895-2017 record for Missouri and ninth driest for Illinois, December-February was the tenth driest winter for Missouri, and September-February was the ninth driest such 6-month period for Arkansas. The combination of heat and dryness gave Missouri the most severe February 1-month SPEI on record.
|
USGS streamflow percentile map, February 2017.
|
 NLDAS topsoil moisture percentile map, February 27, 2017.
|
Drought conditions were evident in some indicators, including low streamflows and dry soils. According to February 26th USDA reports, 51 percent of the topsoil and 46 percent of the subsoil was short or very short of moisture (dry or very dry) in Missouri, with the percentages for Illinois 28 percent (topsoil) and 27 percent (subsoil).
|
Connecticut statewide 24-Month SPEI, February, 1895-2017.
|
24-month SPI map, March 2015-February 2017.
|
Recent months have been wetter than normal in the northern and western sections of the Northeast, but drier-than-normal conditions continued in the southern sections. Southern New England has been the focus of the dryness at the 12- to 24-month time scales. Connecticut had the third driest March-February 12-month period, third driest March-February 24-month period, and fifth driest March-February 36-month period; Massachusetts ranked ninth driest for the last 12 months (March 2016-February 2017). The combination of unusual dryness and record to near-record warm temperatures gave Connecticut the fifth most severe 12-month SPEI and third most severe 24-month SPEI in the historical record.
USGS streamflow levels were above normal in the northwestern sections of the Northeast (along the Great Lakes) and below normal in the southern portions. There was some indication of dry soils in some southern locations. According to the February 28th USDM, about a fourth of the Northeast was experiencing moderate to extreme drought, with the most severe conditions in southern New England.
|
1-month SPI map, February 2017.
|
 Kansas statewide 1-month SPEI, February, 1895-2017.
|
Parts of the Great Plains were dry during February. On the February 28th USDM map, moderate drought continued in South Dakota and adjacent parts of Wyoming, and moderate to severe drought continued in parts of Colorado, Kansas, Nebraska, Oklahoma, and Texas. Oklahoma was the epicenter of drought in the Southern Plains, but above-normal rains fell across parts of the state in February, giving Oklahoma a February precipitation rank of 34 th wettest. Below-normal precipitation was more widespread in neighboring Kansas, where the 14 th driest and fourth warmest February gave the state the third most severe February 1-month SPEI on record.
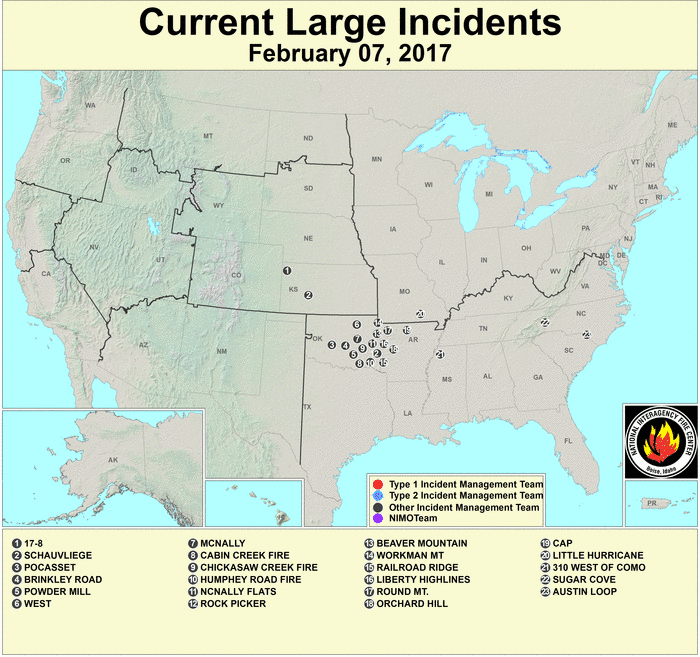
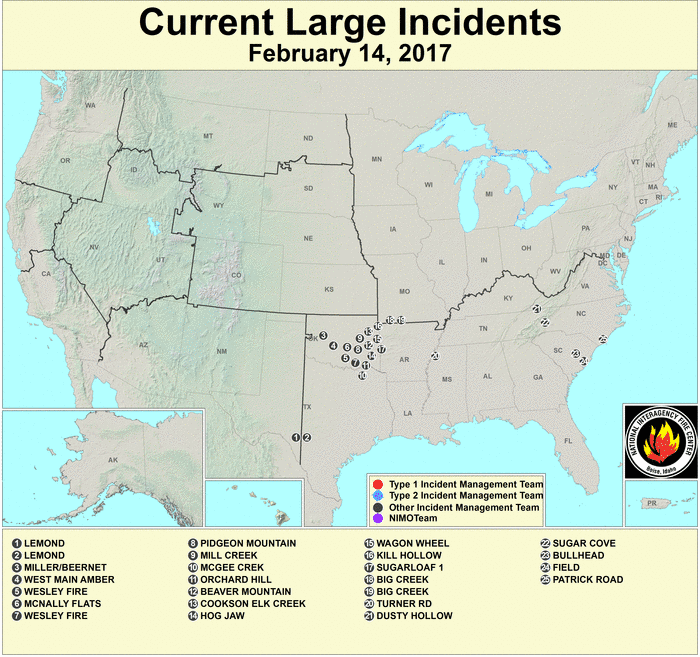
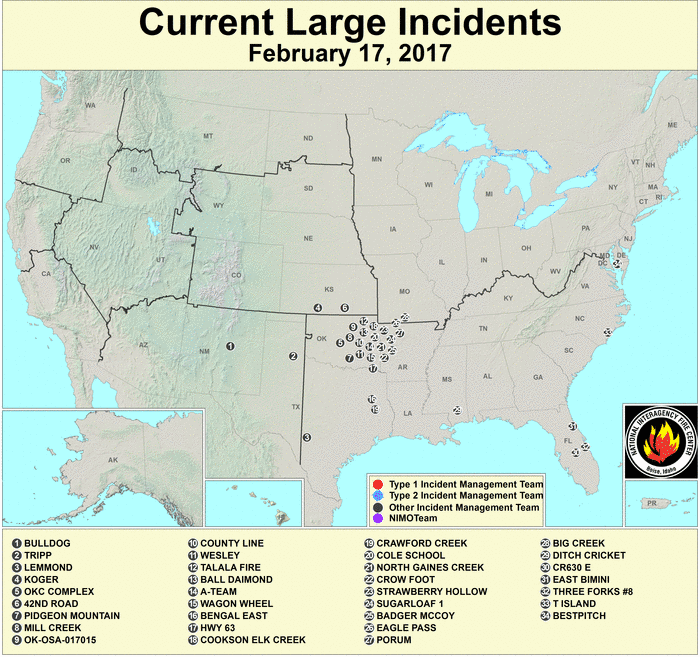
Of particular note are the widespread large wildfires which have persisted across eastern Oklahoma throughout the month (wildfire maps for February 7, 14, 17, 24, 28) and the high evapotranspiration rates that have accompanied the above-normal temperatures in the Southern and Central Plains. This is becoming evident in February 26th USDA reports. The lack of precipitation and dry soils in some areas were reflected in statewide reports of short or very short soil moisture. In Kansas, 55 percent of the topsoil and 56 percent of the subsoil were short or very short of moisture (dry to very dry). The numbers were 46 percent (for both topsoil and subsoil) in Colorado, 43 percent (subsoil) and 42 percent (topsoil) in Oklahoma, 48 percent (subsoil) and 45 percent (topsoil) in Wyoming, 30 percent (subsoil) and 33 percent (topsoil) in Texas, and 30 percent (subsoil) and 25 percent (topsoil) in Nebraska. February 26th USDA reports indicated that a third or more of the pasture and rangeland was in poor to very poor condition in Oklahoma (37%), Wyoming (36%), and Colorado (30%).
 Primary Hard Red Winter Wheat Belt precipitation, February, 1895-2017.
|
 Primary Hard Red Winter Wheat Belt precipitation, October-February, 1895-2017.
|
February 2017 was warmer than normal across the Primary Hard Red Winter Wheat agricultural belt, while parts were wetter than normal and other parts drier than normal. The month ranked as the third warmest and 56th driest February, regionwide, in the 1895-2017 record. October serves as the beginning of the growing season. October 2016-February 2017 was wetter than normal in places and drier than normal in others, and warmer than normal across the region, ranking as the second warmest and 59th driest October-February, regionwide, on record.
NOAA Regional Climate Centers:
A more detailed drought discussion, provided by the NOAA Regional Climate Centers and others, can be found below.
As described by the High Plains Regional Climate Center, most of the High Plains was dry during February, with the exception of the Rockies and a swath of higher precipitation across much of Wyoming, southern South Dakota, and northern Nebraska. It was dry throughout much of Kansas, eastern Colorado, southern Nebraska, and the Dakotas. Unfortunately, drought-stricken areas of eastern Colorado and Kansas received very little precipitation during February, which caused drought to remain or intensify, and drought began to spread across eastern Kansas. Meanwhile, ample precipitation in the Rockies helped snowpack continue to build in Colorado and Wyoming, and these areas are on pace to have a very high snowpack year. As for precipitation during the winter season, it was wet in parts of the region. Locations across Colorado, Wyoming, and North Dakota had their wettest winters on record. The biggest weather story of the month was unseasonably warm temperatures across the majority of the High Plains. While February was especially warm in the High Plains, December and January were cooler, and only a few locations in North Dakota and Kansas had a top 10 warmest winter on record.
While the late-winter warmth allowed for a welcomed break from typical wintertime temperatures, it has caused some negative impacts and concerns around the region. For example, plants broke dormancy early, putting them at risk for freezes later in the spring (the average last spring freeze does not typically occur until April or May throughout most of the region). Insects and pests have emerged early; for instance, alfalfa weevil larvae are already present in some areas of Kansas. Producers in Kansas and Nebraska were concerned about the winter wheat crop emerging early due to warm temperatures, and the lack of snow cover during cold snaps may have led to winterkill. Warm temperatures have also melted snow and ice rapidly, causing ice jams and flooding along rivers in Wyoming.
Overall, drought conditions did not change drastically during February, which is common for this time of year when impacts tend to be minimal. The area in abnormal dryness or drought (D0-D4) on the USDM decreased slightly from 38 percent to 35 percent in February. The area in drought (D1-D4) changed very little. However, there were some improvements and degradations in drought conditions in the region. The persistent area of drought stretching from the Black Hills of South Dakota into northeastern Wyoming received some relief during February. A snowstorm brought beneficial moisture to western South Dakota and western Nebraska, which led to the trimming of moderate drought (D1) on the eastern edge of the area and the removal of abnormal dryness (D0) from parts of the Nebraska panhandle. As for degradations, D1 was introduced to eastern Kansas during February. This area has been contending with dryness since December. February did not offer any relief, as temperatures in this region were more than 8.0 degrees F (4.4 degrees C) above normal and precipitation was less than 25 percent of normal. The February 27th USDA Kansas Crop Progress and Condition Report stated that over half of the state's topsoil and subsoil moisture was short or very short, and nearly a quarter of the winter wheat crop was rated poor or very poor. Concerns are growing over the possibility of additional drought development, so producers will be watching the weather closely during March.
As explained by the Southern Regional Climate Center, precipitation values for the month of February varied spatially across the Southern region. Precipitation totals in Texas and Oklahoma ranged between 130 to over 200 percent of normal. By contrast, conditions were quite dry across much of Louisiana, Southern Mississippi, and Tennessee with most stations reporting between 25 to 70 percent of normal. In Arkansas precipitation values were mixed in that there were clusters of normal, below normal and above normal levels of precipitation values, ranging between 25 to 130 percent of normal. This was also the case in Northern Mississippi. February was a warmer-than-normal month for all six states in the Southern region. Over the month of February 2017, drought conditions remained similar to January. There were a few areas that went from normal to abnormally dry, including eastern Arkansas, and much of western Tennessee. Areas of Oklahoma, Arkansas, and Tennessee were still exhibiting severe and extreme drought conditions.
As summarized by the Midwest Regional Climate Center, February precipitation in the Midwest varied from very dry conditions across much of Missouri, Illinois, Indiana, and Kentucky to wetter than normal conditions across northern Iowa, Wisconsin, northern Minnesota, and Upper Michigan. Overall, the Midwest had 1.25 inches (32 mm) of precipitation, which was about 70 percent of the normal amount. For the winter season, precipitation was near normal for the region, but less than half the normal amount fell in Missouri and most of Illinois, with some areas receiving less than a quarter of normal. February temperatures in the Midwest were much above normal and record-breaking in many states. The Midwest as a whole ranked second warmest on record (1895-2017) with an average temperature of 35.6 deg F (2.0 deg C) which was 9.1 deg F (5.1 deg C) above normal. The December through February temperature of 29.6 deg F (-1.3 deg C) ranked among the ten warmest on record (1895-2017).
Dry weather across Missouri contributed to expansion of moderate drought in February. The month began with less than 10 percent of the state in drought (January 31 USDM) and drought expanded during the month to cover nearly two-thirds of the state (February 28 USDM). Outside of Missouri, only a small part of west-central Illinois was in drought during February.
As noted by the Southeast Regional Climate Center, precipitation was well below normal across much of the Southeast, with several extremes recorded. The driest locations were found across much of Georgia, the Carolinas, and Virginia, as well as portions of western Alabama and the Florida Peninsula. Monthly precipitation totals were 10 to 50 percent of normal in these areas. At least 25 long-term stations, with one or more located in every state, observed February precipitation totals that were ranked within the three lowest values on record. Greensboro, NC (1903-2017) observed its driest February on record, with only 0.49 inches (12.4 mm) of precipitation. Several stations observed their second driest February on record, including Mobile, AL (1871-2017; 1.28 inches, 32.5 mm), Raleigh, NC (1887-2017; 0.66 inches, 16.8 mm), and Roanoke, VA (1912-2017; 0.54 inches, 13.7 mm). Precipitation was generally below normal across Puerto Rico and the U.S. Virgin Islands during the month, as Roosevelt Roads, PR (1948-2017) tied its driest February on record with only 0.56 inches (14.2 mm) of precipitation.
Temperatures were well above average across the Southeast region, with numerous record-breaking extremes observed during February. At least 47 long-term (i.e., period of record equaling or exceeding 50 years) stations across the region, with all but six located in the Carolinas and Virginia, observed their warmest February mean temperature on record. The persistence of unseasonable daytime warmth was exceptional for many locations during the month. At least 51 long-term stations observed their highest count of February days with a maximum temperature at or above 70 degrees F (21.1 degrees C). Temperatures were above average across much of Puerto Rico and the U.S. Virgin Islands during the month, as San Juan, PR (1899-2017) observed its third warmest February mean temperature on record.
Drought conditions began to re-intensify across the interior portion of the region during February. The coverage of moderate-to-extreme (D1-D3) drought across the Southeast increased from 21 percent on January 31st to 30 percent on February 28th. Areas of extreme drought expanded in portions of central Alabama and northern Georgia, and severe-to-extreme (D2-D3) drought reemerged across much of the western Carolinas. A narrow corridor of moderate-to-severe drought developed east of the Shenandoah Valley in northern Virginia and the Washington, D.C. area, while a broader area of moderate drought emerged across parts of central and southern Florida. Streamflows, lake levels, and soil moisture remained extremely low across the interior portion of the region during February, due to unseasonably warm temperatures, below-average precipitation, and earlier-than-normal groundwater consumption by vegetation. Over 50 percent of the USGS gages in Georgia, the Carolinas, and Virginia recorded well below normal (i.e., less than the 10th percentile) streamflows at the end of the month. During mid-February, high winds and low humidity contributed to the development of a 5,000-acre wildfire in Polk County, FL, which destroyed a dozen homes. Pasture conditions continued to improve across portions of the region recovering from drought, with limited livestock grazing reported for the first time since last summer in parts of Alabama, Georgia, western North Carolina, and southwestern Virginia. However, a significant shortage of hay persisted in many areas, as livestock producers maintained a supplemental feeding for their herds. An exceptional lack of accumulated chill hours during February (and the winter season) could significantly diminish fruit and nut yields across the region. Premature budding and blooming of several crops (e.g., blueberries, strawberries, peaches, and pecans) were observed as far north as Virginia, which increases their vulnerability to damaging late frosts or freezes. Well-above-average temperatures ended the harvesting of maple sap unusually early for many syrup producers in western Virginia.
As explained by the Northeast Regional Climate Center, the Northeast wrapped up February with 2.45 inches (62.23 mm) of precipitation, which was 90 percent of normal. Eight states were drier than normal, with precipitation ranging from 41 percent of normal in Maryland to 87 percent of normal in Pennsylvania. Five states ranked this February among their top 20 driest on record: Maryland, eighth driest; Delaware, ninth driest; New Jersey, 11th driest; Connecticut, 12th driest; and West Virginia, 18th driest. For the wetter-than-normal states, precipitation ranged from 101 percent of normal in New Hampshire to 121 percent of normal in New York. The Northeast averaged out to be wetter than normal during winter
The Northeast had its warmest February in the 1895-2017 record. Each month of winter was warmer than normal for the Northeast, so the season averaged out to be warmer than normal, as well. The region's average temperature of 30.6 degrees F (-0.8 degrees C) was 4.7 degrees F (2.6 degrees C) above normal, making it the fifth warmest winter since recordkeeping began.
The USDM released on February 2 indicated 35 percent of the Northeast was in a moderate, severe, or extreme drought, with another 26 percent being abnormally dry. Conditions improved in portions of New York, New England, northern Pennsylvania, and northern New Jersey, but deteriorated in portions of Delaware, Maryland, southern New Jersey, southern Pennsylvania, and the Panhandle of West Virginia. February average streamflow ranged from much below normal in portions of the Mid-Atlantic to much above normal in portions of New York and Vermont. Groundwater and reservoir levels increased slowly during February, returning to near normal in some areas, but remaining below normal in other areas. In early February, the Massachusetts Water Resources Authority continued to urge its customers to conserve water as the Quabbin Reservoir lingered just below normal capacity since mid-November. On February 14, Wallingford, Connecticut ended their Water Supply Alert, which had been issued in early December 2016. According to a press release from the town's Water Division, "the average reservoir storage has been greater than 80.0% of the historical average for a minimum of sixty (60) calendar days." As of February 15, seven public water suppliers in Pennsylvania had restrictions in place. Worcester, Massachusetts' reservoir system increased from 56 percent of capacity on January 1 to 72.6 percent on February 1, but was still below normal February 1 capacity of 91.4 percent. By March 1, the system had increased to 83.2 percent of capacity, but was still below the average of 94.1 percent. The New York City reservoir system was 10.8 percent below normal capacity on January 31, but increased to 1.7 percent above normal capacity by March 2. At the state level, effective February 1, western and central Massachusetts improved to a Drought Watch, while northeastern Massachusetts improved to a Drought Advisory. In Mid-February, six Pennsylvania counties improved to a Drought Watch, while eleven improved to normal status. The Drought Watch for central Maryland was continued as of February 14.
As summarized by the Western Regional Climate Center, February was a wetter-than-normal month for much of the West, rounding out an anomalously wet meteorological winter for the region. Many locations attained record monthly totals. Temperatures were above normal across most of the region, with some of the greatest anomalies within and east of the Rockies. Only Washington, northern Idaho, and northwestern Montana saw well below normal temperatures.
February ended with a healthy snowpack across the West. For areas south of Washington and Montana, snowpack was well above normal. The Sierra Nevada saw end of February SWE values of 150-200% of normal, or more, and the southern Cascades were in the 125-140% of normal range. The central and southern Rockies boasted end-of-February SWE values in the 150-200% of normal range. Snowpack in the northern Cascades and northern Rockies trailed values seen in other regions, with many basins just shy of or slightly over normal for the end of February.
Precipitation across California this month furthered drought amelioration in the central and southern parts of the state. At the end of the month, only 9% of the state had any drought designation, compared to 51% at the start of the month. Portions of Nevada, eastern Oregon, western Utah and small areas of Montana and western Arizona also saw abnormally dry conditions disintegrate this month. A few locations, mainly east of the Rockies, developed abnormally dry conditions during February.
Several windward locations in the southeastern Hawaiian Islands observed below normal precipitation this month. Kaneohe, Oahu, and Hilo, Big Island, reported 0% and 64% of normal, respectively. In contrast, Honolulu, Oahu, observed 7.12 in (181 mm) for the month, 358% of normal and the 4th wettest February in a 78-year record. Further north, temperatures were near normal across much of Alaska, with the exception of areas north of the Brooks Range. Precipitation was near to above normal across much of the state, with the greatest departures from normal in the interior and northern portions of the state.
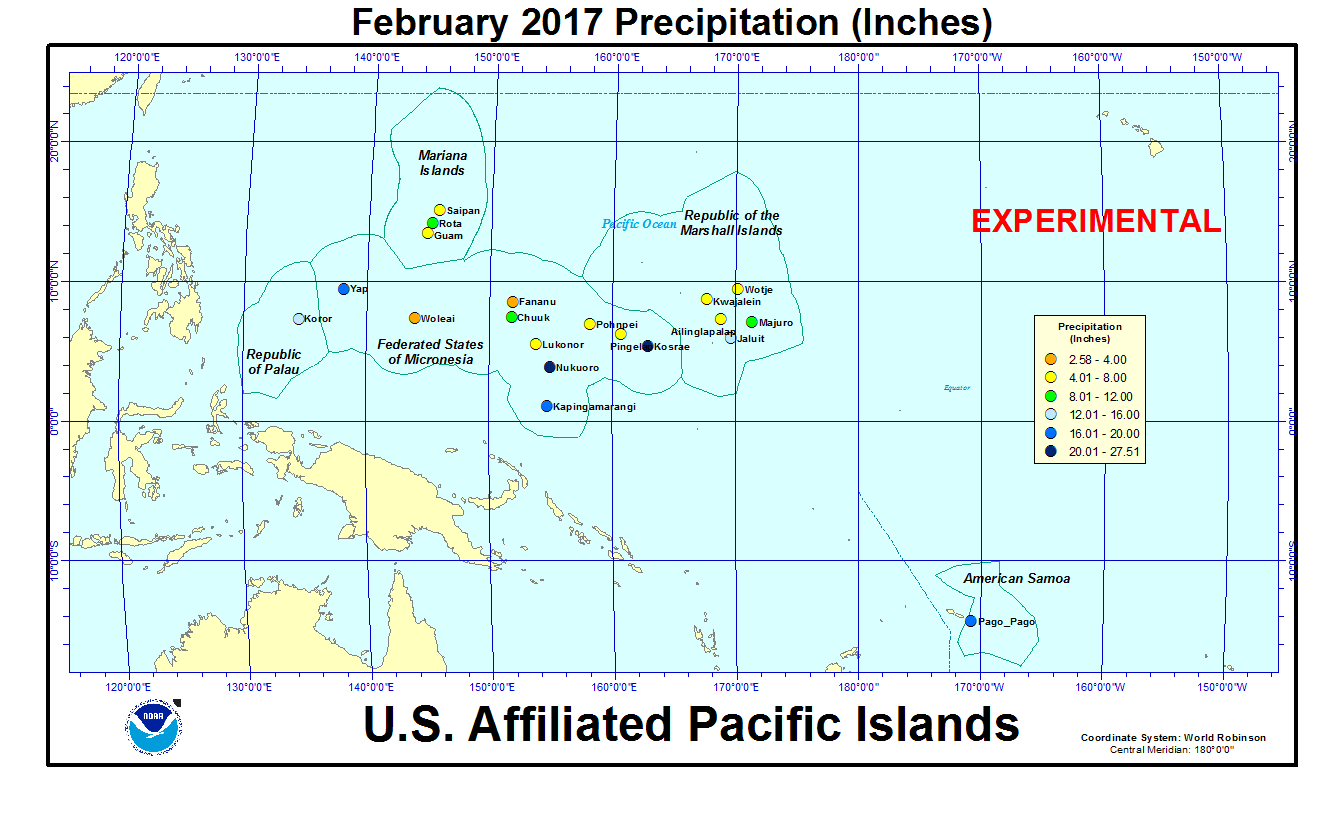
Pacific Islands: The NOAA National Weather Service (NWS) offices, the Pacific ENSO Applications Climate Center (PEAC), and partners provided reports on conditions across the Pacific Islands.
In the U.S. Affiliated Pacific Islands (USAPI) (maps — Federated States of Micronesia, Northern Mariana Islands, Marshall Islands, Republic of Palau, American Samoa, basinwide), February 2017 was drier than normal at Lukonor and Pohnpei, and wetter than normal at the other stations.
Rainfall amounts were below the minimum thresholds (4 or 8 inches) required to meet most monthly water needs at Fananu, Lukonor, Pingelap, Pohnpei, and Woleai (in the Federated States of Micronesia [FSM]); and Ailinglapalap, Kwajalein, and Wotje (in the Marshall Islands). February rainfall was above the monthly minimum thresholds at the rest of the regular reporting stations in Micronesia. The 4- and 8-inch thresholds are important because, if monthly precipitation falls below the threshold, then water shortages or drought become a concern.
Aside from a couple days in early February when a weather system moved over Wotje, dropping 0.75 inch of rain on the 5th, 1.75 inches on the 8th, and 1.98 inches on the 9th, virtually no rain has fallen in the northern Marshall Islands during the last three months. The National Weather Service office on Guam issued a revised Drought Information Statement on March 9 which noted that drought is a serious concern for the northern Marshall Islands. Reports from the government of the Republic of the Marshall Islands indicate that Utirik and Enewetak have operating reverse osmosis (RO) systems and that systems are being prepared for Ailuk, Wotje, and Mejit. But, as the Guam office noted, even with RO units, local vegetation and food sources are likely suffering from the drought and local wells will become more and more salty.
As measured by percent of normal precipitation, Lukonor has been drier than normal in the short term (February, the year-to-date [January-February], and the last 3 months [December 2016-February 2017]) as well as the long term (last 12 months [March 2016-February 2017]). Chuuk, Kapingamarangi, Koror, and Kosrae were dry in the long term but wet in the short term. Pohnpei was dry for February but near to wetter than normal at the other three time scales. Guam, Kwajalein, Majuro, Pago Pago, Saipan, and Yap were near to wetter than normal at all four time scales.
| Station Name | Mar 2016 | Apr 2016 | May 2016 | Jun 2016 | Jul 2016 | Aug 2016 | Sep 2016 | Oct 2016 | Nov 2016 | Dec 2016 | Jan 2017 | Feb 2017 | Mar- Feb |
|---|---|---|---|---|---|---|---|---|---|---|---|---|---|
| Chuuk | 85% | 86% | 107% | 91% | 94% | 74% | 86% | 58% | 98% | 176% | 113% | 114% | 94% |
| Guam NAS | 79% | 52% | 53% | 125% | 67% | 141% | 124% | 115% | 137% | 170% | 155% | 167% | 100% |
| Kapingamarangi | 88% | 94% | 34% | 24% | 66% | 91% | 77% | 26% | 71% | 114% | 159% | 207% | 74% |
| Koror | 36% | 135% | 115% | 93% | 45% | 61% | 115% | 153% | 144% | 64% | 131% | 175% | 93% |
| Kosrae | 32% | 23% | 72% | 130% | 88% | 88% | 89% | 90% | 56% | 168% | 103% | 213% | 79% |
| Kwajalein | 45% | 21% | 57% | 142% | 101% | 83% | 64% | 168% | 126% | 156% | 285% | 212% | 109% |
| Lukonor | 51% | 113% | 102% | 73% | 43% | 73% | 120% | 74% | 198% | 128% | 138% | 66% | 83% |
| Majuro | 20% | 22% | 110% | 66% | 90% | 75% | 123% | 120% | 129% | 103% | 228% | 138% | 101% |
| Pago Pago | 101% | 329% | 102% | 73% | 81% | 83% | 83% | 55% | 127% | 111% | 72% | 153% | 103% |
| Pohnpei | 44% | 60% | 80% | 143% | 79% | 112% | 144% | 120% | 115% | 142% | 182% | 71% | 104% |
| Saipan | 106% | 68% | 87% | 57% | 42% | 186% | 191% | 48% | 79% | 95% | 182% | 199% | 111% |
| Yap | 15% | 62% | 113% | 54% | 67% | 88% | 66% | 164% | 156% | 101% | 198% | 370% | 105% |
| Station Name | Mar 2016 | Apr 2016 | May 2016 | Jun 2016 | Jul 2016 | Aug 2016 | Sep 2016 | Oct 2016 | Nov 2016 | Dec 2016 | Jan 2017 | Feb 2017 | Mar- Feb |
|---|---|---|---|---|---|---|---|---|---|---|---|---|---|
| Chuuk | 7.08" | 10.73" | 12.11" | 10.61" | 11.27" | 9.50" | 10.04" | 6.73" | 10.39" | 19.83" | 11.37" | 8.27" | 127.93" |
| Guam NAS | 1.63" | 1.31" | 1.80" | 7.73" | 6.77" | 20.85" | 15.65" | 13.14" | 10.13" | 8.68" | 6.22" | 5.06" | 98.97" |
| Kapingamarangi | 10.02" | 12.78" | 4.07" | 3.30" | 9.33" | 7.38" | 7.61" | 2.14" | 6.58" | 11.22" | 14.54" | 19.18" | 108.15" |
| Koror | 2.68" | 9.90" | 13.55" | 16.25" | 8.28" | 8.20" | 13.51" | 18.06" | 16.38" | 7.13" | 13.30" | 14.99" | 142.23" |
| Kosrae | 5.15" | 3.99" | 12.70" | 18.99" | 13.07" | 12.48" | 12.71" | 9.87" | 7.76" | 26.99" | 17.21" | 27.51" | 168.43" |
| Kwajalein | 1.05" | 1.13" | 3.80" | 9.81" | 9.96" | 8.12" | 6.90" | 18.73" | 14.16" | 10.36" | 9.00" | 5.60" | 98.62" |
| Lukonor | 4.75" | 12.83" | 11.92" | 8.49" | 6.84" | 10.31" | 12.23" | 8.41" | 18.02" | 14.42" | 11.58" | 5.90" | 125.7" |
| Majuro | 1.33" | 2.05" | 11.12" | 7.27" | 10.09" | 8.78" | 13.73" | 15.28" | 17.36" | 11.77" | 17.65" | 9.50" | 125.93" |
| Pago Pago | 10.76" | 30.87" | 9.89" | 3.88" | 4.48" | 4.49" | 5.45" | 5.12" | 12.86" | 14.24" | 9.57" | 18.32" | 129.93" |
| Pohnpei | 5.76" | 11.01" | 16.06" | 21.18" | 12.12" | 15.91" | 18.13" | 18.39" | 17.00" | 22.83" | 24.00" | 6.76" | 189.15" |
| Saipan | 2.00" | 1.78" | 2.07" | 2.05" | 3.76" | 24.40" | 19.31" | 5.07" | 4.42" | 3.67" | 4.61" | 5.15" | 78.29" |
| Yap | 0.70" | 3.47" | 8.90" | 6.46" | 10.03" | 13.10" | 8.89" | 20.00" | 13.78" | 8.59" | 12.67" | 19.19" | 125.78" |
| Station Name | Mar 2016 | Apr 2016 | May 2016 | Jun 2016 | Jul 2016 | Aug 2016 | Sep 2016 | Oct 2016 | Nov 2016 | Dec 2016 | Jan 2017 | Feb 2017 | Mar- Feb |
|---|---|---|---|---|---|---|---|---|---|---|---|---|---|
| Chuuk | 8.32" | 12.47" | 11.30" | 11.66" | 11.98" | 12.86" | 11.71" | 11.51" | 10.61" | 11.25" | 10.10" | 7.25" | 136.77" |
| Guam NAS | 2.07" | 2.53" | 3.40" | 6.18" | 10.14" | 14.74" | 12.66" | 11.44" | 7.38" | 5.11" | 4.01" | 3.03" | 99.09" |
| Kapingamarangi | 11.43" | 13.64" | 12.08" | 13.78" | 14.15" | 8.13" | 9.93" | 8.19" | 9.27" | 9.84" | 9.15" | 9.27" | 145.85" |
| Koror | 7.44" | 7.32" | 11.83" | 17.48" | 18.53" | 13.50" | 11.77" | 11.84" | 11.39" | 11.16" | 10.18" | 8.56" | 152.90" |
| Kosrae | 16.06" | 17.51" | 17.75" | 14.64" | 14.91" | 14.22" | 14.22" | 10.94" | 13.83" | 16.11" | 16.67" | 12.93" | 213.87" |
| Kwajalein | 2.35" | 5.26" | 6.72" | 6.93" | 9.87" | 9.74" | 10.74" | 11.18" | 11.28" | 6.66" | 3.16" | 2.64" | 90.41" |
| Lukonor | 9.26" | 11.31" | 11.69" | 11.65" | 15.93" | 14.04" | 10.15" | 11.32" | 9.08" | 11.27" | 8.41" | 8.93" | 151.36" |
| Majuro | 6.58" | 9.42" | 10.11" | 11.01" | 11.17" | 11.69" | 11.17" | 12.73" | 13.44" | 11.39" | 7.74" | 6.88" | 125.25" |
| Pago Pago | 10.68" | 9.39" | 9.66" | 5.33" | 5.55" | 5.38" | 6.53" | 9.26" | 10.14" | 12.84" | 13.34" | 12.00" | 125.57" |
| Pohnpei | 13.17" | 18.41" | 19.96" | 14.81" | 15.43" | 14.26" | 12.55" | 15.27" | 14.83" | 16.08" | 13.18" | 9.55" | 182.36" |
| Saipan | 1.89" | 2.63" | 2.38" | 3.62" | 8.91" | 13.13" | 10.09" | 10.62" | 5.61" | 3.85" | 2.53" | 2.59" | 70.25" |
| Yap | 4.56" | 5.63" | 7.85" | 12.04" | 15.08" | 14.82" | 13.50" | 12.18" | 8.83" | 8.51" | 6.39" | 5.19" | 120.31" |
An analysis of historical data for the USAPI stations in the Global Historical Climatology Network-Daily (GHCN-D) dataset, augmented with fill-in data from the 1981-2010 Normals, indicated that long-term dryness persisted at some stations, but wet conditions dominated in the short term. The following table lists the precipitation ranks for February 2017, September 2016-February 2017 (last 6 months), and March 2016-February 2017 (the last 12 months). Some stations have a long period of record and their dataset is fairly complete, while other stations have a shorter period of record and the dataset has some missing data. Stations with low ranks for the last 12 months (March 2016-February 2017) include: Kapingamarangi with the 2nd driest March-February out of 12 years of data, Kosrae 8th driest out of 28 years, Lukonor 6th driest (out of 20 years), Woleai 8th driest (21), and Jaluit 8th driest (32).
Rank of 1 = driest.
| Station | Feb 2017 Rank |
Feb No. of Years |
Sep 2016- Feb 2017 Rank |
Sep- Feb No. of Years |
Mar 2016- Feb 2017 Rank |
Mar- Feb No. of Years |
Period of Record |
| Jaluit | 33 | 34 | 29 | 32 | 8 | 32 | 1981-2017 |
| Koror | 55 | 66 | 54 | 66 | 27 | 65 | 1951-2017 |
| Woleai | 11 | 33 | 22 | 28 | 8 | 21 | 1968-2017 |
| Yap | 66 | 66 | 64 | 66 | 40 | 65 | 1951-2017 |
| Majuro | 44 | 63 | 61 | 63 | 24 | 62 | 1954-2017 |
| Ailinglapalap | 25 | 34 | 31 | 32 | 20 | 31 | 1981-2017 |
| Kosrae | 47 | 51 | 20 | 33 | 8 | 28 | 1954-2017 |
| Lukonor | 6 | 33 | 24 | 31 | 6 | 20 | 1981-2017 |
| Saipan | 35 | 37 | 23 | 29 | 24 | 28 | 1981-2017 |
| Pohnpei | 18 | 66 | 63 | 66 | 38 | 65 | 1951-2017 |
| Kwajalein | 52 | 65 | 62 | 65 | 34 | 64 | 1952-2017 |
| Kapingamarangi | 28 | 30 | 9 | 17 | 2 | 12 | 1962-2017 |
| Chuuk | 37 | 66 | 31 | 65 | 17 | 65 | 1951-2017 |
| Guam | 41 | 60 | 47 | 60 | 30 | 60 | 1957-2017 |
| Nukuoro | 35 | 35 | 26 | 33 | 20 | 32 | 1981-2017 |
| Pago Pago | 46 | 51 | 23 | 51 | 31 | 50 | 1966-2017 |
| Wotje | 33 | 34 | 13 | 31 | 26 | 31 | 1981-2017 |


[top]
State/Regional/National Moisture Status
A detailed review of drought and moisture conditions is available for all contiguous U.S. states, the nine standard regions, and the nation (contiguous U.S.):
| northeast u. s. | east north central u. s. | central u. s. |
| southeast u. s. | west north central u. s. | south u. s. |
| southwest u. s. | northwest u. s. | west u. s. |
| Contiguous United States |
[top]
Contacts & Questions