|
Contents Of This Report: |
|
Please note that the values presented in this report are based on preliminary data. They will change when the final data are processed, but will not be replaced on these pages.
National Drought Overview
|
|
[top]
Detailed Drought Discussion
Overview
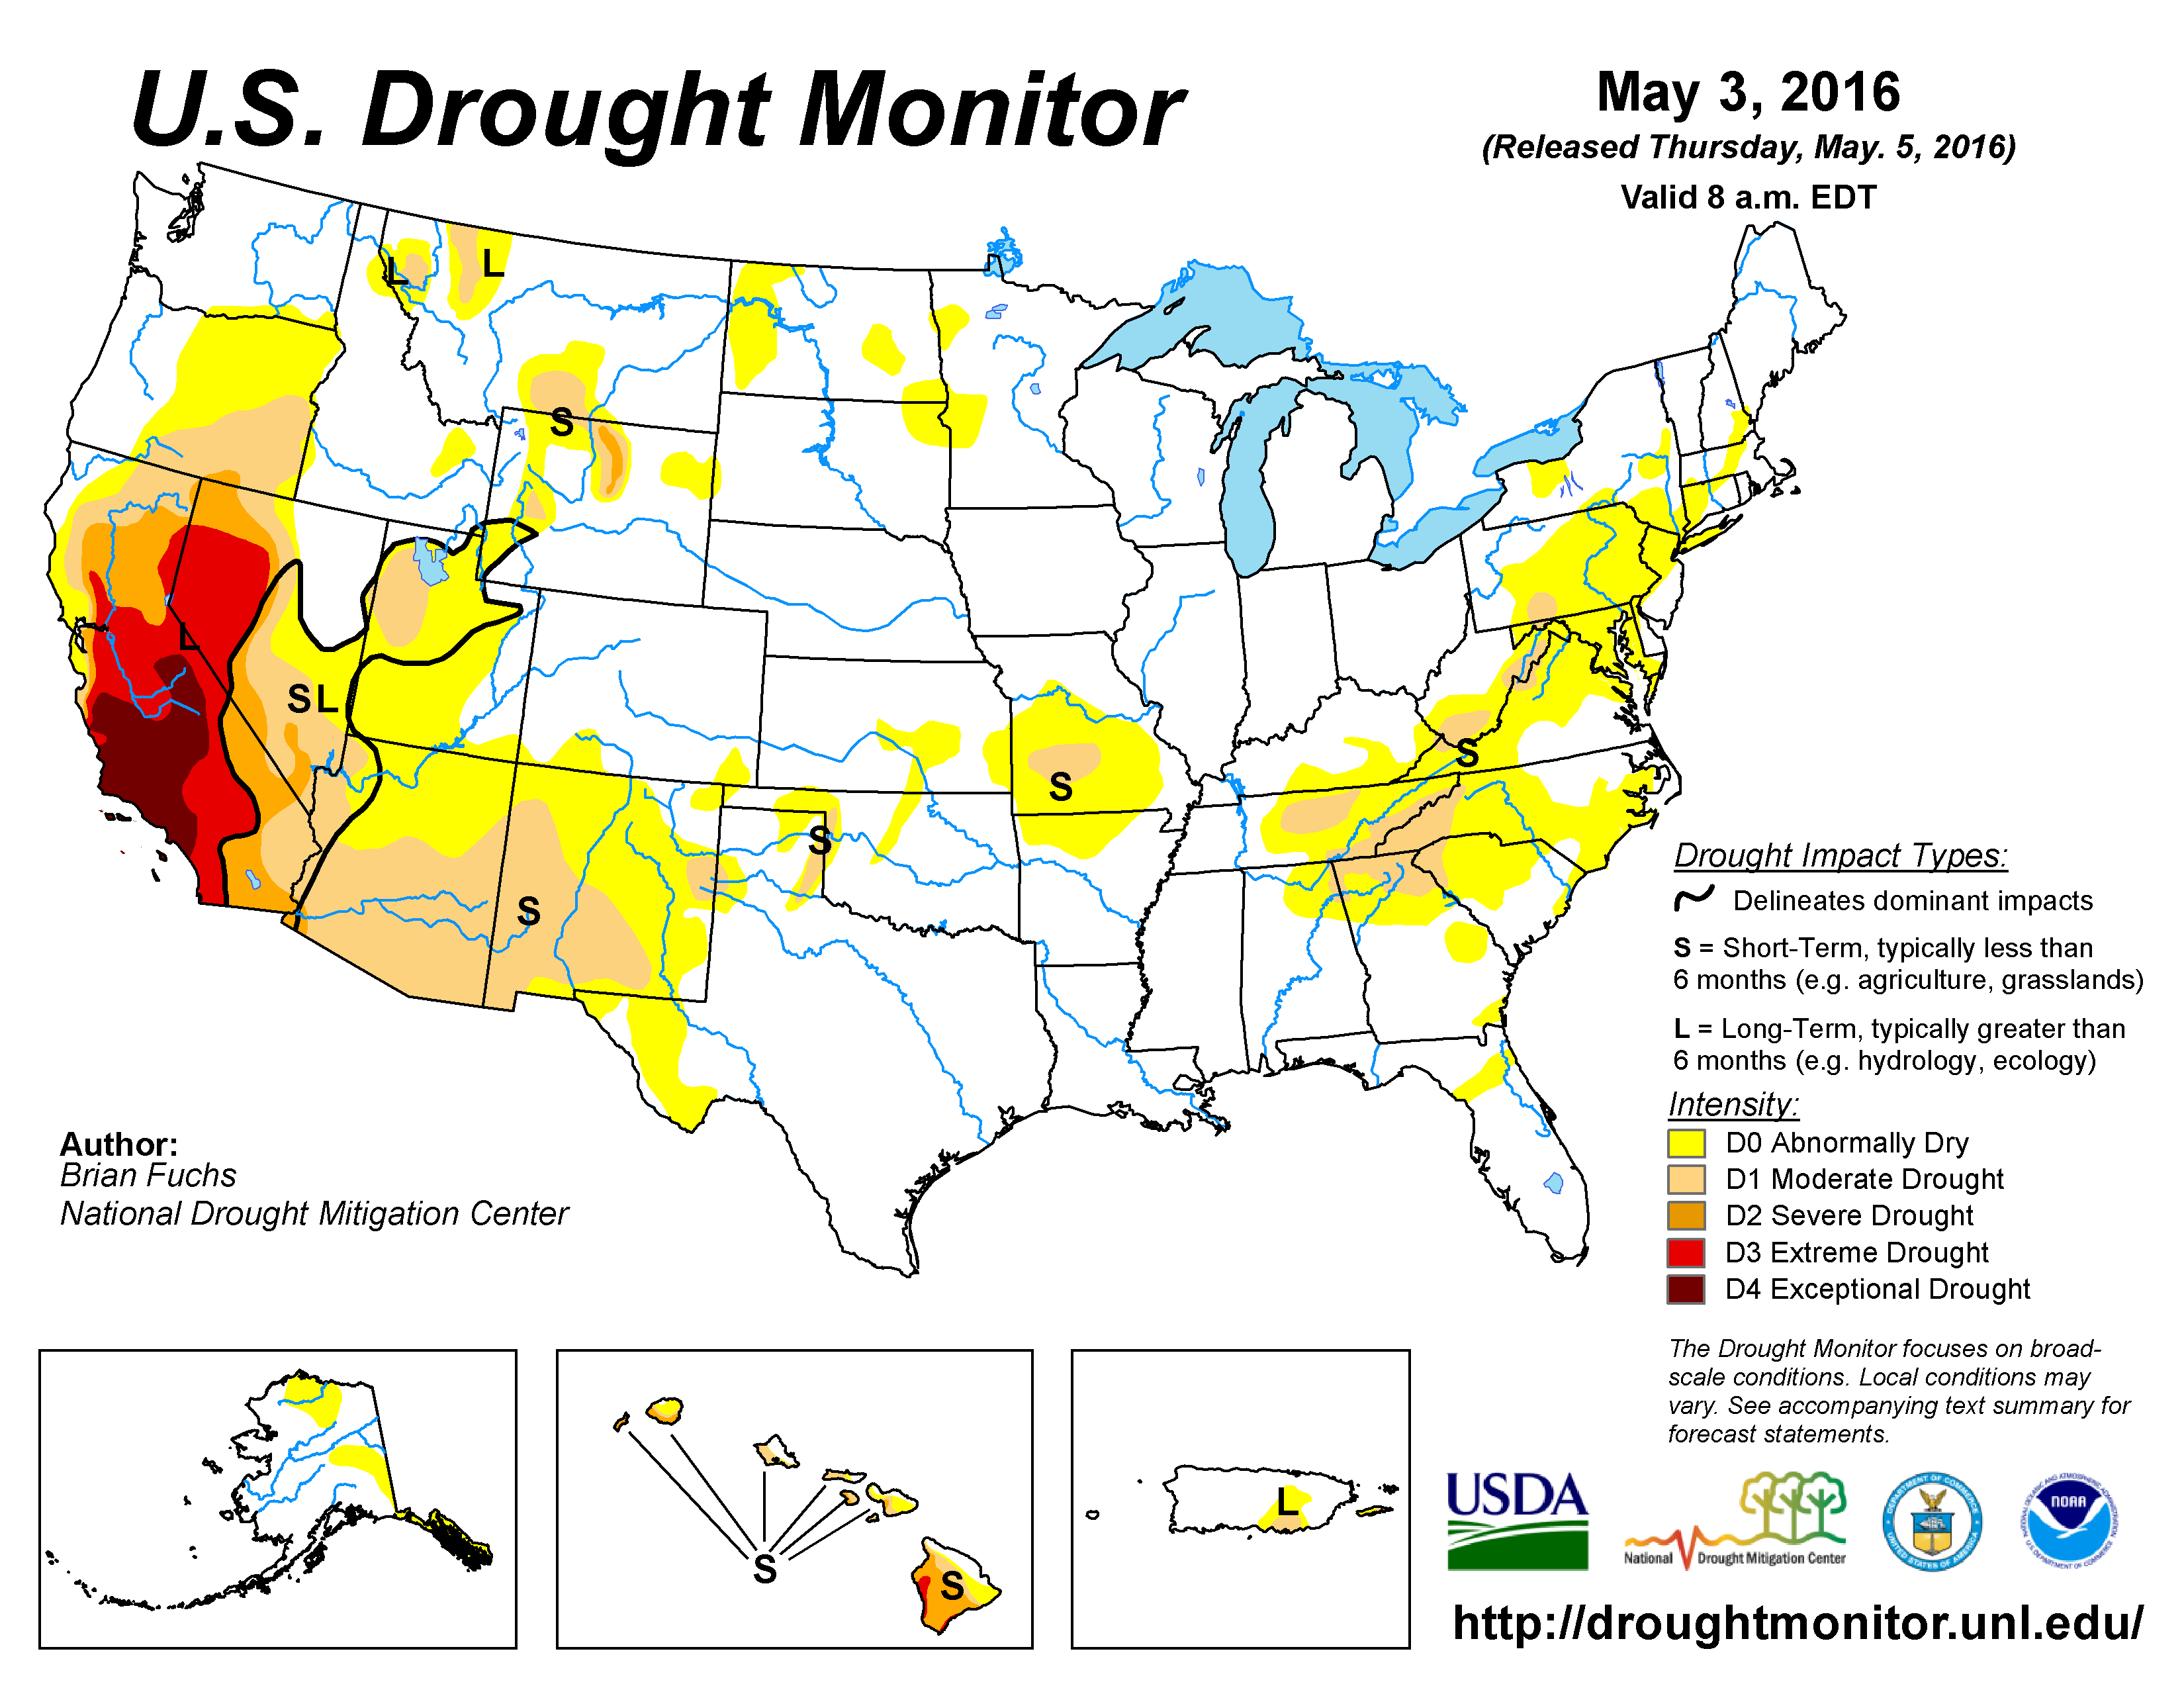
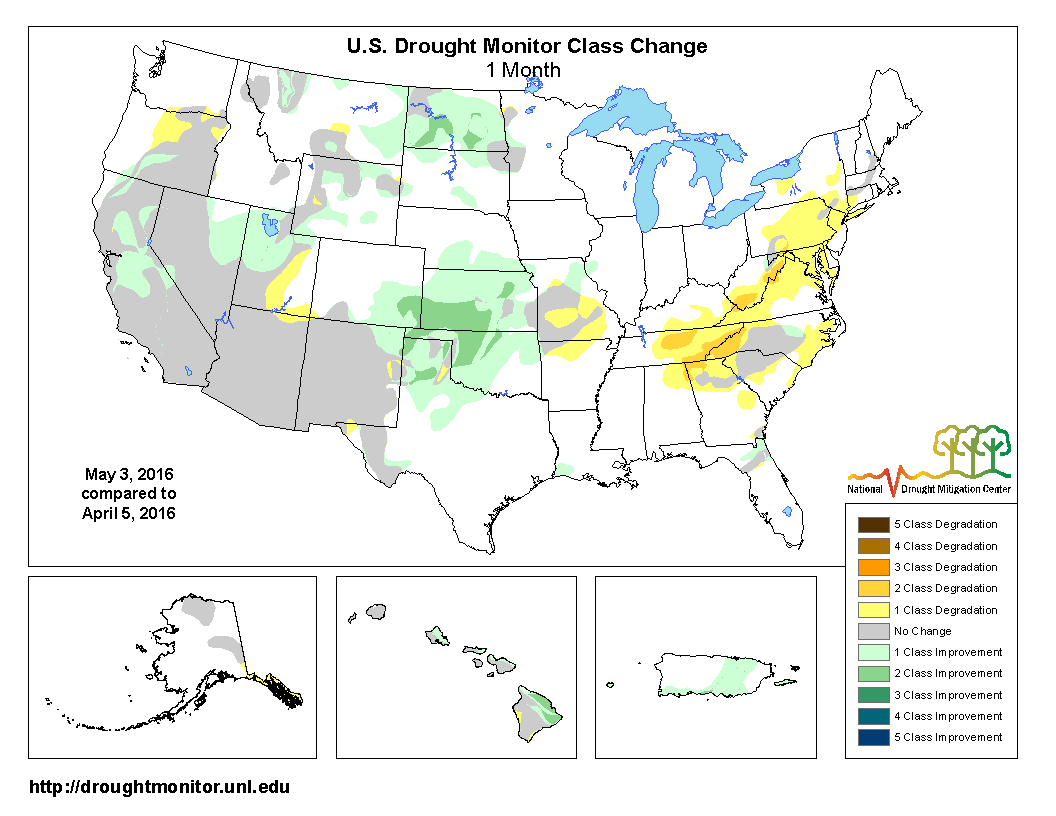
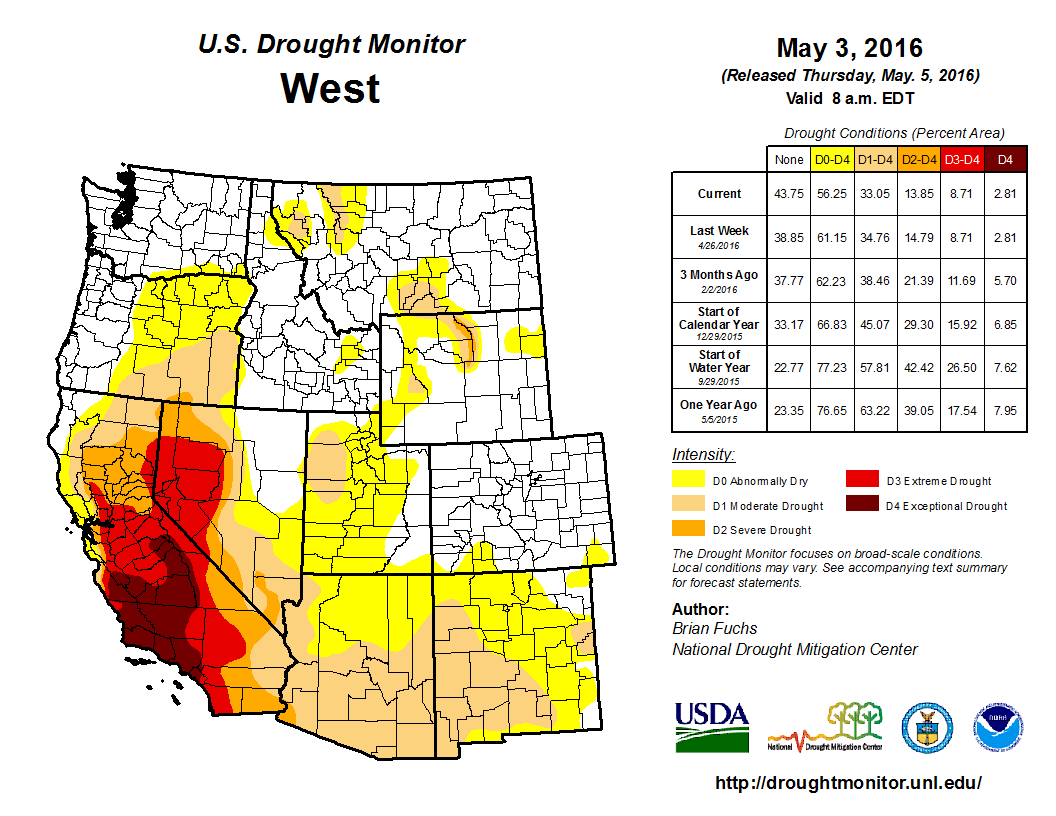
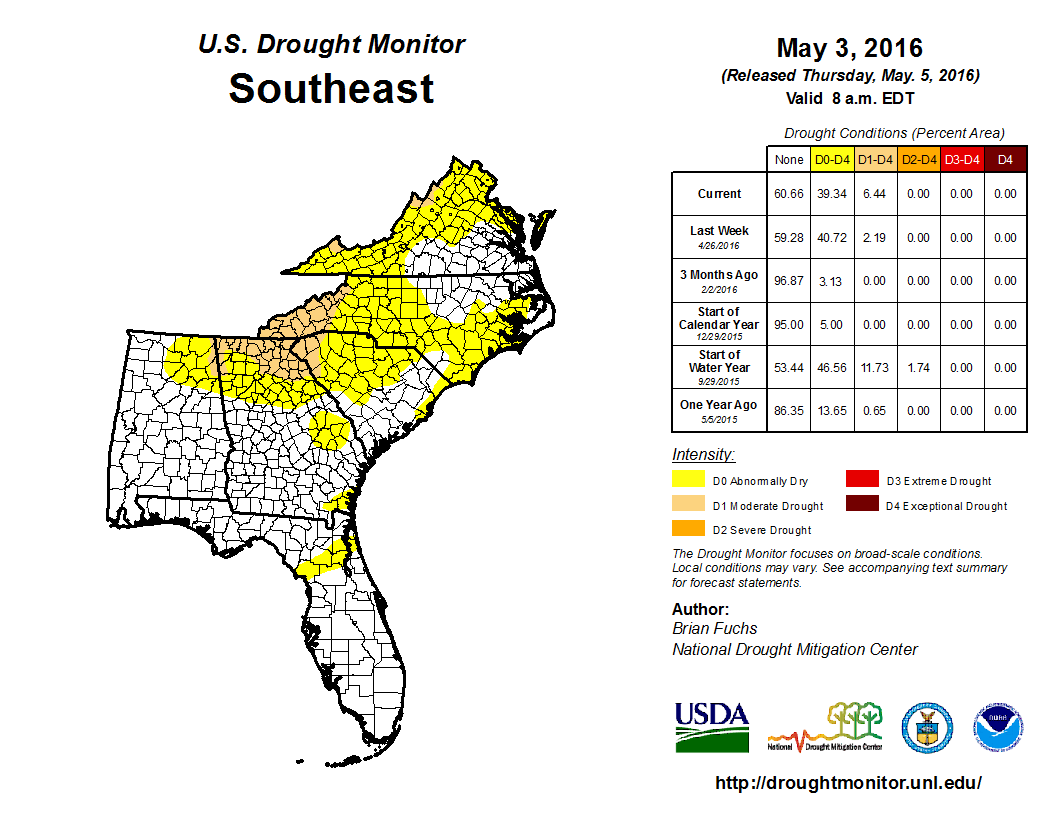
The U.S. Drought Monitor drought map valid May 3, 2016.
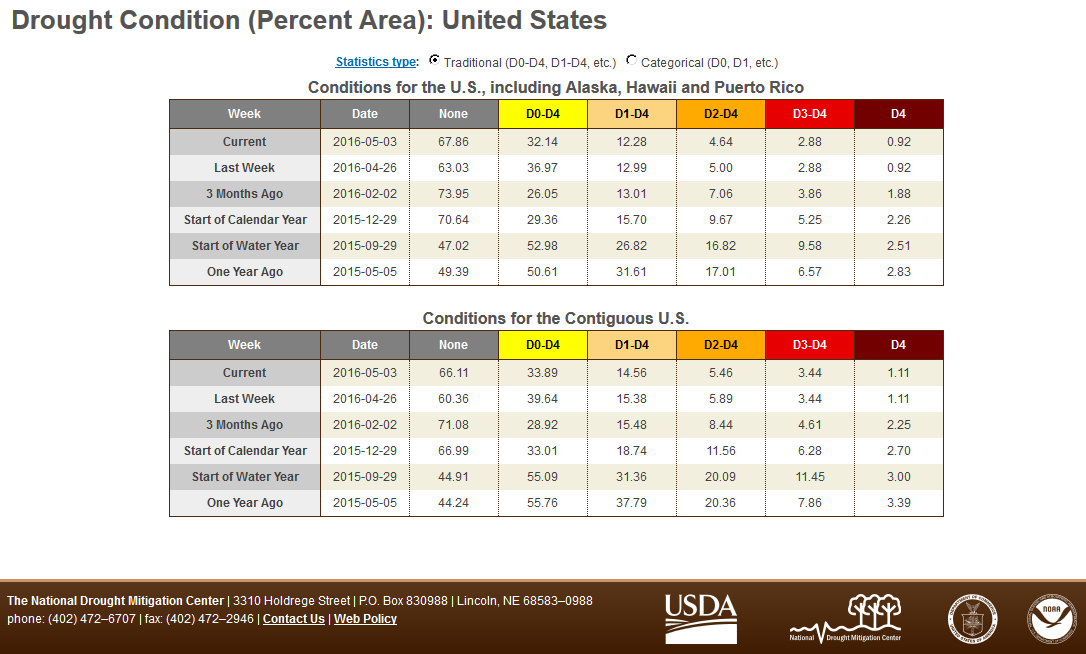
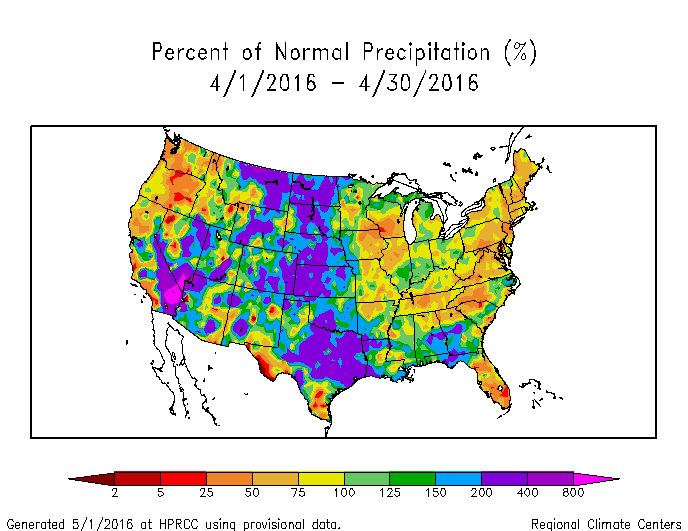
During April 2016, a weakening El Niño continued to pump moisture and energy from the tropical Pacific Ocean into the atmosphere, invigorating the upper-level circulation in the mid-latitudes. Numerous weather systems in the jet stream flow moved across the western CONUS, undercutting a longwave ridge that was anchored across western North America. These weather systems frequently formed large, slow-moving upper-level cutoff lows over the Southwest which funneled Gulf of Mexico moisture into the Great Plains. As a result of this circulation pattern, April 2016 was wetter than normal across much of the Southwest to Great Plains and part of the coastal Southeast, contracting areas of abnormal dryness and drought. A northwesterly flow in the upper levels of the atmosphere directed drier Canadian air masses across much of the eastern CONUS. This contributed to a drier-than-normal April across the Pacific Northwest, Upper Mississippi Valley, much of Florida, and southern Appalachians to Northeast. Abnormal dryness or drought developed or expanded in many of these areas. The ongoing El Niño kept much of Hawaii and the U.S.-Affiliated Pacific Islands drier than normal, but the precipitation pattern was mixed over Alaska and wetter than normal over much of Puerto Rico. When integrated across the CONUS, April 2016 ranked as the 21st wettest April in the 1895-2016 record. Drought shrank more than it expanded, with the national drought footprint decreasing slightly to 12.3 percent of the U.S. (14.6 percent of the CONUS). According to the Palmer Drought Index, which goes back to the beginning of the 20th century, about 9.7 percent of the CONUS was in moderate to extreme drought at the end of April, an increase of about 1.0 percent compared to last month.
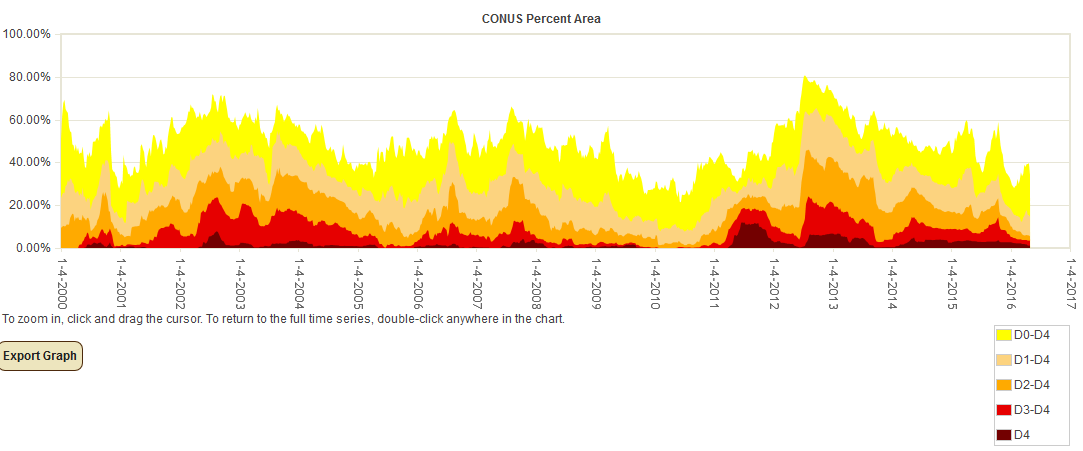
Percent area of the CONUS in moderate to exceptional drought, January 4, 2000 to present, based on the U.S. Drought Monitor.
Palmer Drought Index
The Palmer drought indices measure the balance between moisture demand (evapotranspiration driven by temperature) and moisture supply (precipitation). The Palmer Z Index depicts moisture conditions for the current month, while the Palmer Hydrological Drought Index (PHDI) and Palmer Drought Severity Index (PDSI) depict the current month's cumulative moisture conditions integrated over the last several months. While both the PDSI and PHDI indices show long-term moisture conditions, the PDSI depicts meteorological drought while the PHDI depicts hydrological drought. The PDSI map shows less severe and extensive drought in parts of the West than the PHDI map because the meteorological conditions that produce drought and wet spell conditions are not as long-lasting as the hydrological impacts.
|
 |
Used together, the Palmer Z Index and PHDI maps show that short-term dry conditions occurred over much of the Northwest, Upper Mississippi Valley, and Southeast to southern New England. In the Upper Mississippi Valley, this short-term dryness reduced the long-term wet conditions in April compared to March, while it expanded drought in the Northwest and showed small areas of drought developing in the Southeast to central Appalachians. Short-term wet conditions expanded or intensified long-term wet conditions in parts of the Great Plains.
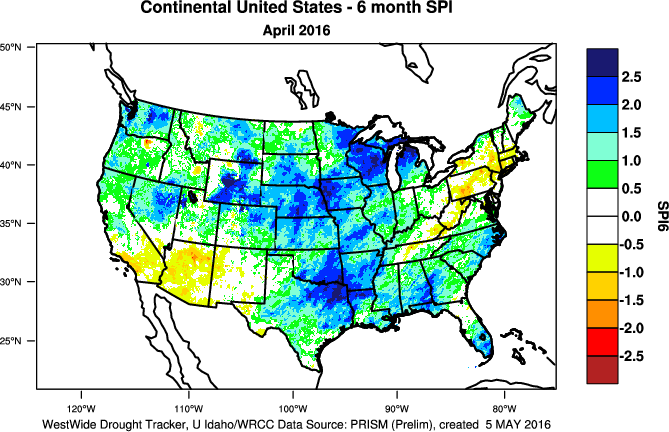
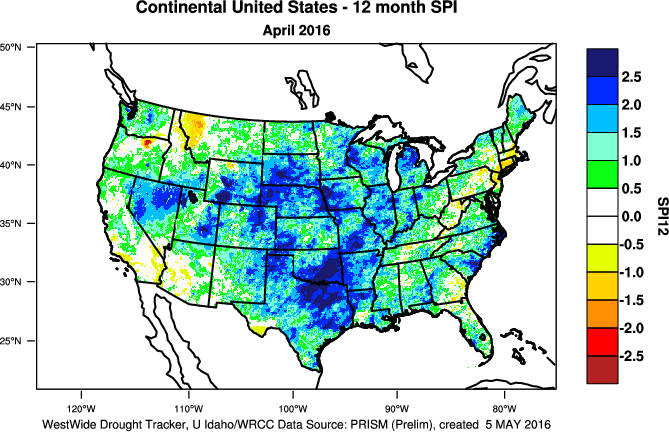
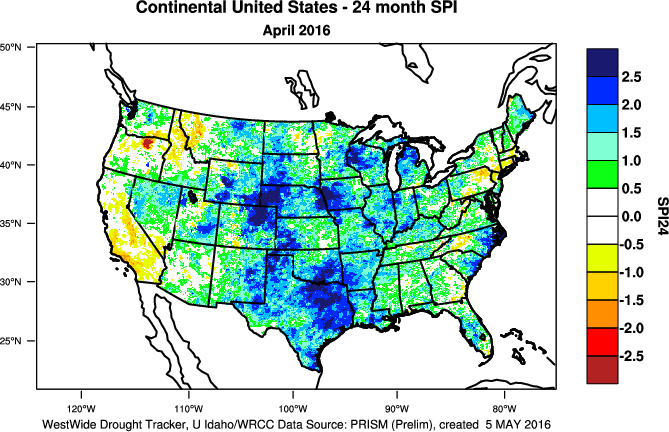
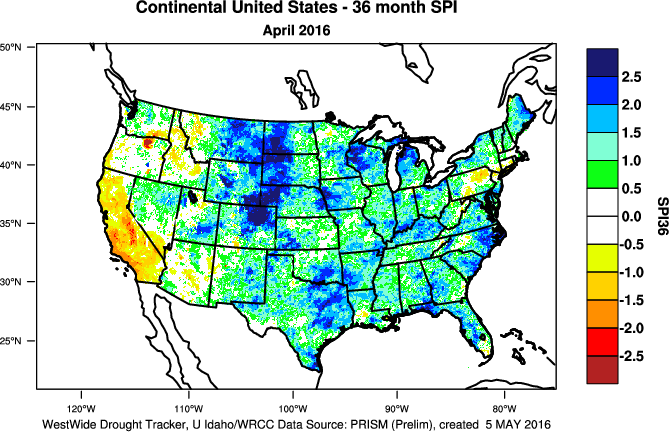
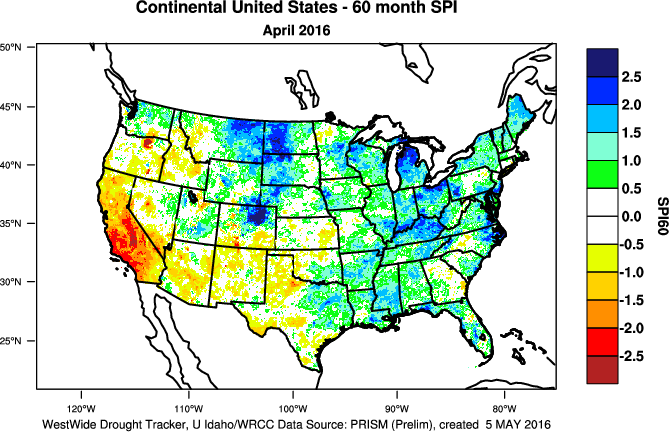
Standardized Precipitation Index
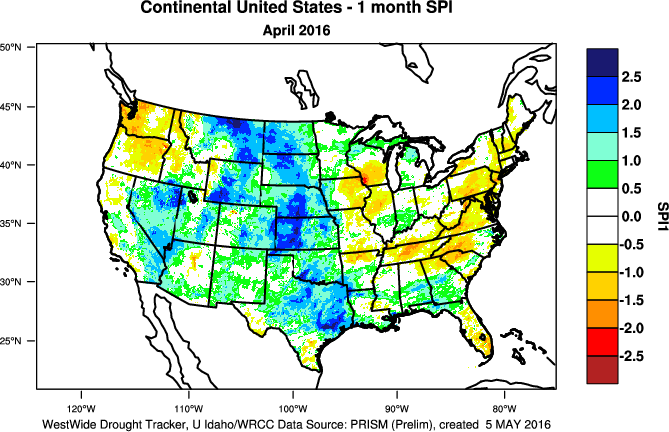
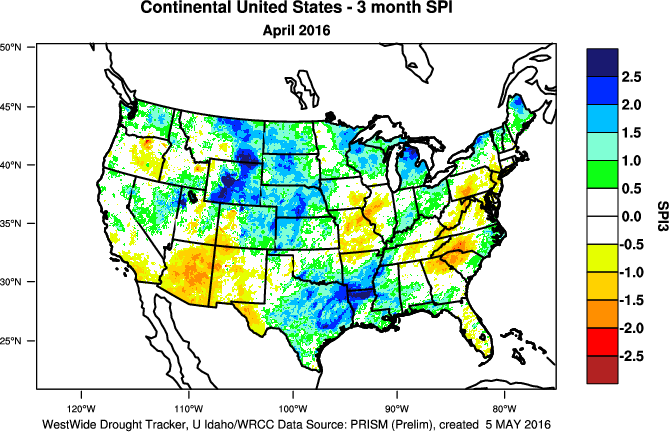
The Standardized Precipitation Index (SPI) measures moisture supply. The SPI maps here show the spatial extent of anomalously wet and dry areas at time scales ranging from 1 month to 24 months.
 |
 |
 |
The SPI maps illustrate how moisture conditions have varied considerably through time and space over the last two years. Dryness dominates the southern Appalachians to southern New England and parts of the Mid- to Upper Mississippi Valley at the 1- to 3-month time scales, parts of the central Appalachians to southern New England at 6 to 9 months, and parts of southern New England at 12 to 24 months. Dryness is widespread in the Northwest and Northern Rockies at the 1-month time scale and parts of the Northern Rockies at 12 to 24 months. The Southwest is drier than normal at the 2- to 6-month time scales with parts of southern California showing up as dry at 24 months. Wet conditions are evident across large parts of the country at all time scales.
 |
 |
 |
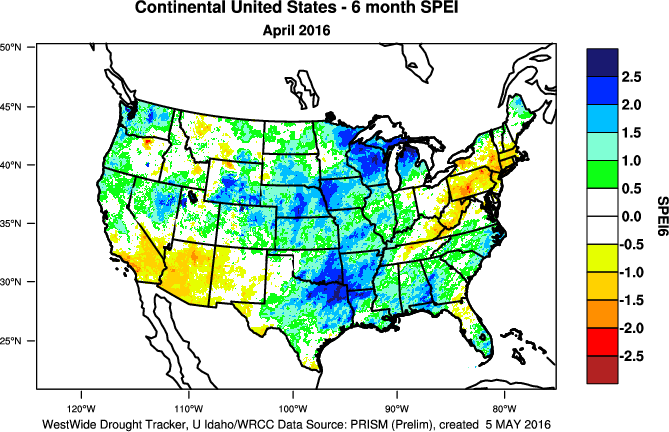
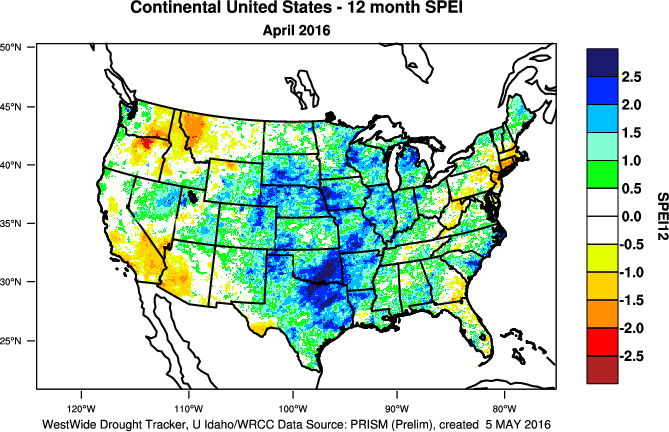
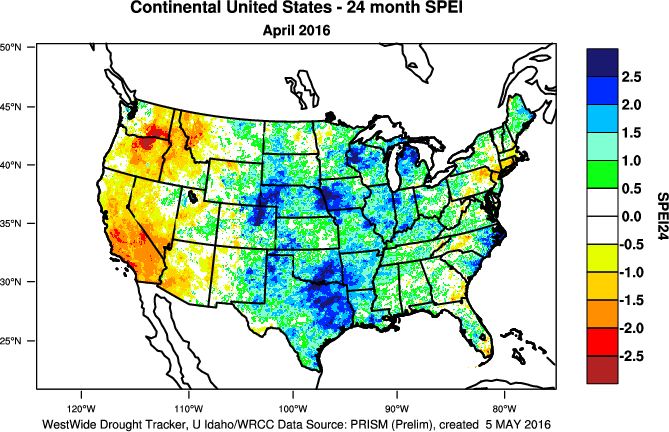
Standardized Precipitation Evapotranspiration Index
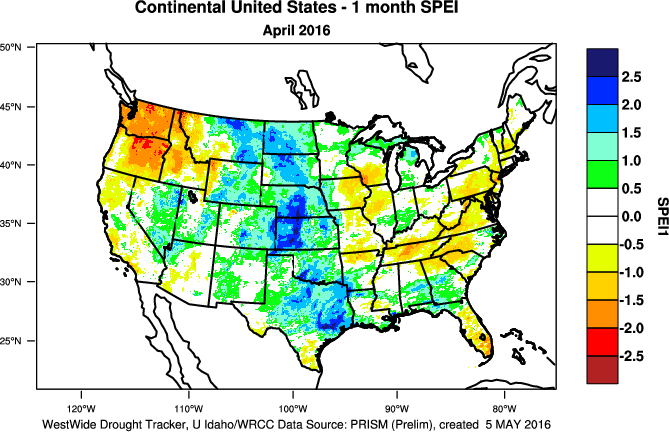
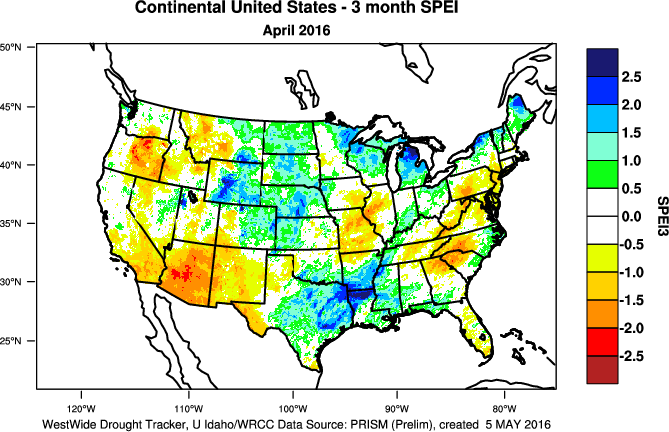
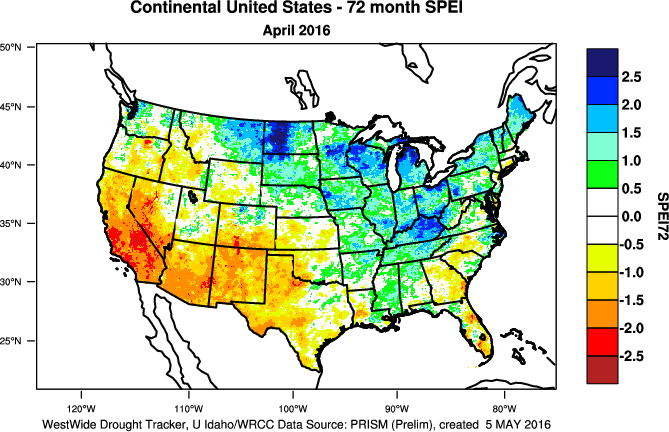
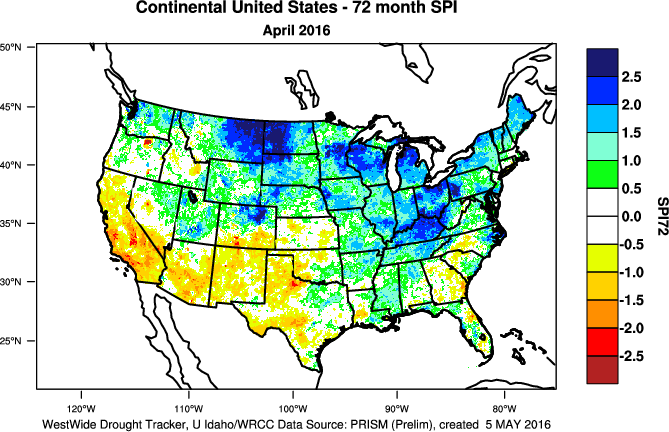
The SPI measures water supply (precipitation), while the SPEI (Standardized Precipitation Evapotranspiration Index) measures the combination of water supply (precipitation) and water demand (evapotranspiration as computed from temperature). Warmer temperatures tend to increase evapotranspiration, which generally makes droughts more intense.
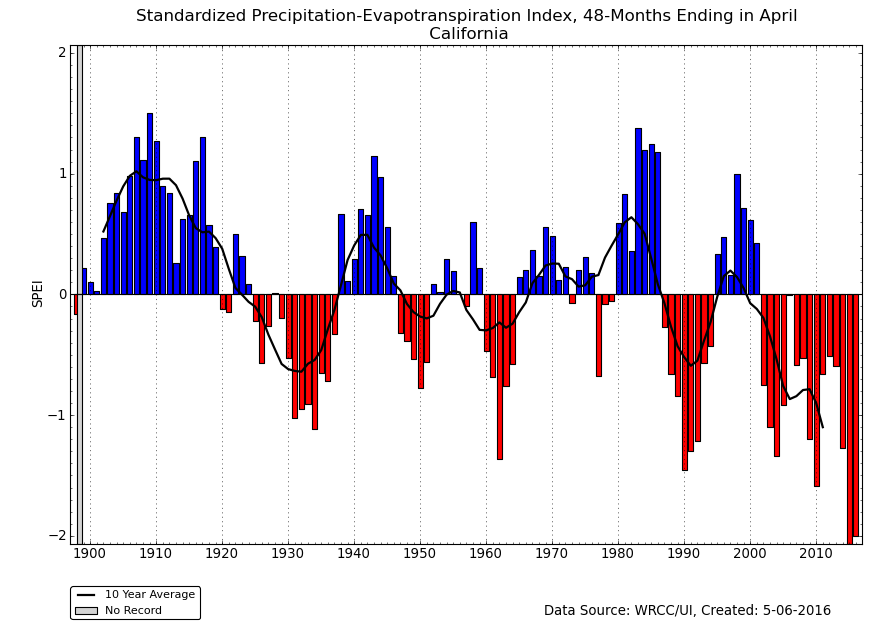
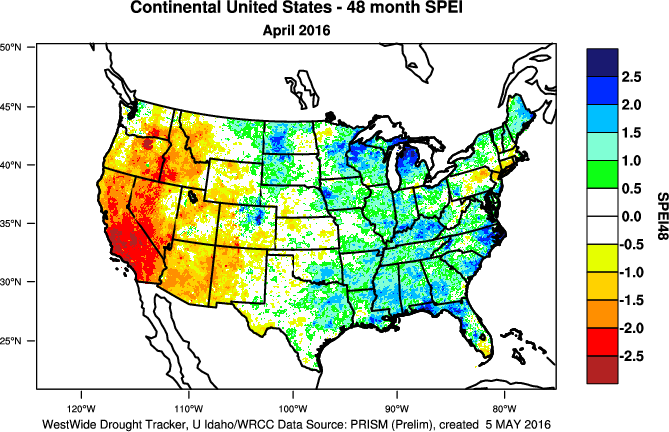 48-month SPEI for current month.
|
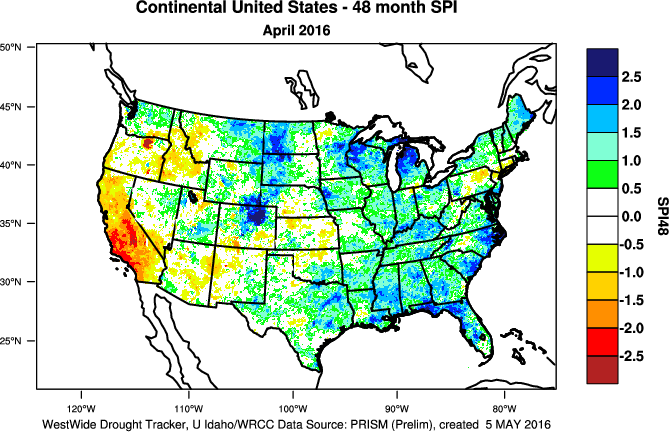 48-month SPI for current month.
|
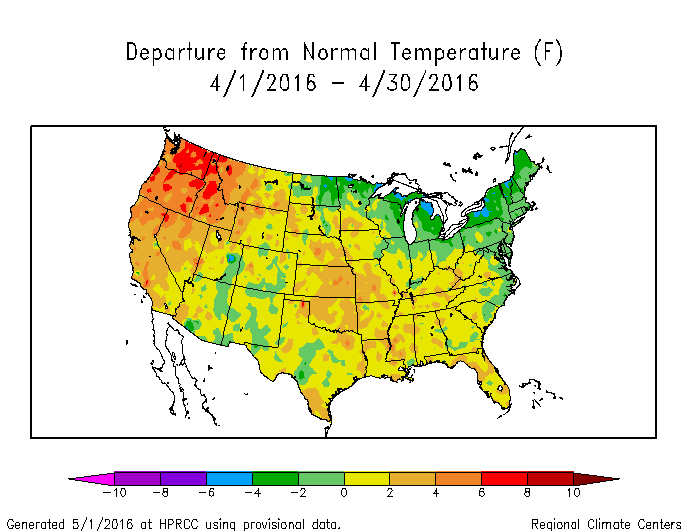
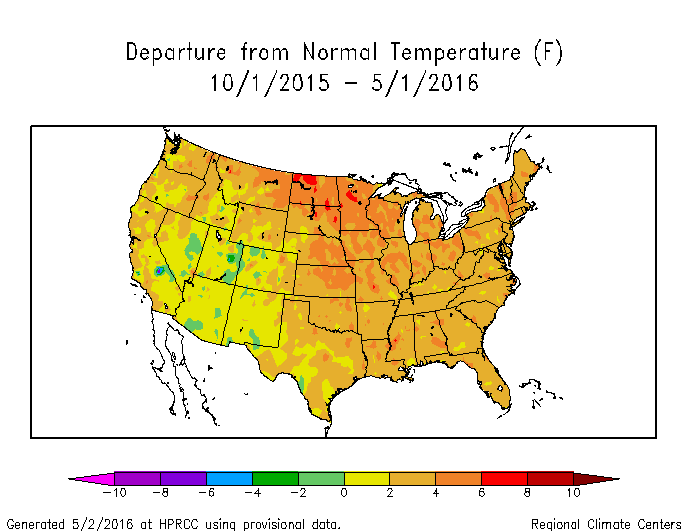
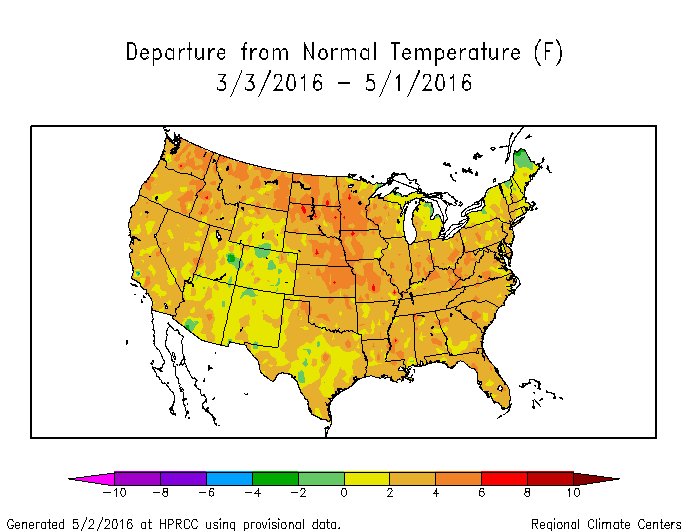
Temperatures were much warmer than normal across the Pacific Northwest during April 2016, enhancing evapotranspiration. The region was also drier than normal. The increased evapotranspiration helped intensify drought-like conditions as seen when the April 1-month SPEI map is compared to the corresponding SPI map. This is also evident on the 3-month SPEI map versus the SPI map.
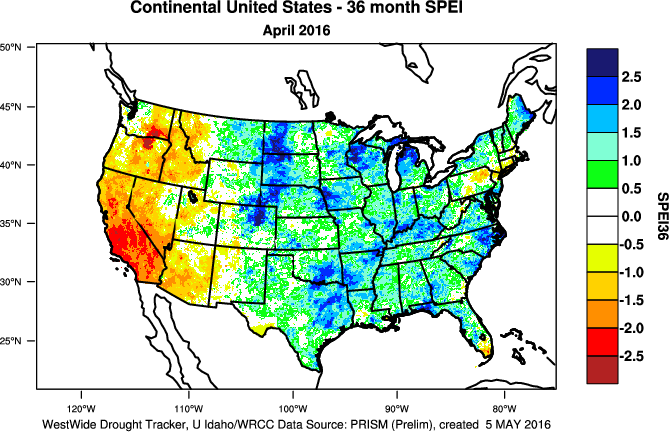
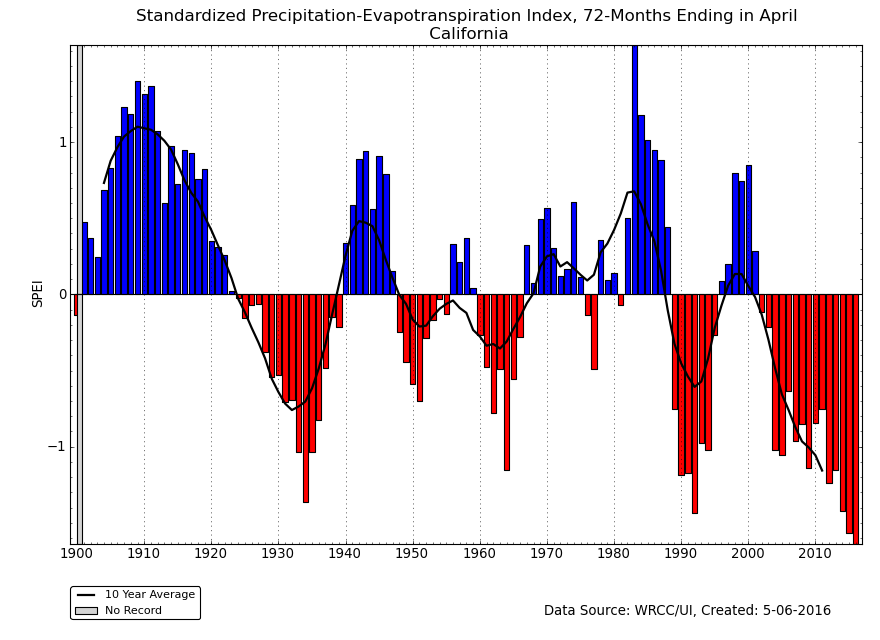
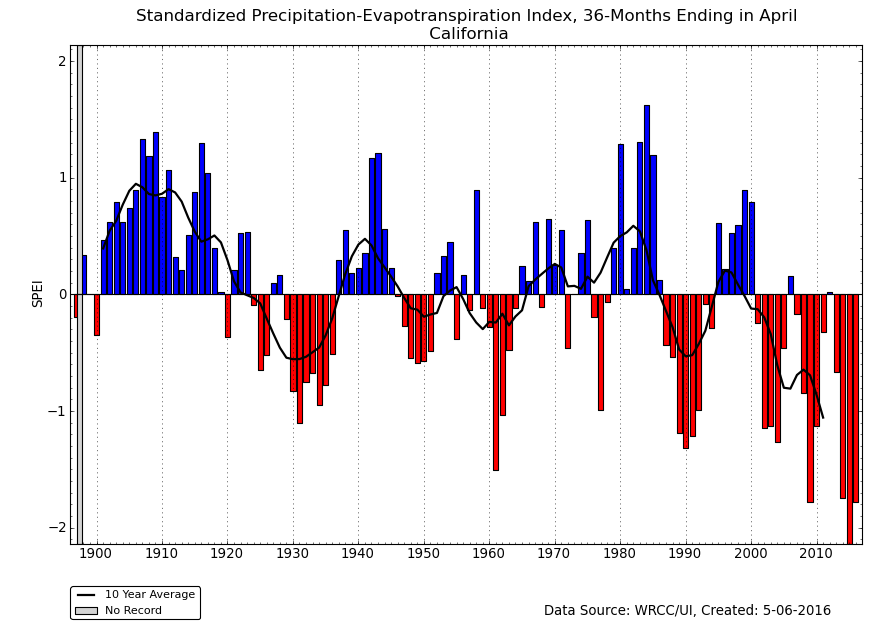
The last 6 (SPEI vs. SPI) to 12 (SPEI vs. SPI) months were unusually wet in most locations, so the SPEI and SPI maps are similar. Significant differences between the SPEI and SPI maps begin to appear in the West at the 24-month time frame (SPEI vs. SPI) and become increasingly significant at the 36-month (SPEI vs. SPI), 48-month (SPEI vs. SPI), 60-month (SPEI vs. SPI), and even 72-month (SPEI vs. SPI) time scales. This is due to persistent above-normal temperatures in the West for the last several years which have increased evapotranspiration and exacerbated drought conditions.
 |
|
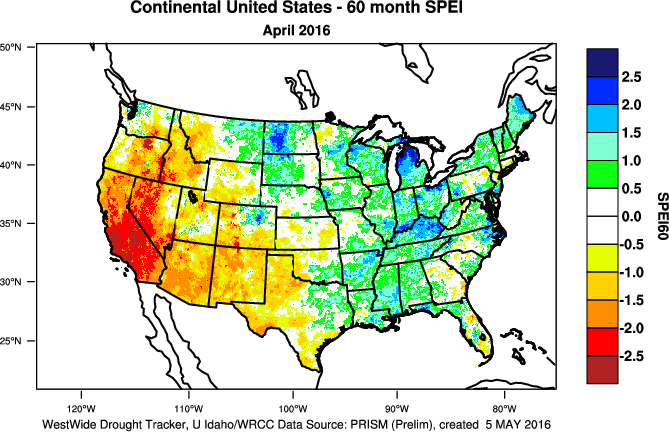 |
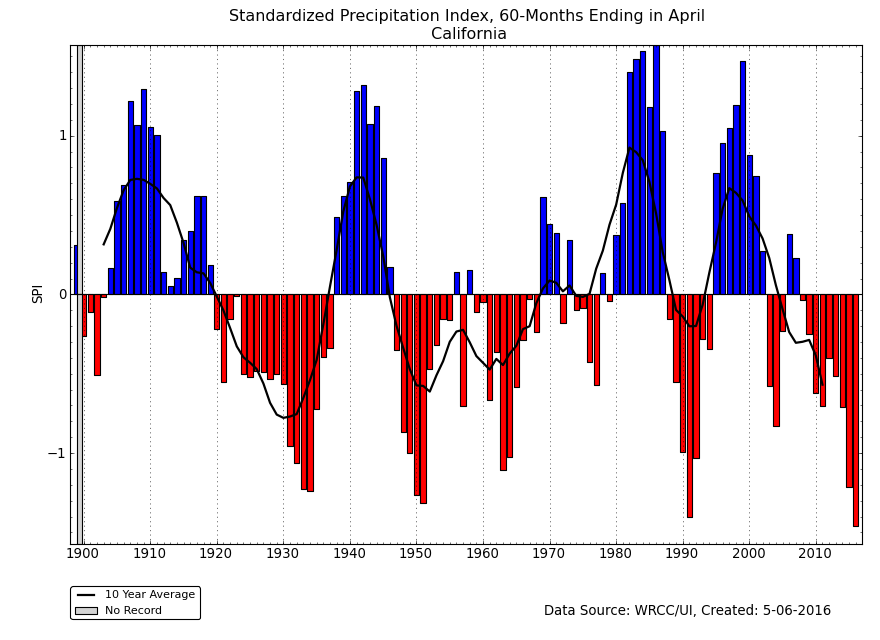
This is especially the case in California, where the last three May-April 12-month periods ranked as the three warmest such periods for the state in the 1895-2016 record, and all three were much warmer than all of the years before them. The last three years cap a period of persistent unusual warmth which has lasted over three decades. The precipitation so far this wet season helped raise California's statewide precipitation rank to 45th wettest for May 2015-April 2016. But the persistent dryness over the last nine years still gave the state the driest SPI for the last 60 months. When the temperature is factored in, California has had the most severe SPEI for the last 60 and 72 months, and second most severe SPEI for the last 36 and 48 months.
 California statewide temperature, May-April, 1895-2016.
|
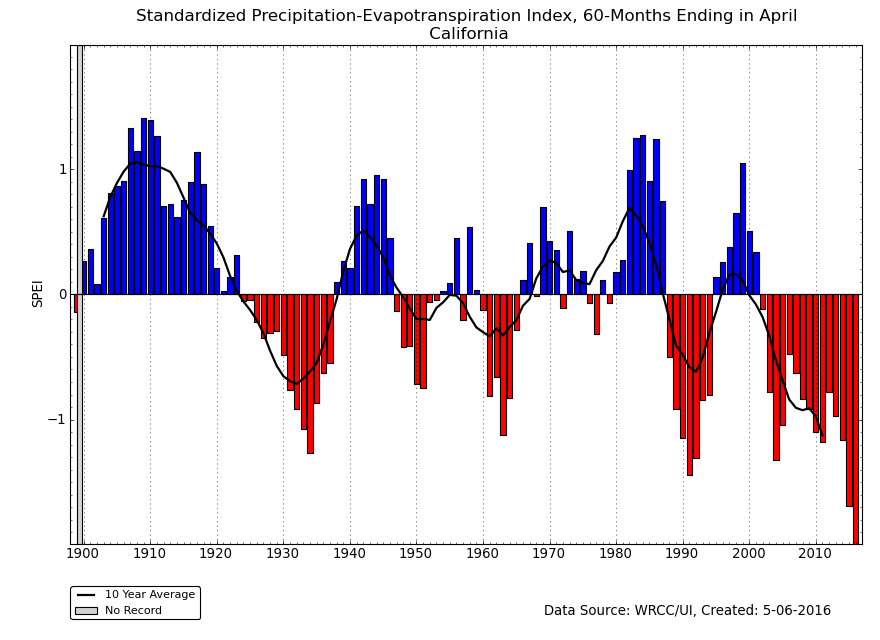 California statewide 60-month SPEI for April, 1895-2016.
|
Regional Discussion
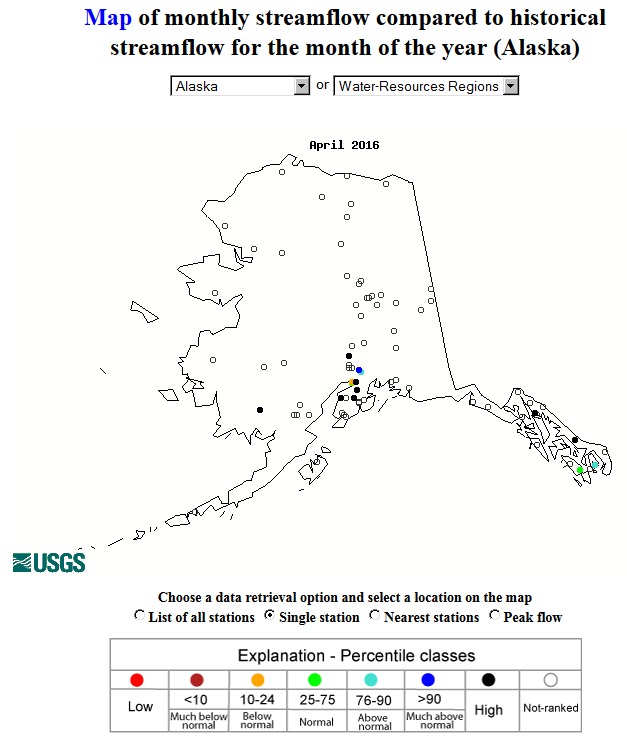
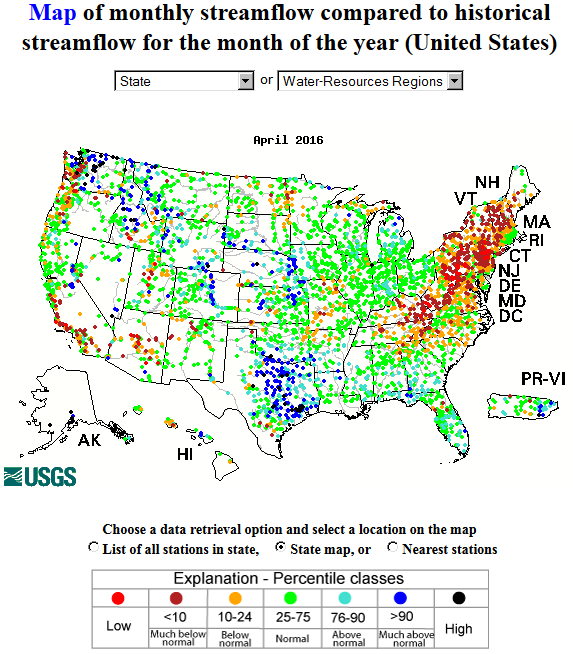 Monthly streamflow
|
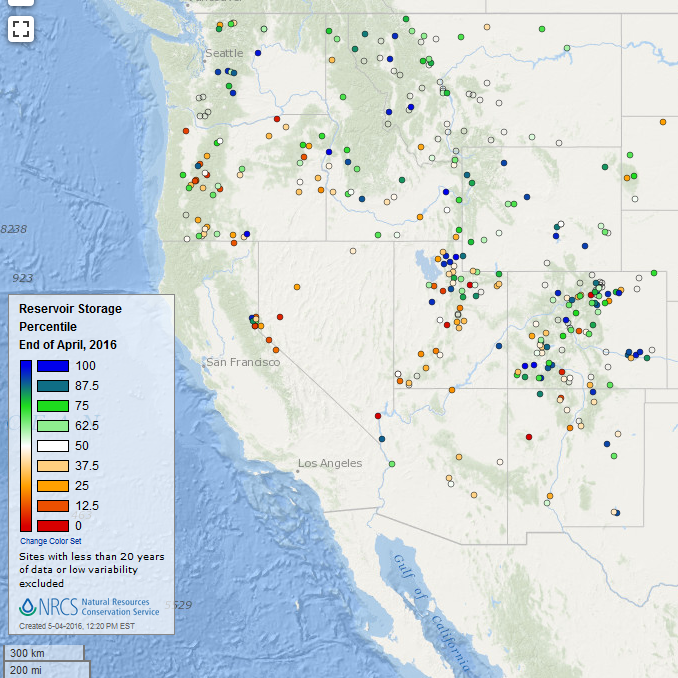
 Statewide reservoir storage
|
CONUS Agricultural & Hydrological Impacts:
Drought conditions were still reflected in numerous agricultural, hydrological, and other meteorological indicators, both observed and modeled. As of May 3rd, 10 percent of the nation's cattle inventory, eight percent of the nation's hay, 3 percent of winter wheat production, and less than one percent of corn and soybean production were in drought. These percentages increased as April wore on, reaching a peak on April 12th (winter wheat peaked at 22%, cattle 19%, hay 12%, corn 6%, and soybeans 5%), then fell sharply as beneficial rains fell during the second half of April. Except for hay, the end-of-April values are all decreases compared to the end of March.
Soil moisture reflected these trends. According to U.S. Department of Agriculture (USDA) reports, topsoil and subsoil moisture dried considerably in the eastern CONUS as April progressed. In West Virginia, 43 percent of the topsoil was short or very short of moisture (dry to very dry) on April 17th, increasing to 51 percent by April 24th. In Virginia, those numbers increased from 25 percent on the 17th to 49 percent on the 24th. In Pennsylvania, topsoil short or very short increased from 15 percent to 39 percent, and in Connecticut from 15 percent to 44 percent. On April 24th, subsoil moisture was short or very short in 45 percent of West Virginia, 36 percent of Connecticut, 32 percent of Virginia, and 28 percent of Pennsylvania. Rain near the end of April and beginning of May improved soil moisture in some areas. As of May 1st, the numbers had dropped to 39 percent for topsoil in Virginia, 31 percent for topsoil in West Virginia, 27 percent for topsoil in Connecticut, and 24 percent for topsoil in Pennsylvania. Subsoil moisture conditions also improved, but not by as much. Rain in the Plains the last half of the month improved soil moisture considerably. By April 17th, 43 percent of the topsoil was rated short or very short of moisture in Texas, 41 percent in Kansas, 38 percent in Oklahoma, 31 percent in Missouri, and 30 percent in Nebraska. By May 1st, the numbers had dropped to 31 percent in Texas, 25 percent in Oklahoma, 11 percent in Kansas and Missouri, and 7 percent in Nebraska. Nationwide, as of May 1st, 13 percent of the nation's topsoil and 14 percent of the subsoil was short or very short of moisture, an improvement from values of 22 percent for topsoil and 19 percent for subsoil at mid-month.
Pastures and rangeland have not responded as quickly to the precipitation as the soil moisture. As of May 1st, pastures and rangeland were in poor to very poor condition across 68 percent of Connecticut and Maine, 55 percent of Vermont, 36 percent of Virginia, and 25 percent of West Virginia. Nationwide, ten percent of pastures and rangeland were in poor to very poor condition.
Drought conditions at the end of the month, as depicted on the May 3rd USDM map, included the following CONUS core drought and abnormally dry areas:
- Moderate (D1) drought covered a large part of the western U.S., with to severe (D2) to exceptional (D4) drought extending from California into Nevada. —
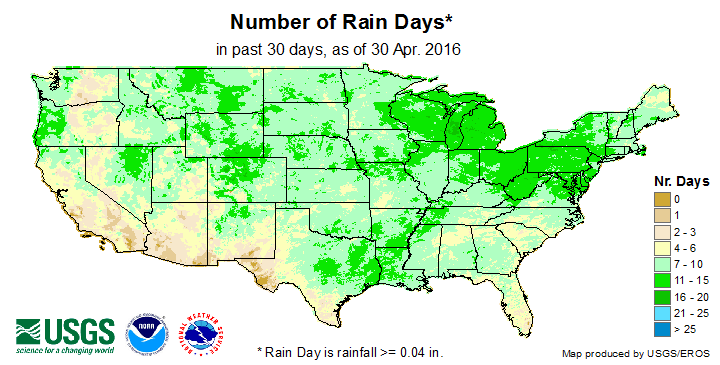
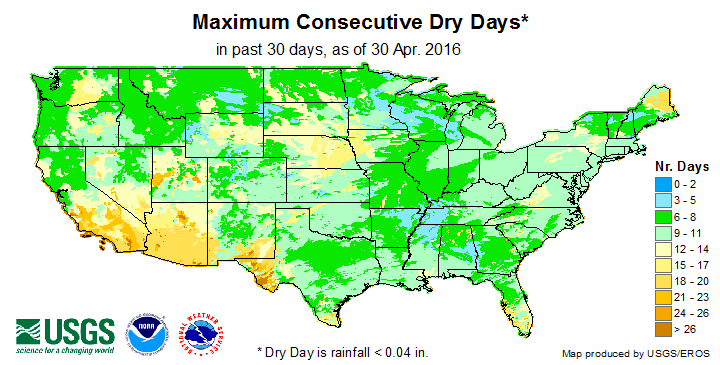
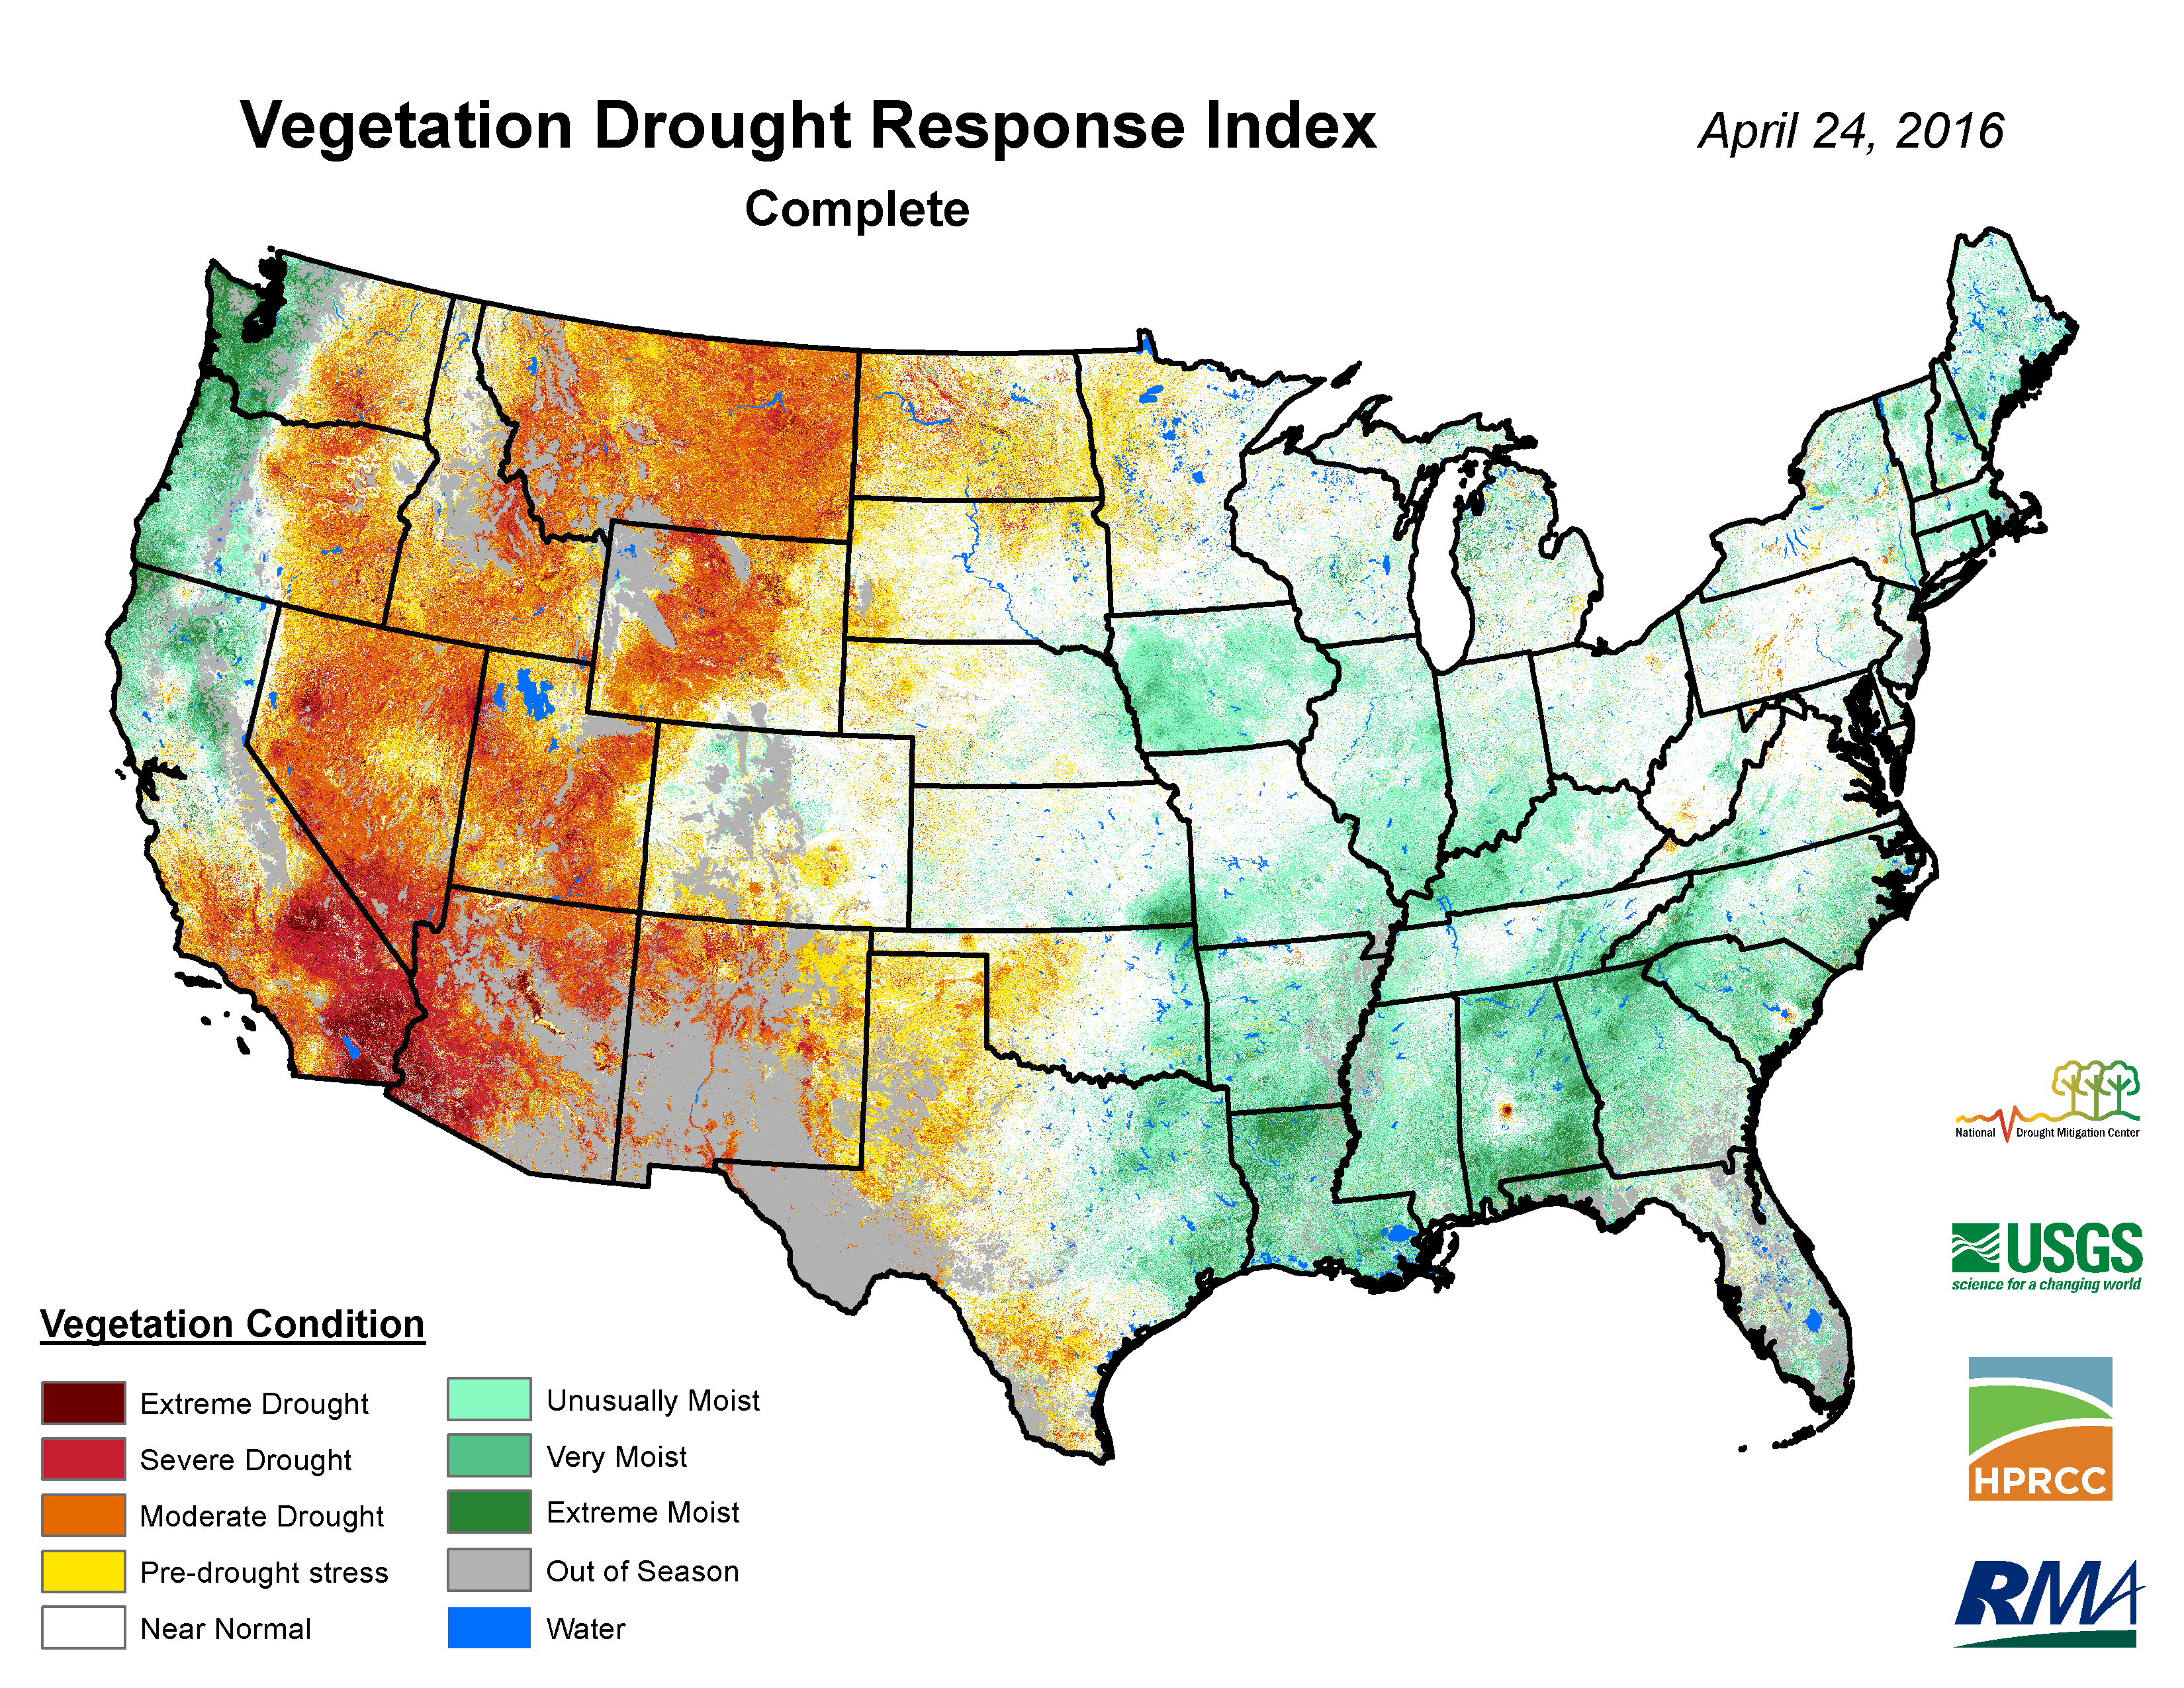
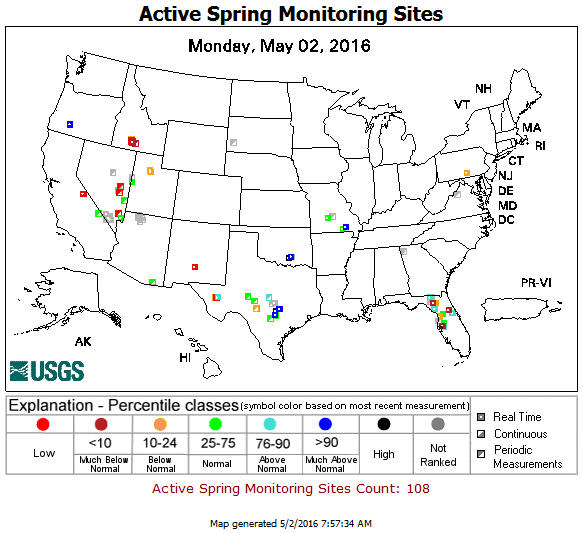
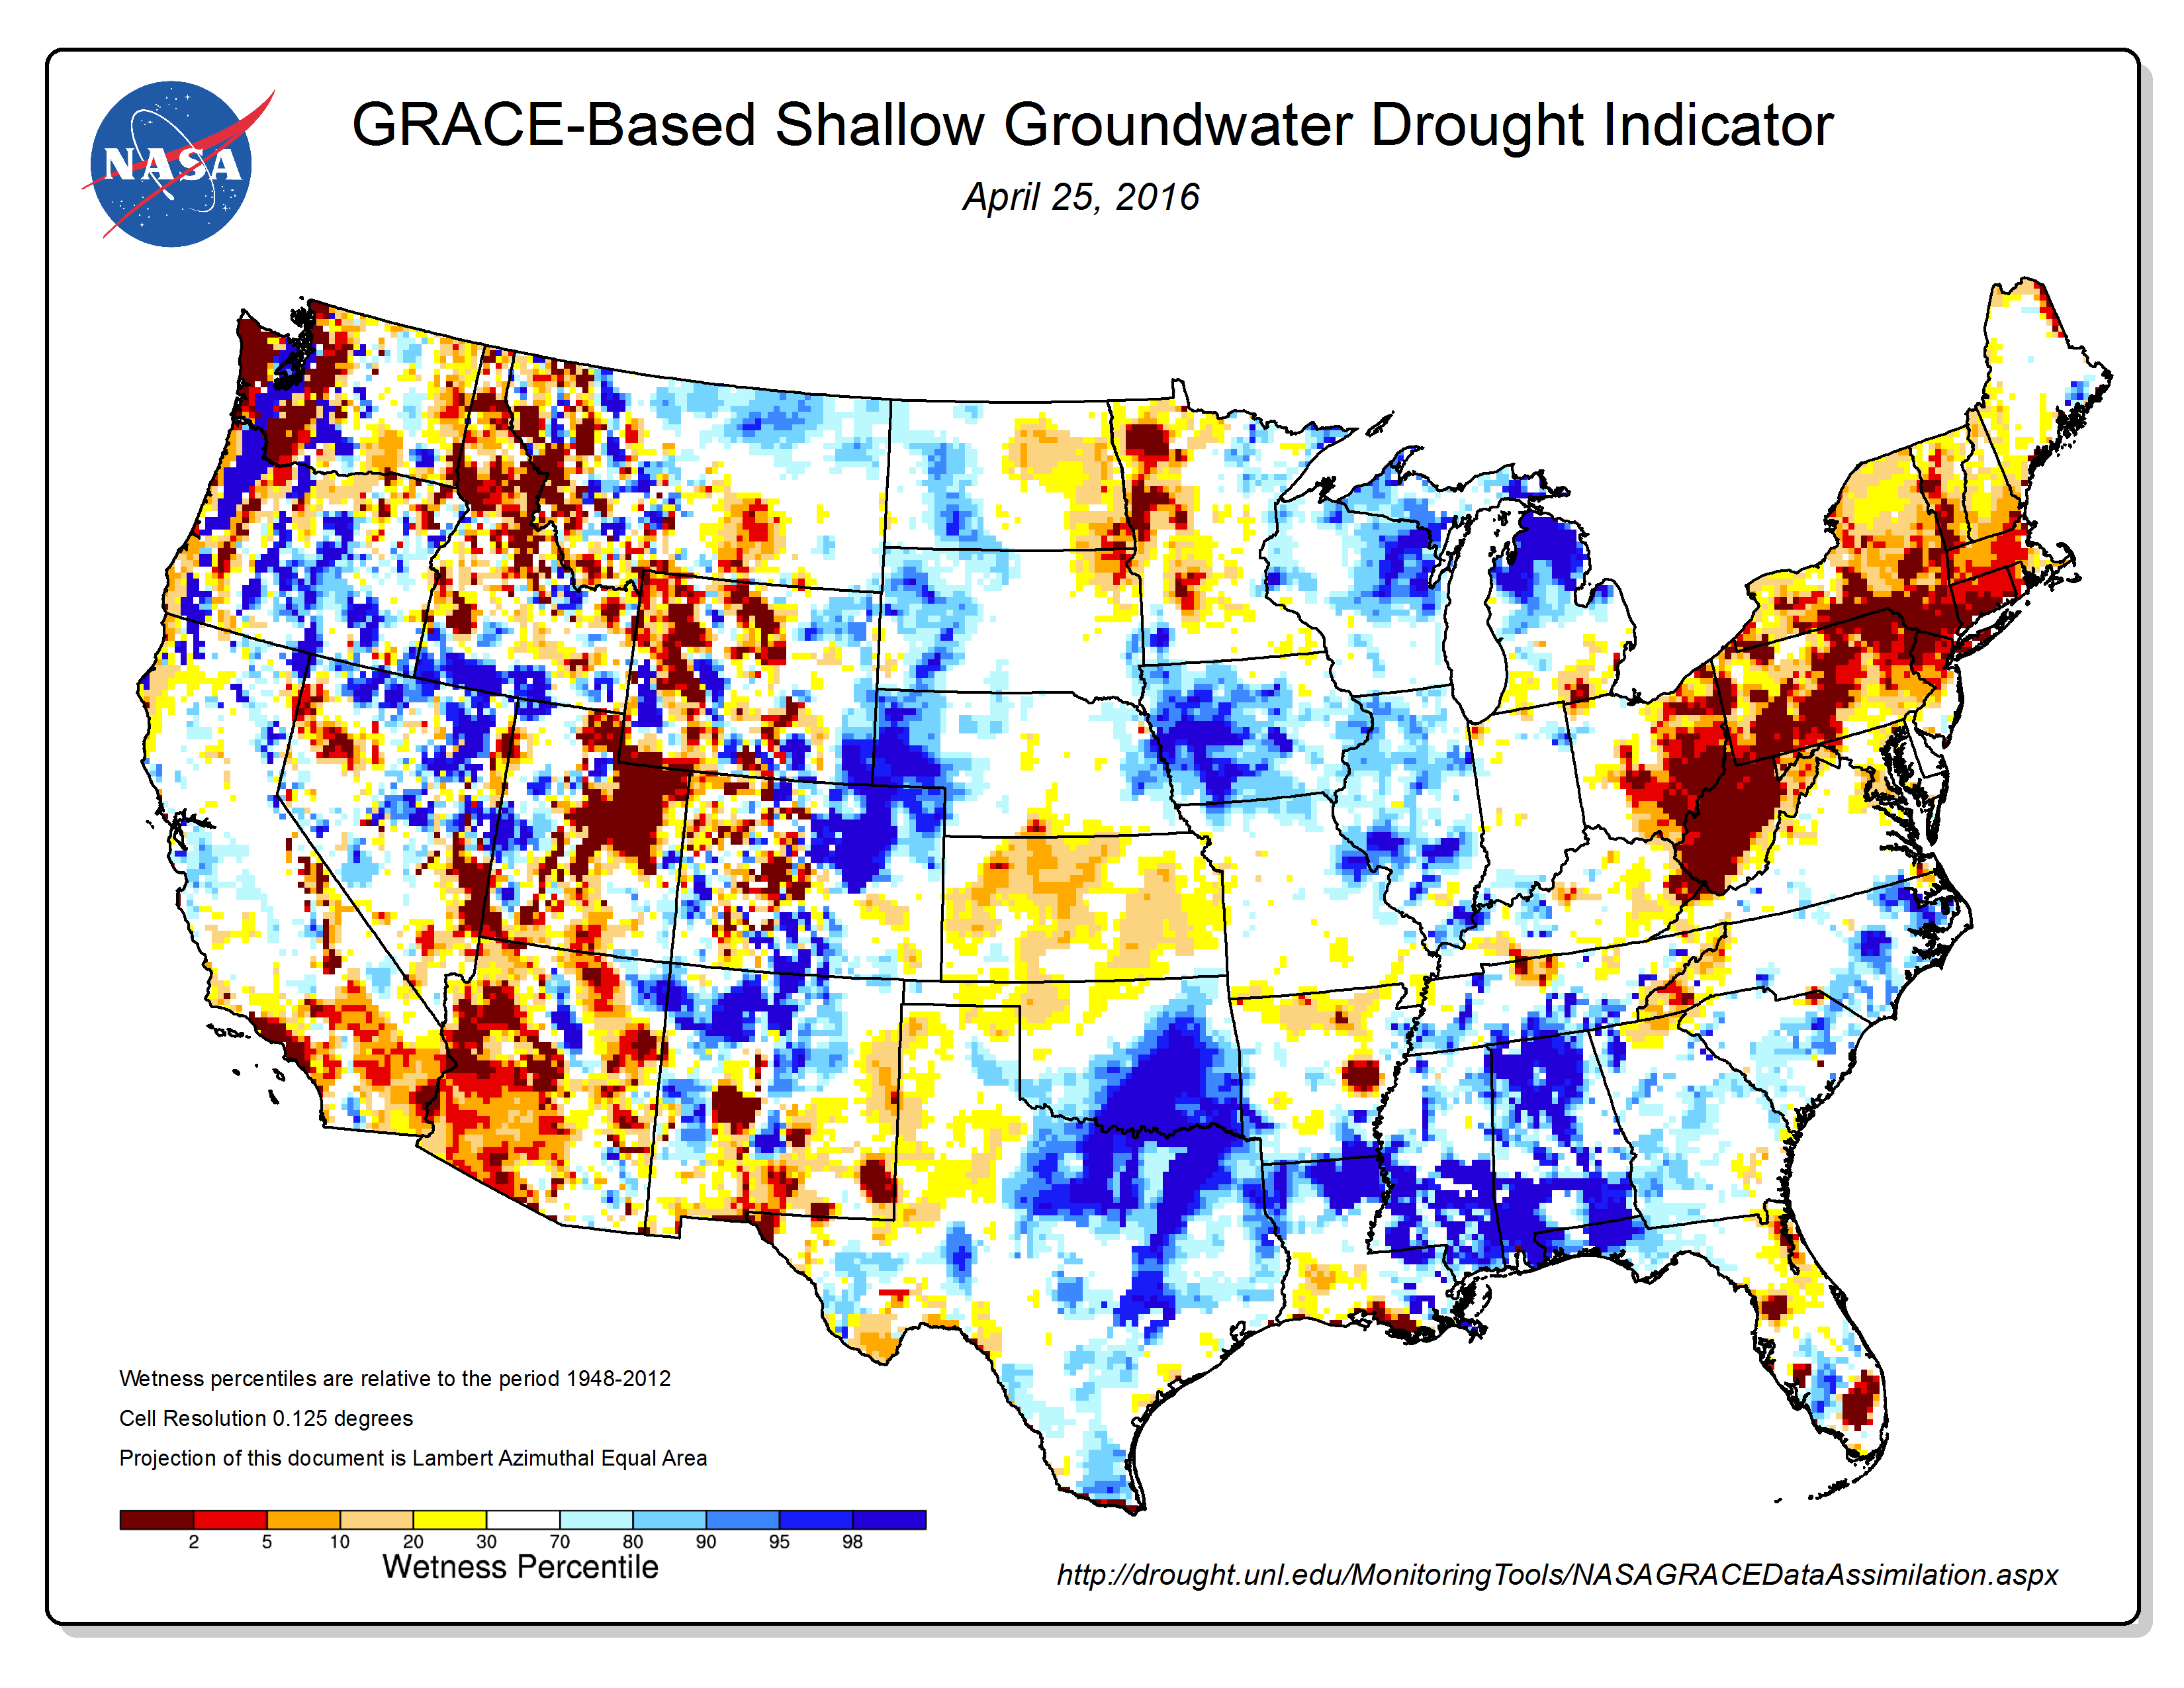
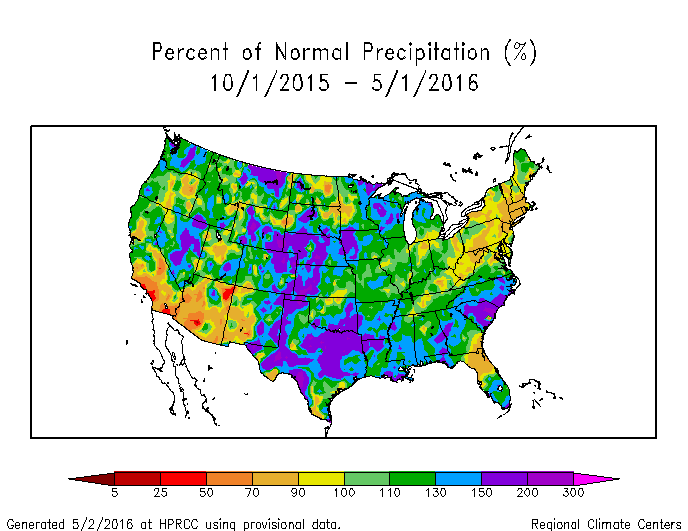
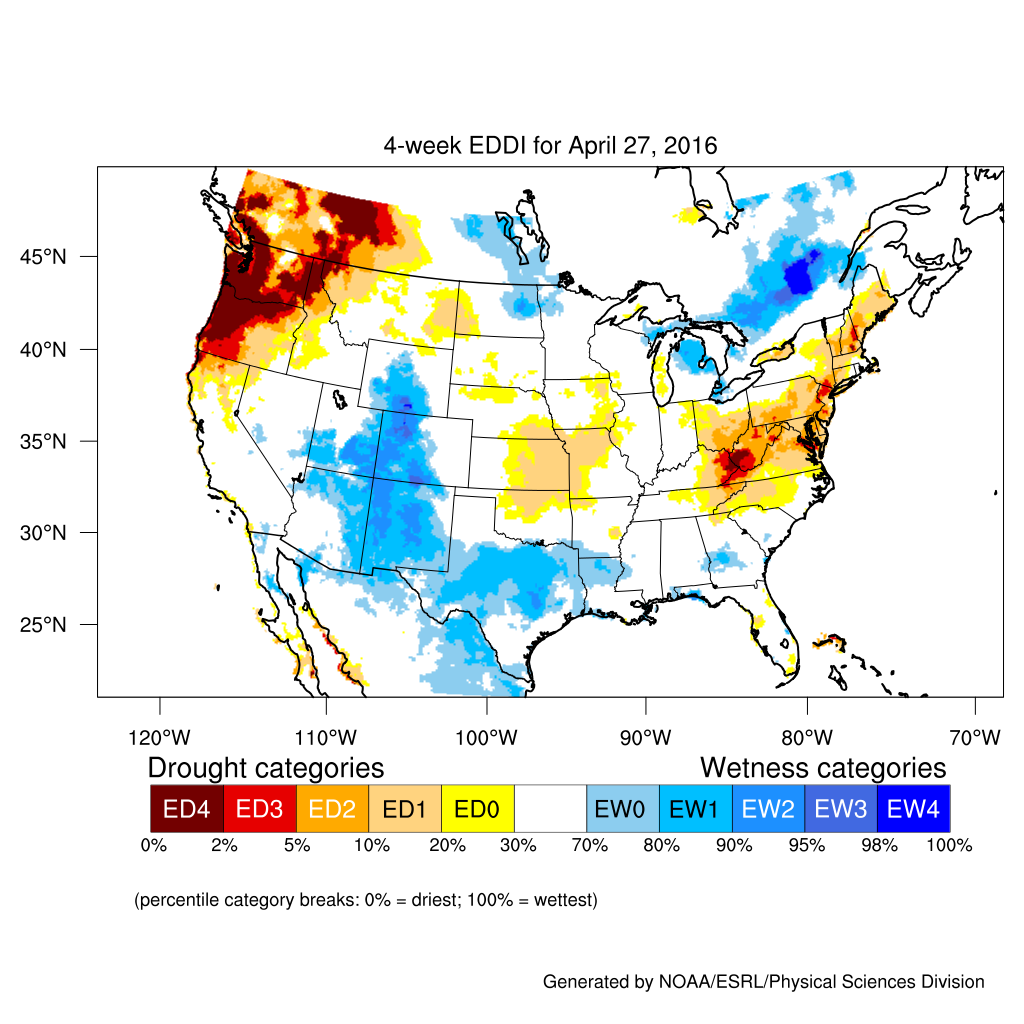
- April 2016 was characterized by below-normal precipitation across much of the Pacific Northwest and California, and above-normal precipitation from the Southwest to Rockies. The interior Northwest and the Southwest along the Mexican border also had few days with precipitation and long runs of consecutive dry days. The VegDRI tool showed vegetative impacts from drought still widespread across the interior West. Some springs and groundwater levels were still low in parts of the West. Water-year-to-date (October 1, 2015-present) precipitation has been below normal for parts of the Southwest but above-normal for much of the rest of the West. Reservoir levels have recovered in parts of the West, including northern California. But they were still below average in southern California and, on a statewide basis, in Arizona, Nevada, and New Mexico. They were near to below average in Utah and Oregon, and near to above average in Colorado, Idaho, Montana, Washington, and Wyoming. Some streamflow levels were low due to recent dryness (in the coastal Northwest) and long-term dryness (in the Southwest). Much-above-normal temperatures have melted the mountain snowpack earlier than usual, especially in the Northwest and Northern Rockies, although the snowpack was still above normal in parts of the Sierra Nevada and Central Rockies. Based on the Evaporative Demand Drought Index (EDDI), evaporative demand was above average in the Northwest.
- Abnormally dry to moderate drought conditions contracted in parts of the Northern Plains and Southern Plains. —
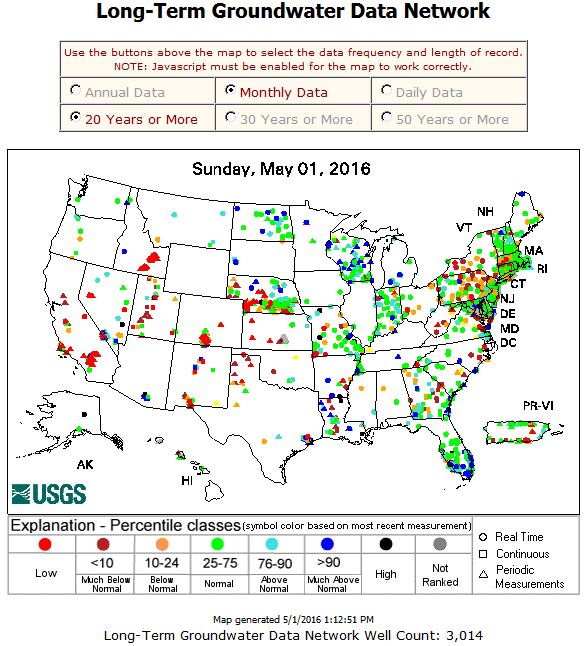
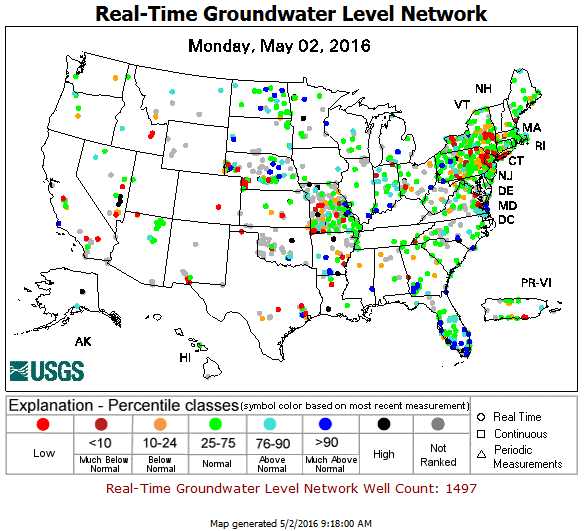
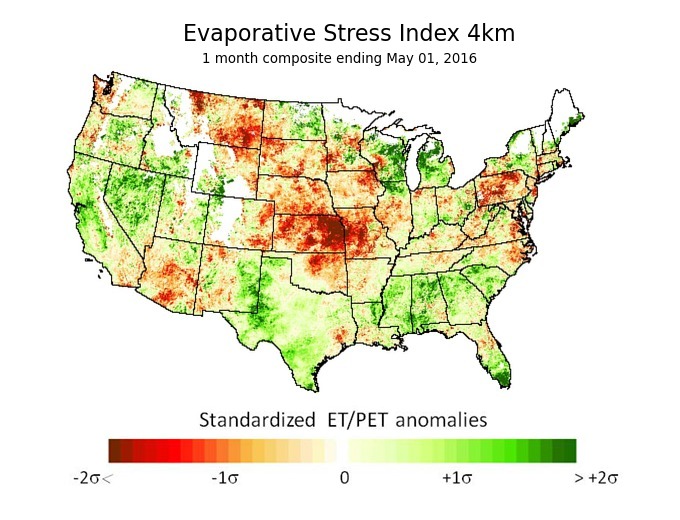
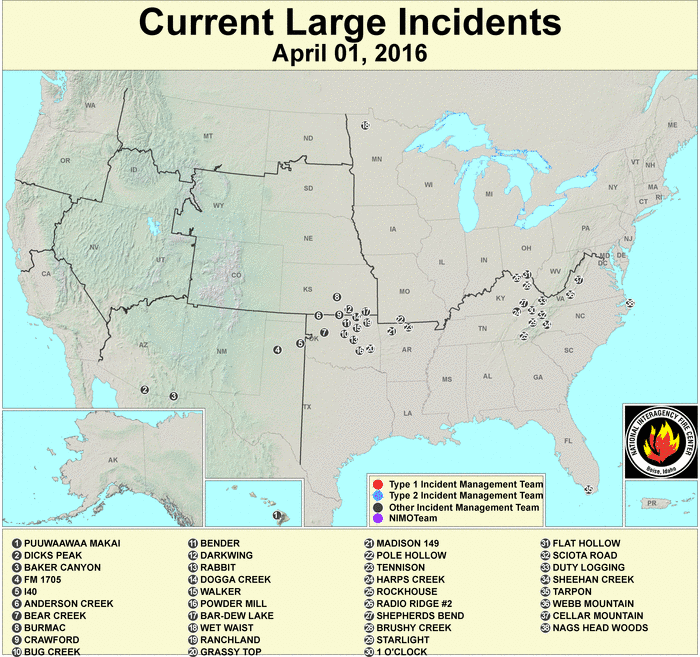
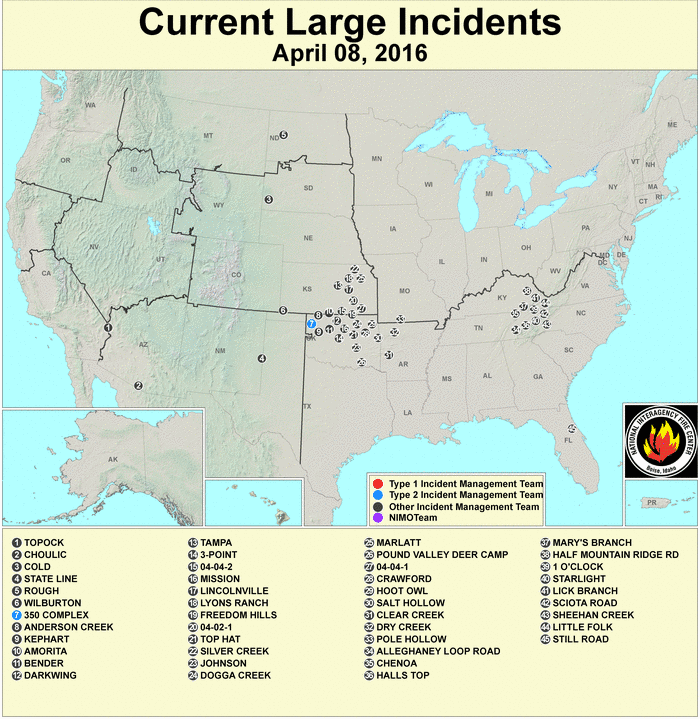
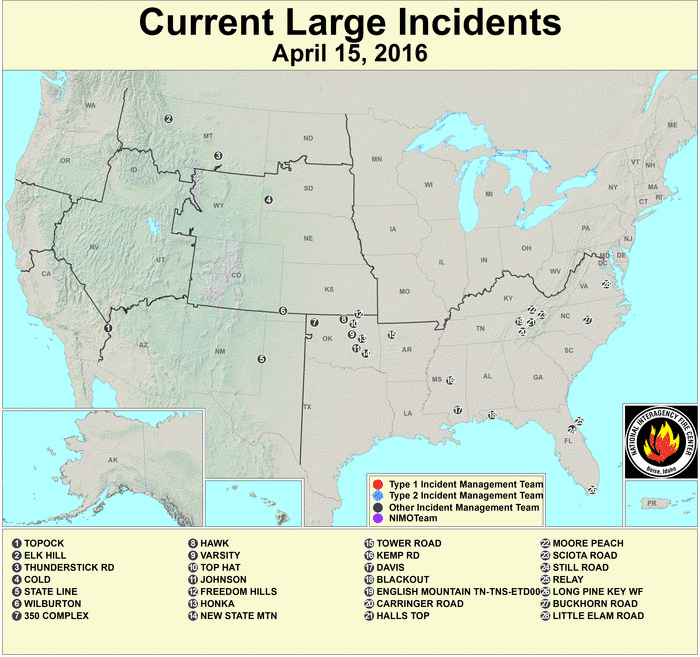
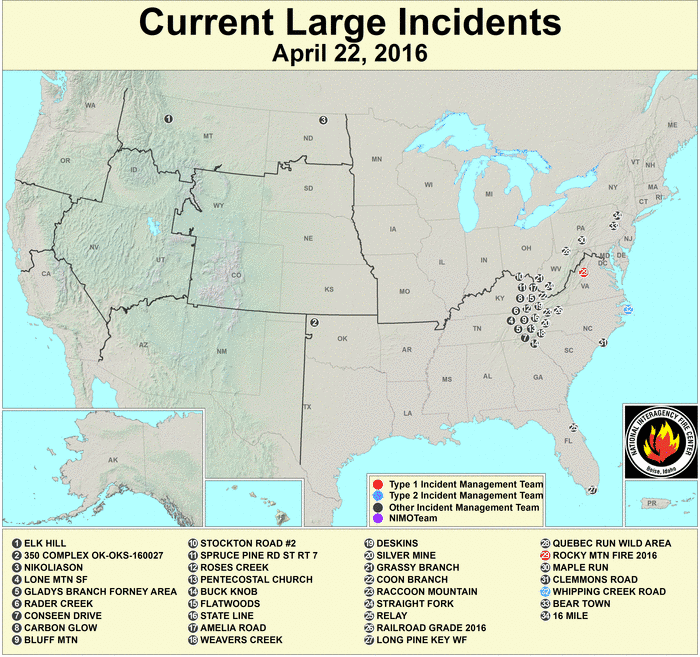
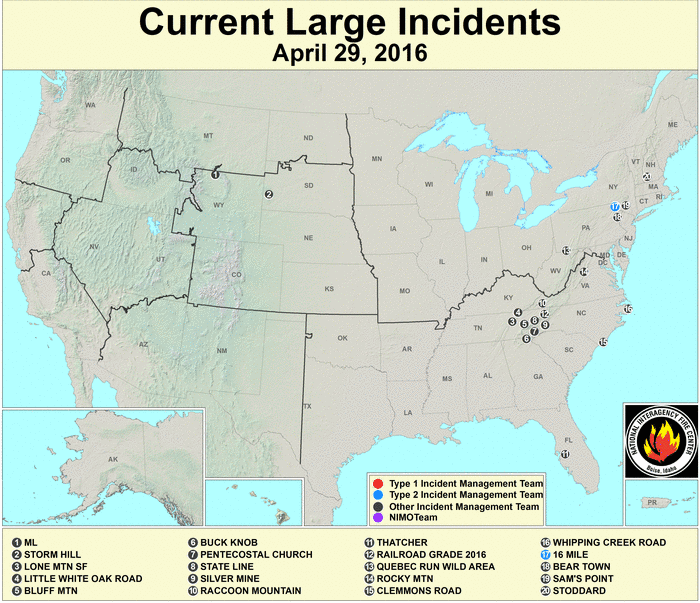
- However, groundwater levels were still low in parts of the Plains. Based on the Evaporative Demand Drought Index (EDDI) and Evaporative Stress Index (ESI), evaporative stress from warmer-than-normal temperatures and dryness earlier in April and during the previous three months occurred in the Central Plains and parts of the northern High Plains. A satellite-based soil moisture index showed dry soils stretching from the Northern Plains in the CONUS to the western Prairies of Canada. Numerous large wildfires, that had been burning across Oklahoma at the beginning of the month, continued until widespread heavy rainfall during the last half of April helped to extinguish them by month's end (maps for 1, 8, 15, 22, 29).
- Abnormal dryness and drought expanded in parts of the Southeast, Midwest, and Northeast. —
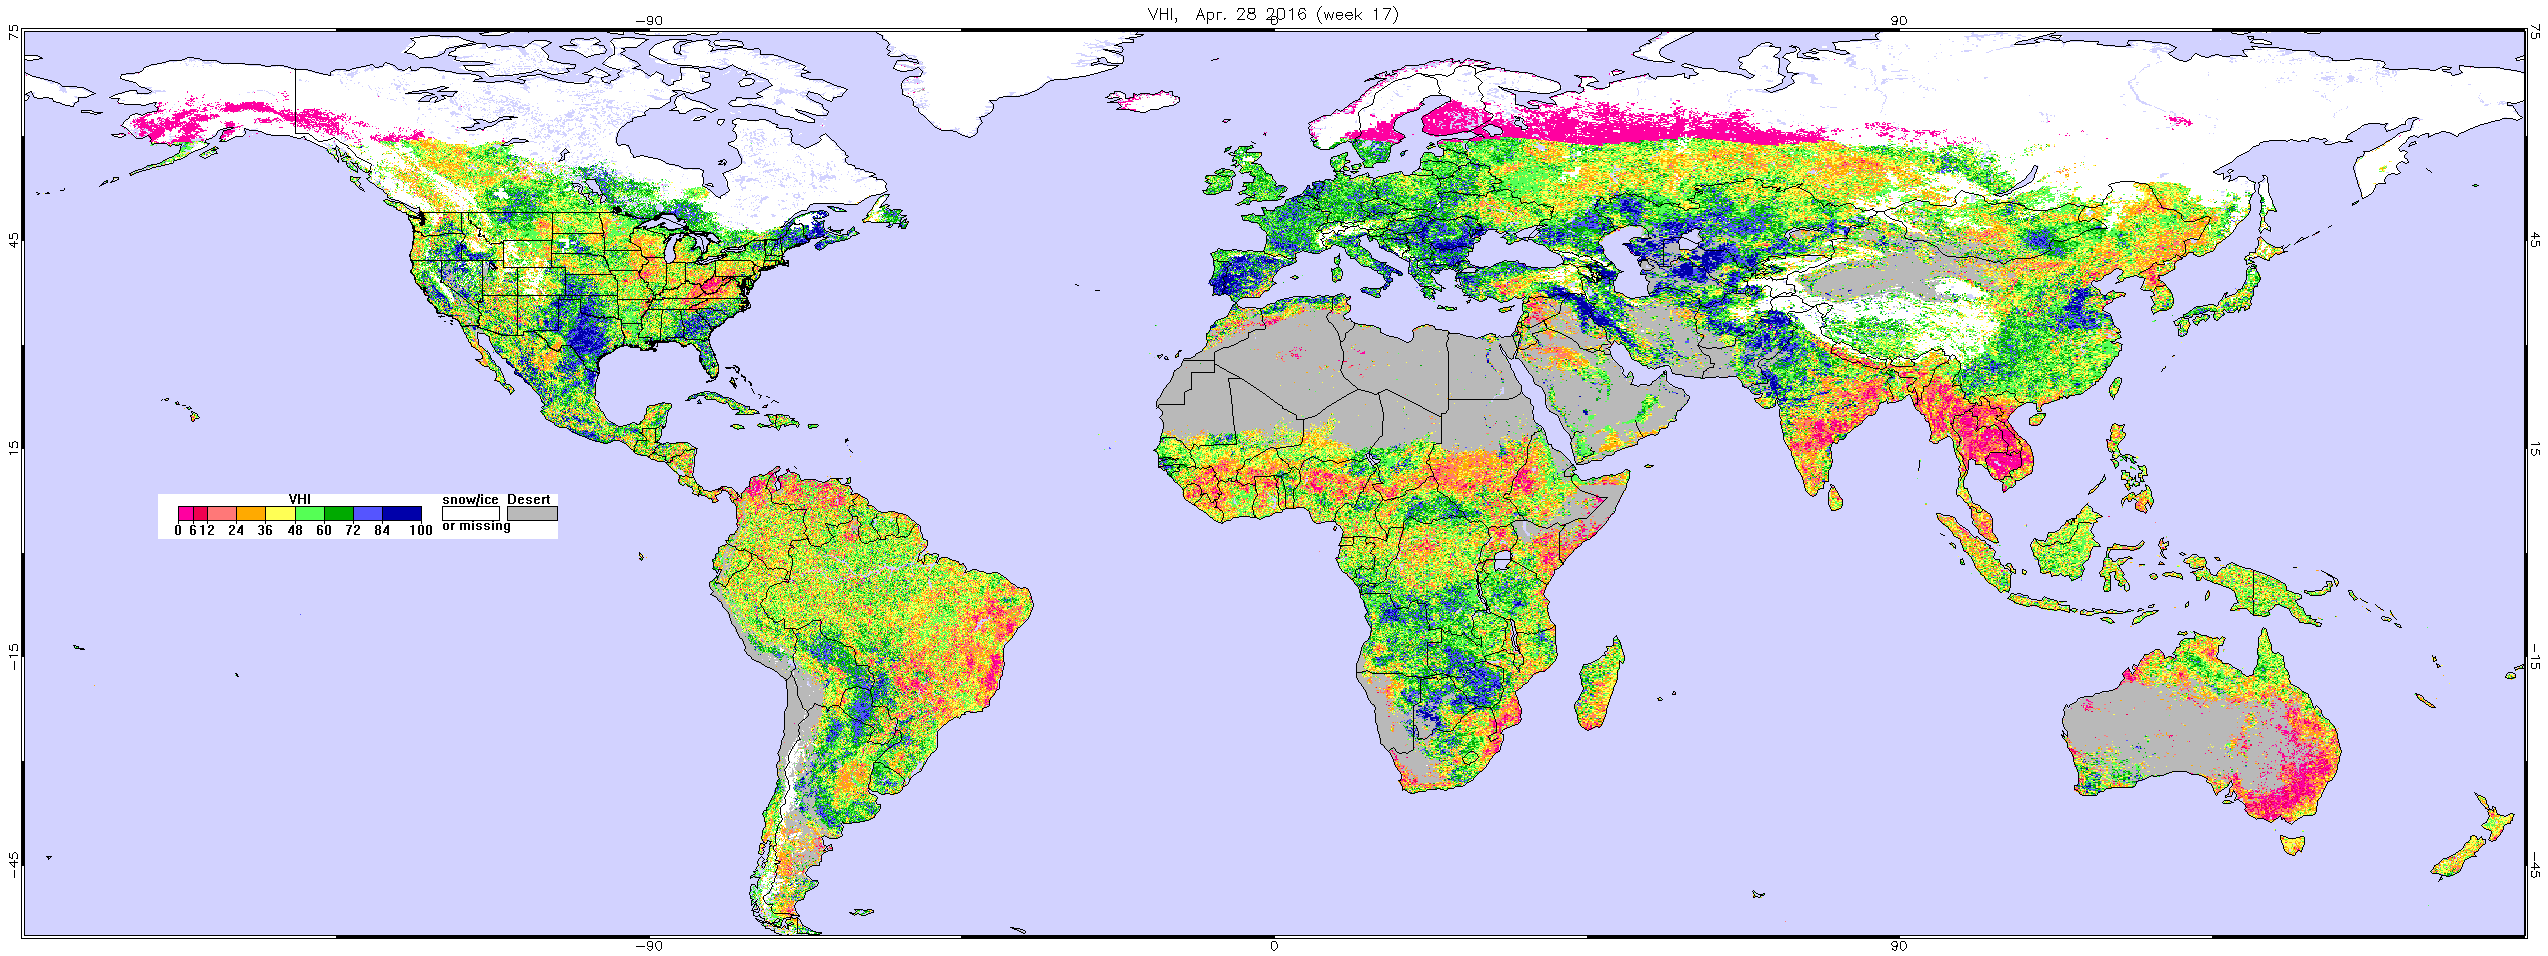
- April 2016 was drier than normal across much of the East and part of the Midwest, and wetter than normal in just part of the coastal Southeast. The dryness in the East has been persistent from the Southern Appalachians to New England for much of January-April, but especially during the last two months. Groundwater levels were low in parts of the East, especially from the Central Appalachians to New England. The prolonged below-normal precipitation since the first of the year contributed to widespread low to record low streamflow levels from the Southern Appalachians to New England. Based on the Evaporative Demand Drought Index (EDDI), evaporative demand was above average from the Appalachians to New England, with evaporative stress (based on the ESI, Evaporative Stress Index) occurring in Pennsylvania. The satellite-based Vegetative Health Index (VHI) indicated vegetative stress developed in the Central Appalachians, coinciding with the epicenter in West Virginia of low soil moisture observed by the USDA. By the end of the month, soil moisture models and a satellite-based soil moisture index still showed low soil moisture levels across much of the Southeast to New England. Conditions improved as beneficial rains fell during early May. Persistent intense dryness in the Southeast during much of April contributed to the development of widespread large wildfires in and around the Southern Appalachians (maps for 1, 8, 15, 22, 29).
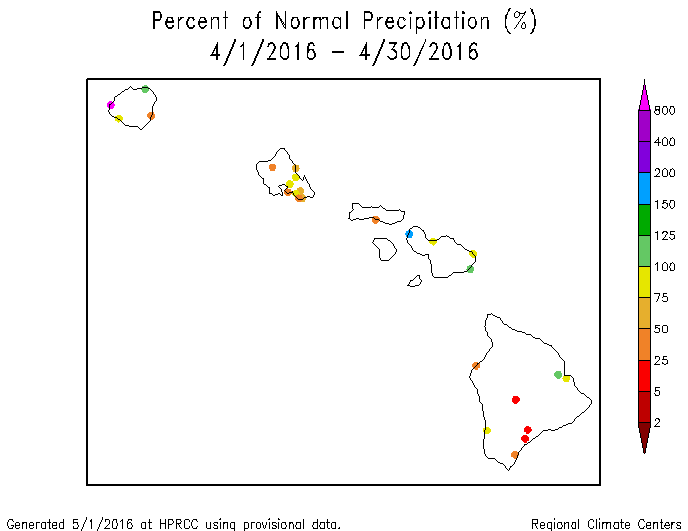
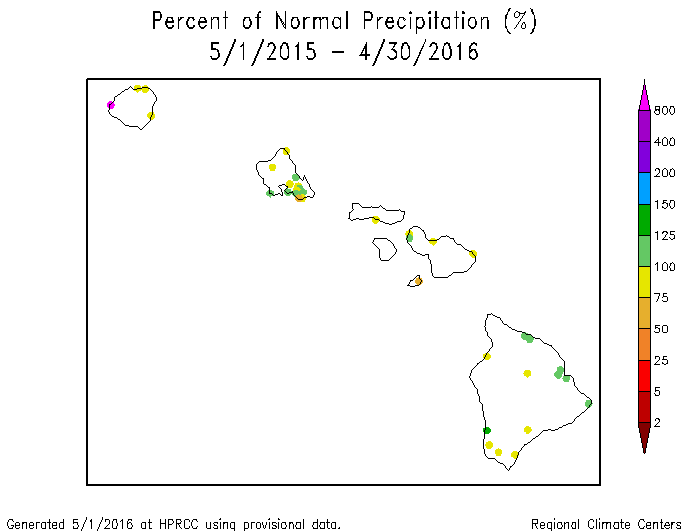
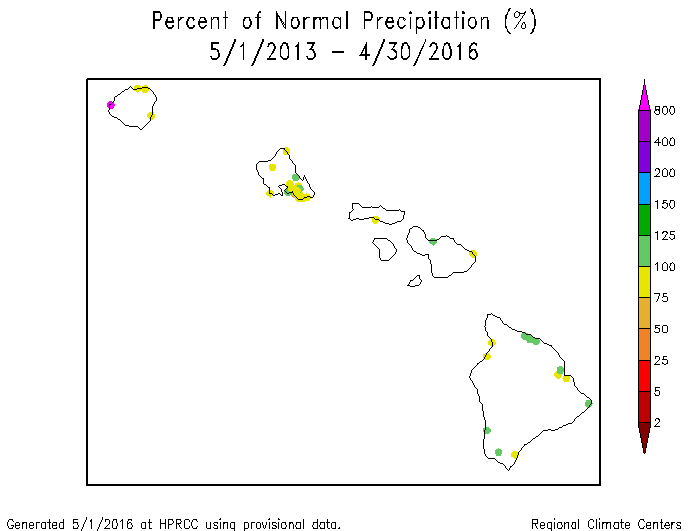
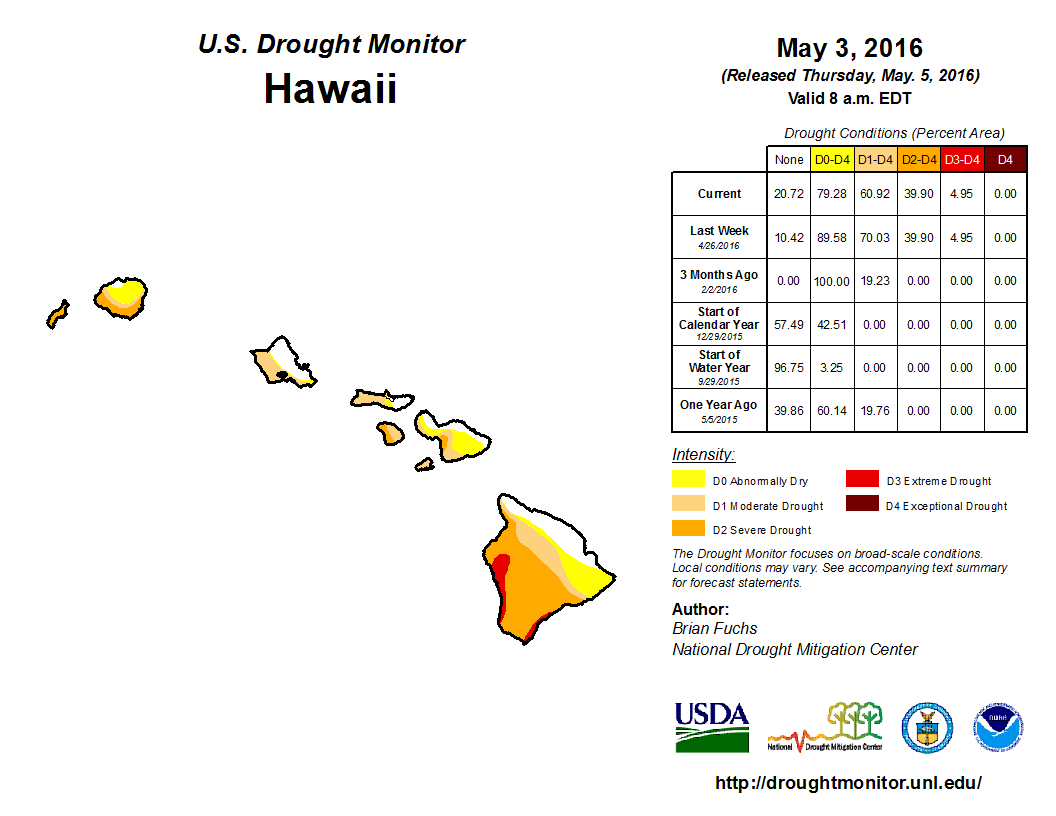
Hawaii: April 2016 had a mixed precipitation anomaly pattern across much of Hawaii, but it was not enough to eliminate rainfall deficits which have built up over the previous six months (precipitation anomaly maps for the last 2, 3, 4, 6, and 7 months). A mixed precipitation anomaly pattern is evident at the longer time scales (last 10, 12, 24, and 36 months). Streamflow was low on some islands, with vegetation and agricultural impacts evident. Moderate drought contracted to cover about 61 percent of the state, with severe drought down to about five percent, according to the May 3rd USDM map.
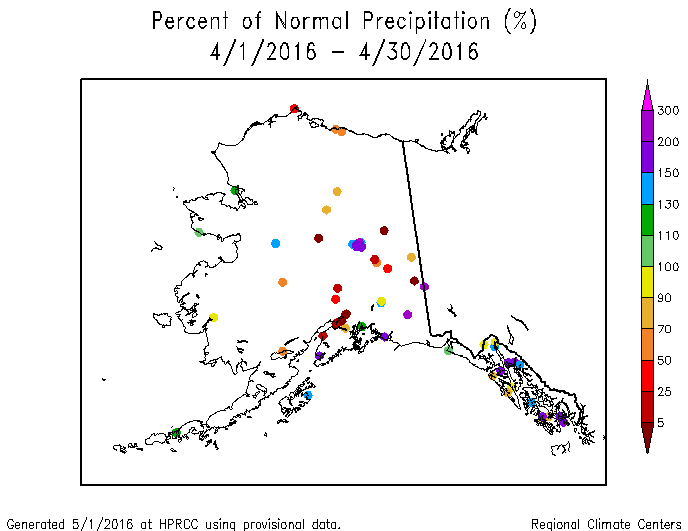
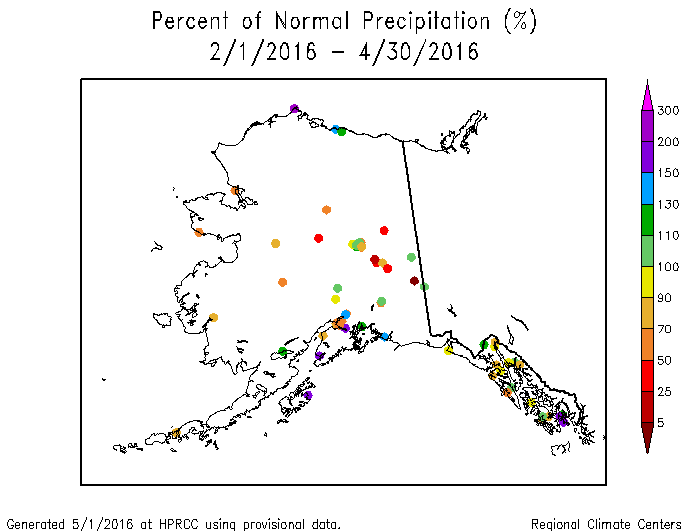
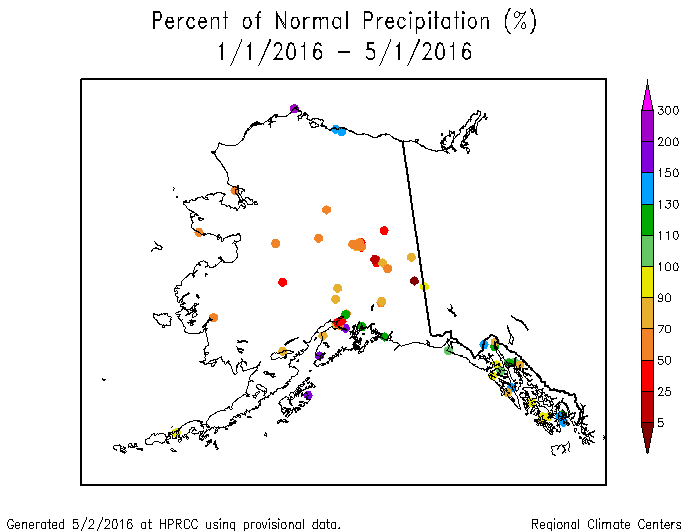
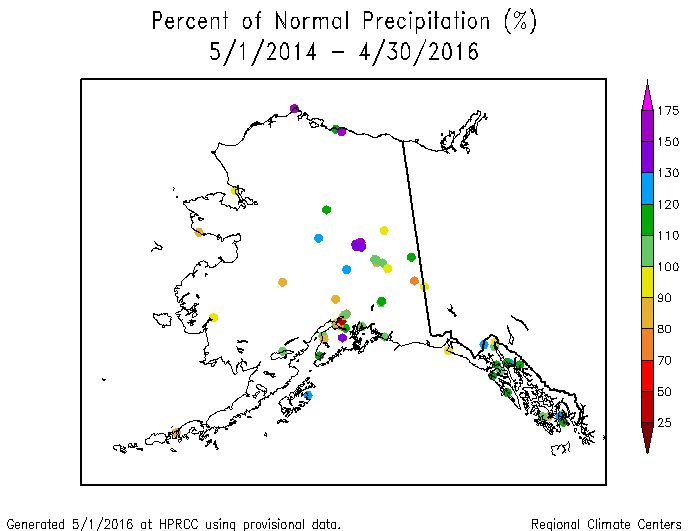
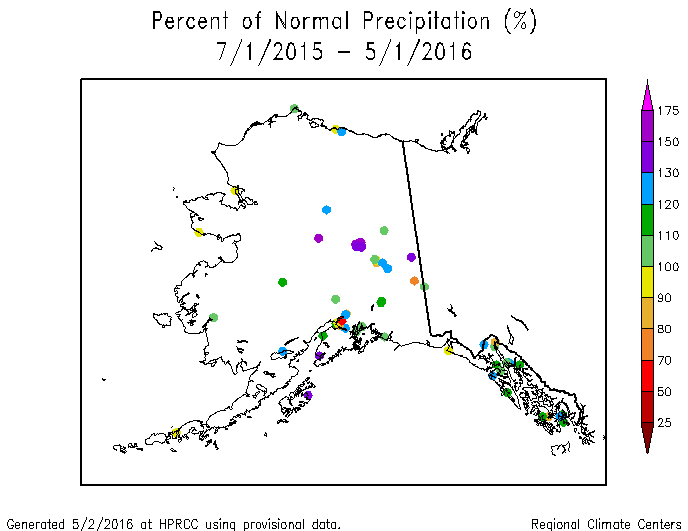
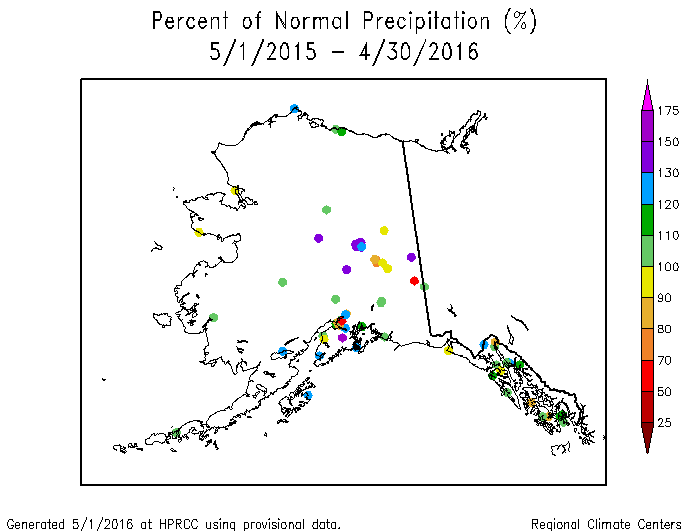
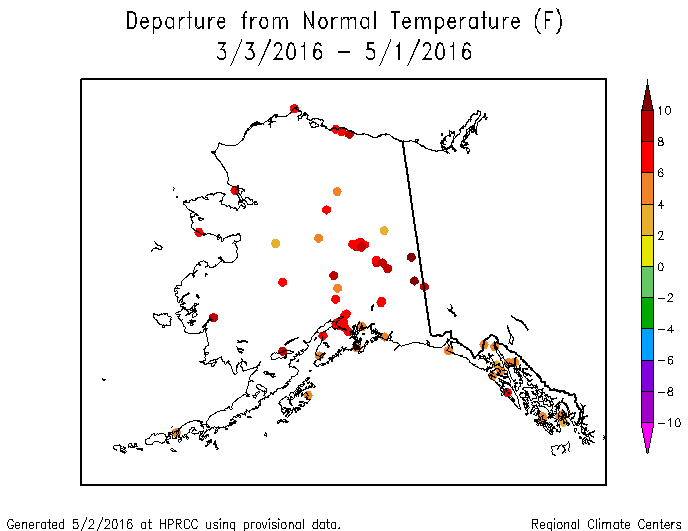
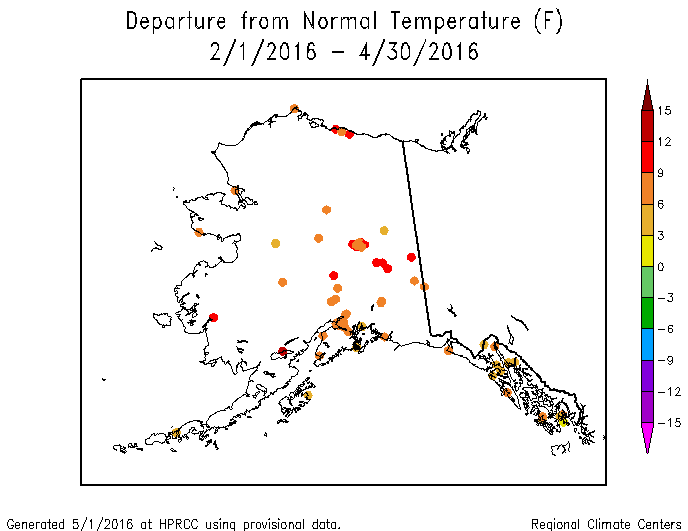
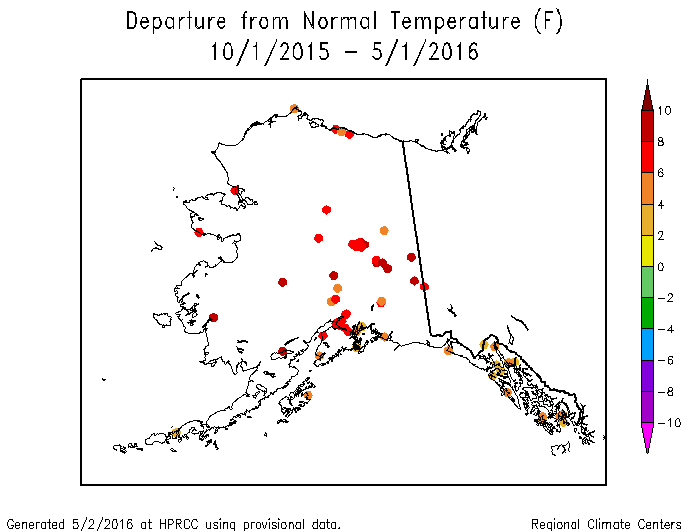
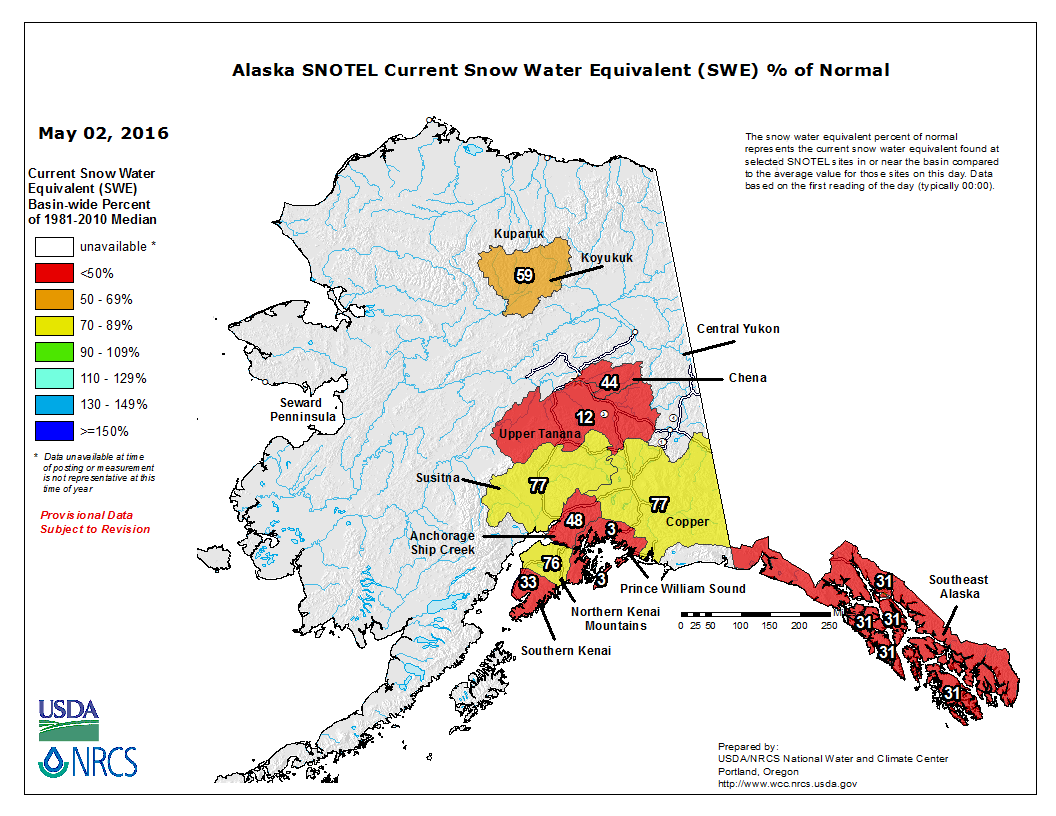
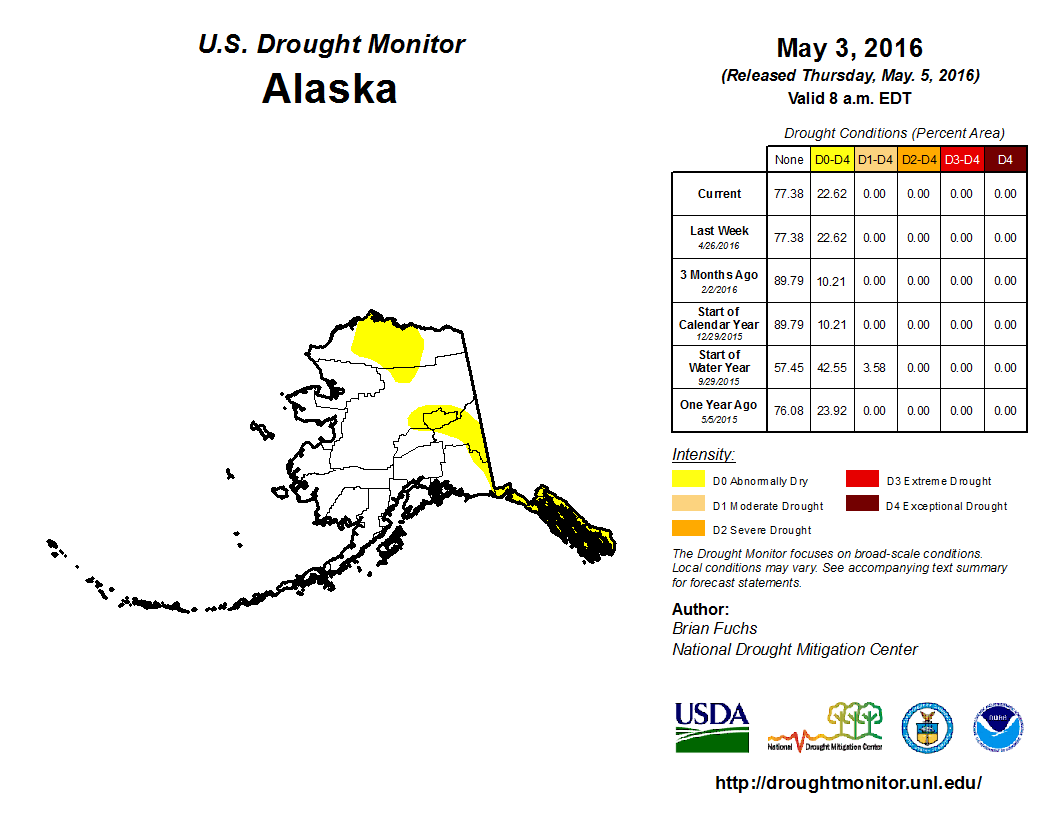
Alaska: A mixed precipitation pattern dominated Alaska in April. The pattern was mixed for the last two months. But at three months, a pattern emerged of wetter than normal along the southern coast and drier than normal in the west and north. The dryness in the interior intensified for the year to date (January-April), but the pattern became mixed again at longer time scales (climate division map for November-April, station maps for the last 6, 7, 24, and 36 months). Wetter-than-normal conditions dominated at the 10- to 12-month time scales. Warmer-than-normal temperatures have dominated for the last 12 months on both the climate division (last 1, 3, 4, 6, 12 months) and station (last 1, 2, 3, 4, 7, 12 months) analyses. The persistent warmer-than-normal temperatures have melted the snowpack earlier than usual, resulting in below-normal snowpack water content for this time of year and increased streamflow. Abnormal dryness expanded to about 23 percent of the state on the May 3rd USDM map.
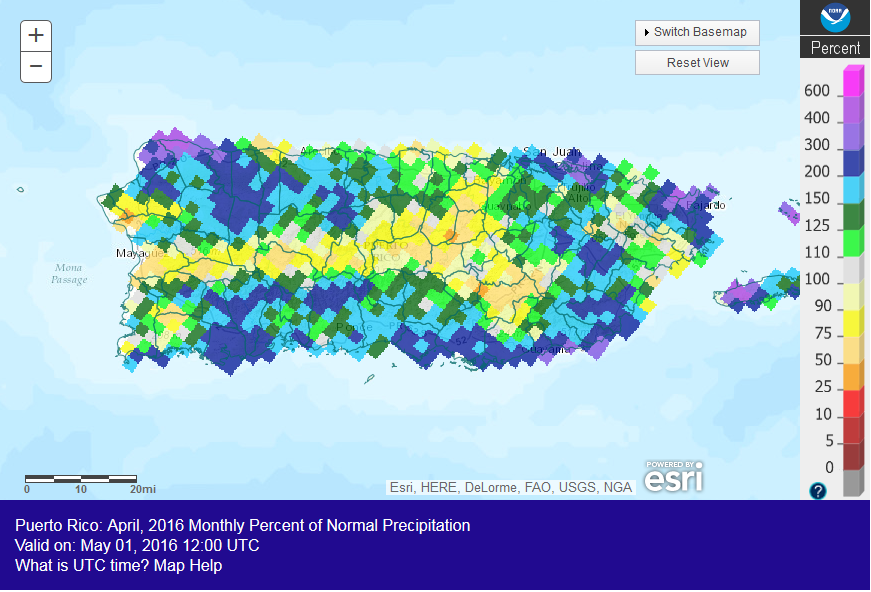
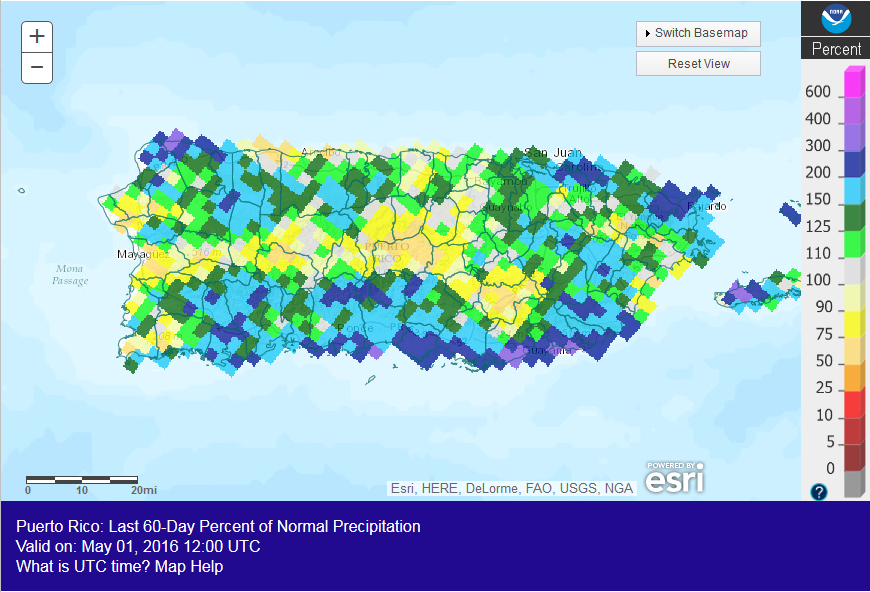
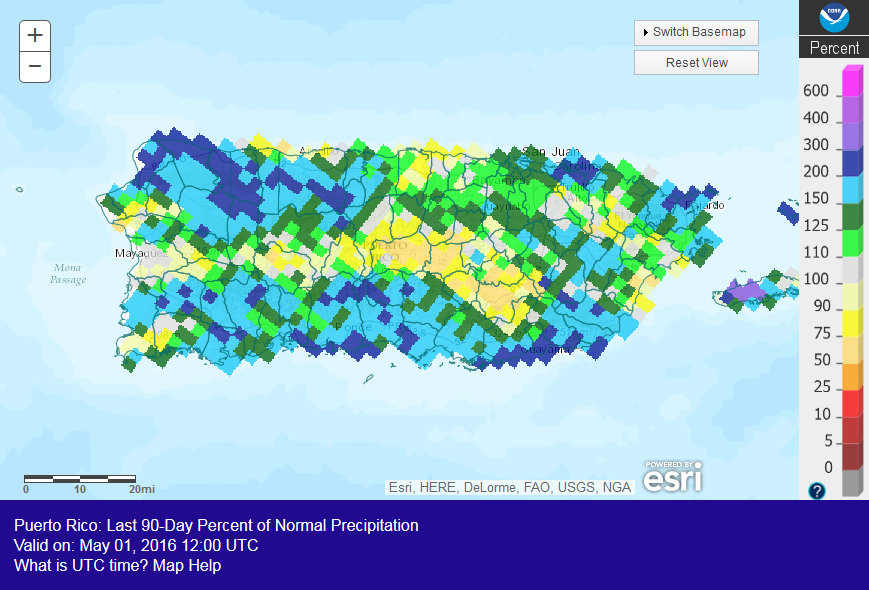
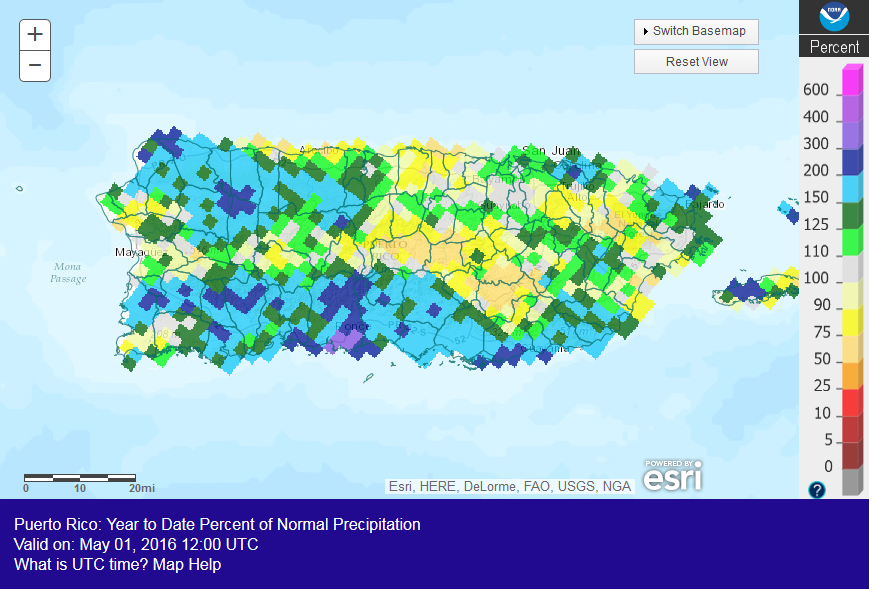
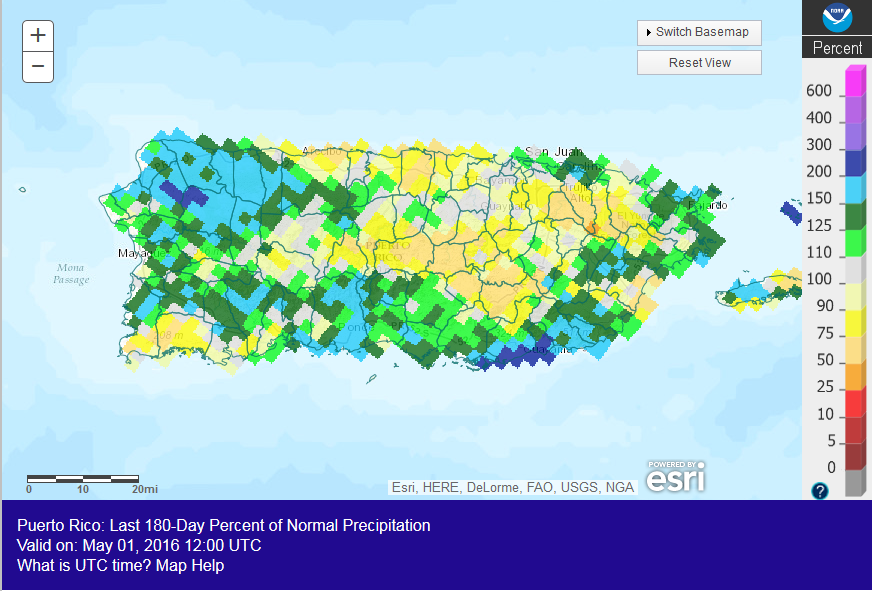
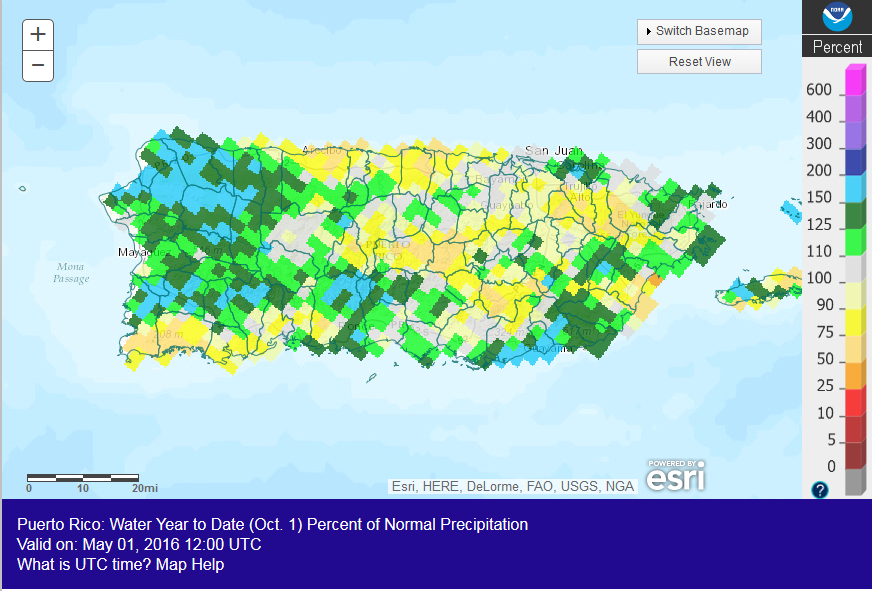
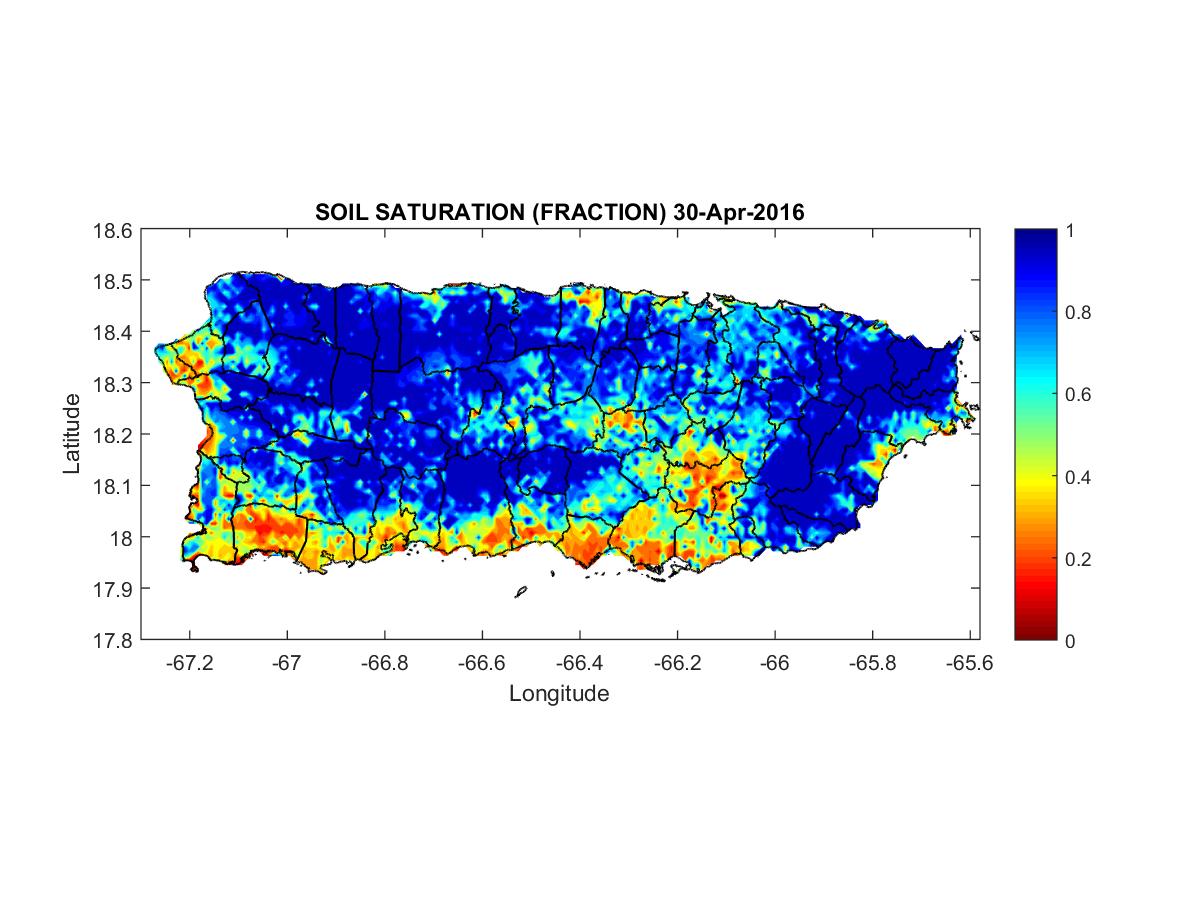
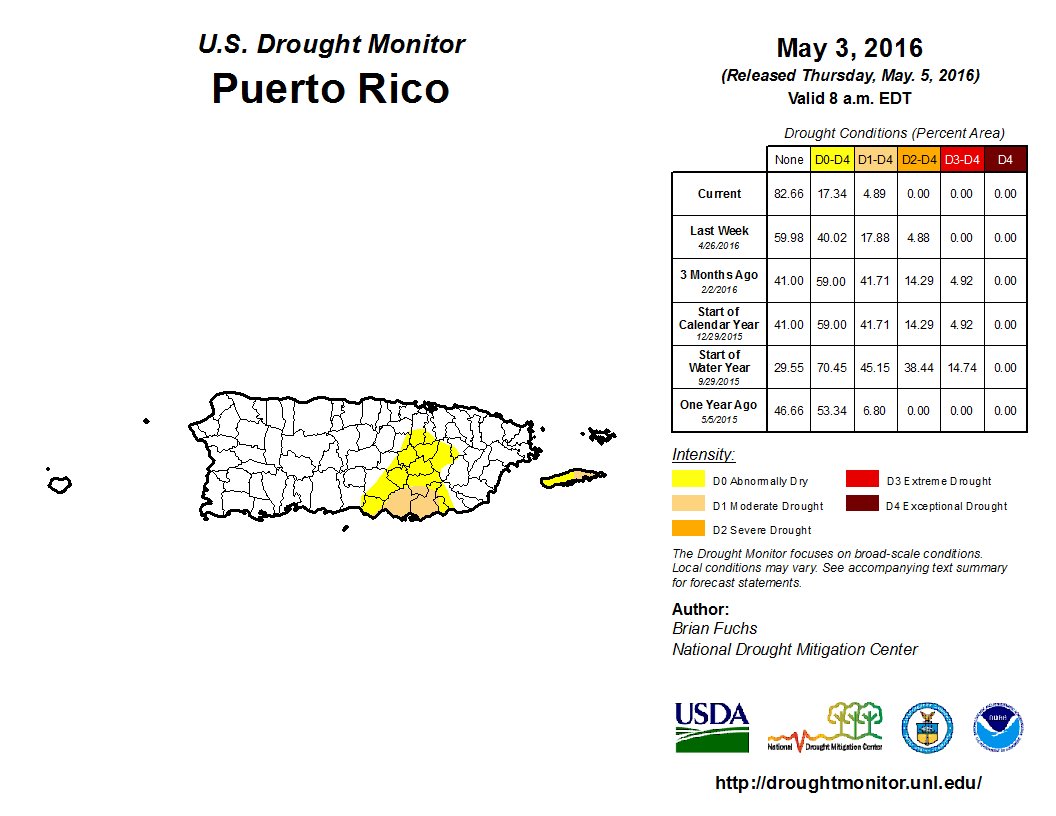
Puerto Rico: Puerto Rico had a wetter-than-normal precipitation anomaly pattern during April. Wetter-than-normal conditions dominated at the 2-, 3-, and 4-month time scales, although dryness is still evident in the core drought areas. Drier-than-normal conditions dominate in the northeast and wet conditions in the west at the 6- and 7-month time scales. Soils were still dry across parts of the southern coastal area. As shown by the May 3rd USDM map, abnormal dryness and drought shrank to about 17 percent of Puerto Rico, with moderate drought down to about 5 percent of the island.
CONUS State Precipitation Ranks:
 |
|
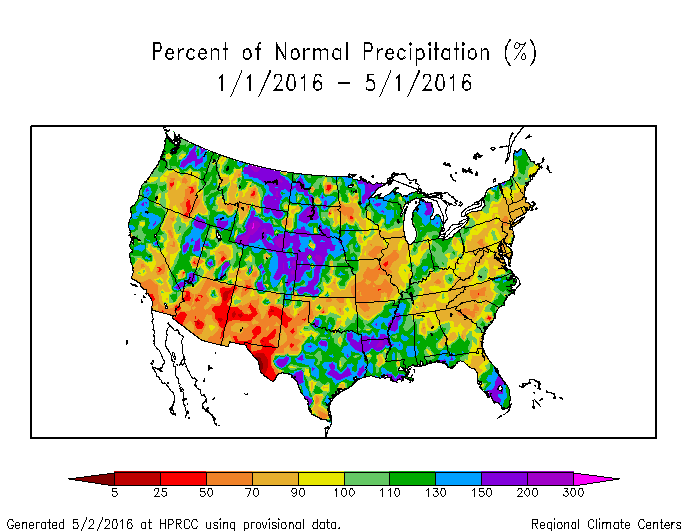
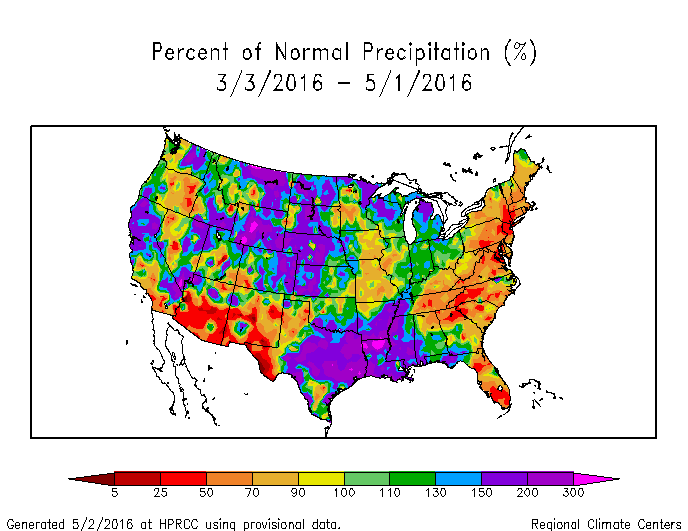
April 2016 was drier than normal across the Northwest, coastal California, parts of the Midwest, southern Florida, and eastern CONUS from the southern Appalachians to New England. Sixteen states ranked in their driest third of the 1895-2016 record. No state ranked in the top ten driest category. The February-April precipitation anomaly pattern shifted to dryness in the Southwest and Mid-Mississippi Valley, although parts of the eastern CONUS still show up as drier than normal. Eight states ranked in their driest third of the historical record. The year-to-date (January-April) precipitation anomaly pattern was similar to the February-April pattern, with 14 states ranking in the driest third of the historical record. Again, no state ranked in the top ten driest category. Wetter-than-normal conditions dominated at the longer time scales. Six states ranked in the driest third of the historical record for November 2015-April 2016, and only three (all in the Northeast) for the May 2015-April 2016 12-month period. Connecticut ranked in the top ten driest category with the ninth driest May-April.
|
|
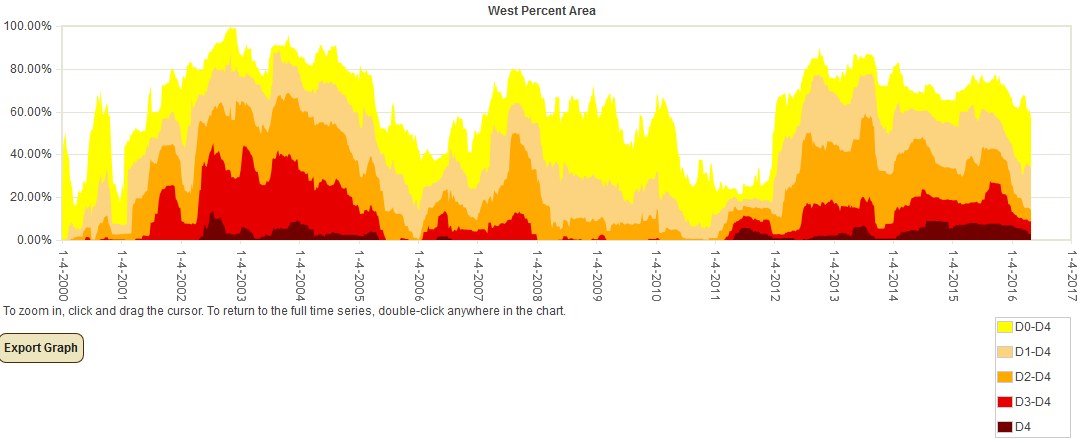
Percent area of the Western U.S. in moderate to extreme drought, January 1900 to present, based on the Palmer Drought Index.
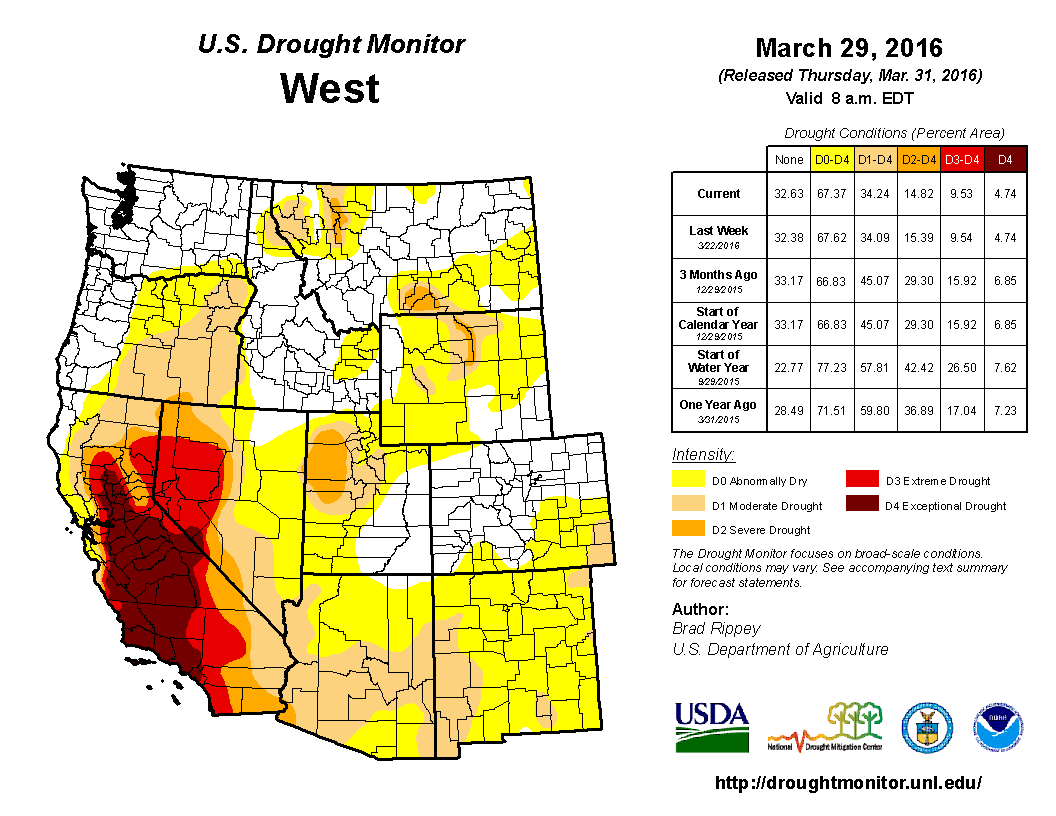
April was drier than normal across the Northwest and wetter than normal across the Southwest to Central and Southern Rockies. The water year-to-date (October 1, 2015-April 30, 2016), overall, has been near to wetter than normal for much of the West. But the precipitation mostly missed some leeside Rocky Mountain locations, especially the Bighorn Mountain region of north central Wyoming. The warmer-than-normal temperatures in the West for much of the winter season (last 3, 4, 6 months), and especially during April, have accelerated the melting of the mountain snowpack, especially in the Northwest. Even though precipitation during this water year has been generally above normal, one wet season cannot make up for several years of moisture deficits, so drought continued in both the USDM and Palmer analyses. According to the USDM, 33.1 percent of the West was experiencing moderate to exceptional drought at the end of April, which is slightly less than the previous month. The Palmer Drought Index percent area statistic for the West increased to 24.7 percent.
 Primary Hard Red Winter Wheat Belt precipitation, April, 1895-2016.
|
 Primary Hard Red Winter Wheat Belt precipitation, October-April, 1895-2016.
|
April 2016 was wetter- and near- to warmer-than-normal in the Primary Hard Red Winter Wheat agricultural belt, ranking as the fourth wettest and 32nd warmest April in the 1895-2016 record, regionwide. October marks the beginning of the growing season. The region was generally wetter- and warmer-than-normal for the growing season-to-date, with October 2015-April 2016 ranking as the fifth wettest and warmest October-April in the 1895-2016 record, regionwide.
 Primary Corn and Soybean Belt precipitation, April, 1895-2016.
|
 Primary Corn and Soybean Belt precipitation, March-April, 1895-2016.
|
April was near to warmer than normal in the Primary Corn and Soybean agricultural belt. Part of the region was drier than normal and part wetter than normal. Regionwide, April 2016 ranked as the 52nd wettest and 37th warmest April in the 1895-2016 record. March serves as the beginning of the growing season. The region was warmer than normal for March-April. Part of the region was drier than normal and part wetter than normal. Regionwide, March-April 2016 ranked as the 25th wettest and eighth warmest March-April in the 1895-2016 record.
NOAA Regional Climate Centers:
A more detailed drought discussion, provided by the NOAA Regional Climate Centers and others, can be found below.
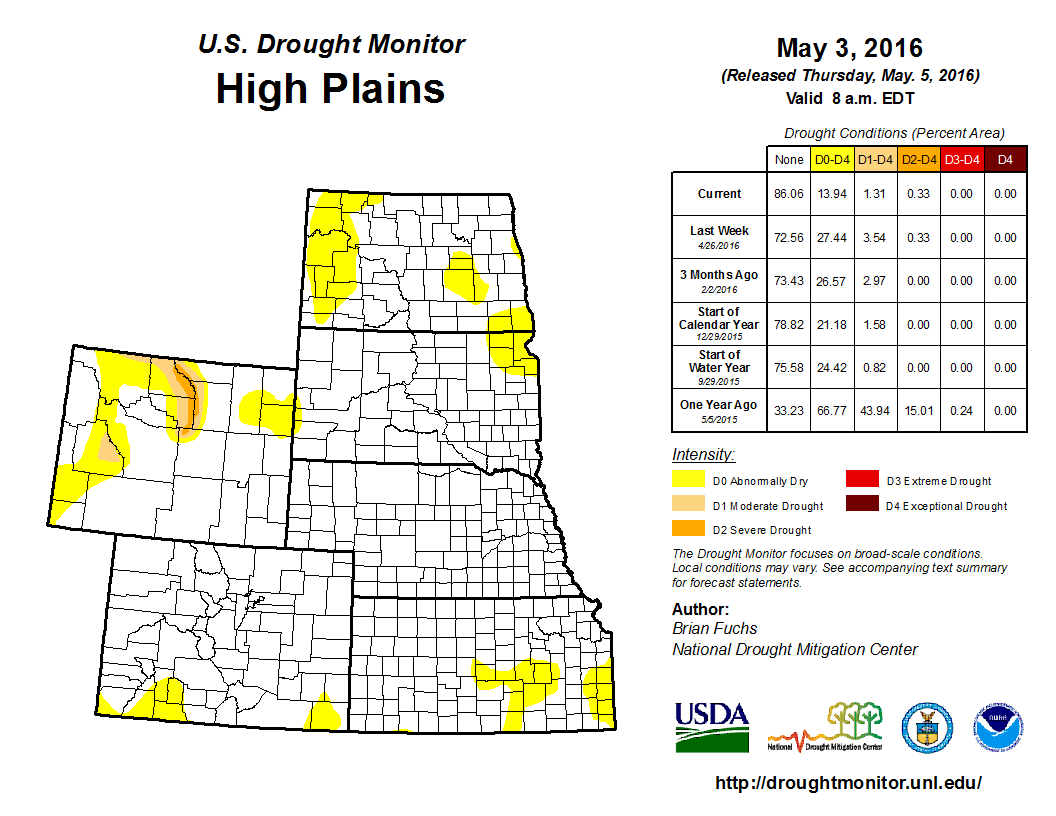
As described by the High Plains Regional Climate Center, despite dry conditions to begin the month, April ended very wet across most of the High Plains region. The warmth and dryness of March that was experienced by the eastern High Plains continued into the first half of April, causing drought conditions to expand. But, a series of storm systems crossed the region during mid-late April and brought relief to this area. Drought was removed in North Dakota and South Dakota, and it was reduced in Kansas. In the western High Plains, these storms boosted mountain snowpack, which was welcome in Wyoming where snowpack has suffered this season. Thanks to beneficial precipitation, Colorado's surface water supplies were in good shape as of the end of April, and the snowmelt/runoff season is expected to be near normal. While most locations experienced a continuation of above normal temperatures in April, the warmth was not nearly as pronounced as it was during February and March.
Spring weather is always critical for farmers as it is the start of the growing season. Warm temperatures and dryness in early April allowed for farmers to start planting spring wheat and small grains earlier than normal. However, according to the South Dakota State Climatologist, a hard freeze in South Dakota on the 12th had farmers concerned about potential wheat damage. Corn and soybean planting were behind schedule in the northern High Plains due to cool and wet conditions that prevailed during the second half of April. In Kansas, warm temperatures accelerated corn planting and emergence, and winter wheat was entering the heading stage well ahead of schedule, but the recent excessive moisture had farmers concerned about wheat rust. Cool and wet conditions caused delays in planting corn in South Dakota and Nebraska, as farmers had to wait for muddy fields to dry. Some drying in May is needed for farmers to resume planting in these areas. Pasture and range conditions were mostly good throughout the region as of the end of April, thanks to the cooler and wetter weather.
Drought conditions expanded during the first half of April across the High Plains, as the warmth and dryness experienced by large parts of the region in March carried over into April. However, a pattern change during the last half of the month brought cooler and very wet conditions, which alleviated drought in many areas. By the end of April, the area in drought or abnormal dryness (D0-D4) was reduced to about a quarter of the region, compared to about half of the region at the end of March. Drought expanded in two main areas during the first half of April — the Dakotas and Kansas/southeastern Colorado. Continued warm and dry conditions prompted the expansion of existing areas of moderate drought (D1) in these areas, and new areas of D1 appeared in western North Dakota and southeastern North Dakota/northeastern South Dakota. A small area of severe drought (D2) was introduced to extreme southeastern Colorado, which adjoined to the Oklahoma panhandle. Then, several storm systems brought copious amounts of rainfall to these areas, allowing for the elimination and/or reduction of drought during the latter half of April. D1 was removed in the Dakotas, as was the area of D2 in southeastern Colorado, and D1 was further reduced in Kansas. The area in drought in northern Wyoming improved slightly in April. A snowstorm in late March boosted mountain snowpack, and a wet April allowed for some reduction of drought and abnormal dryness in the northern part of the state.
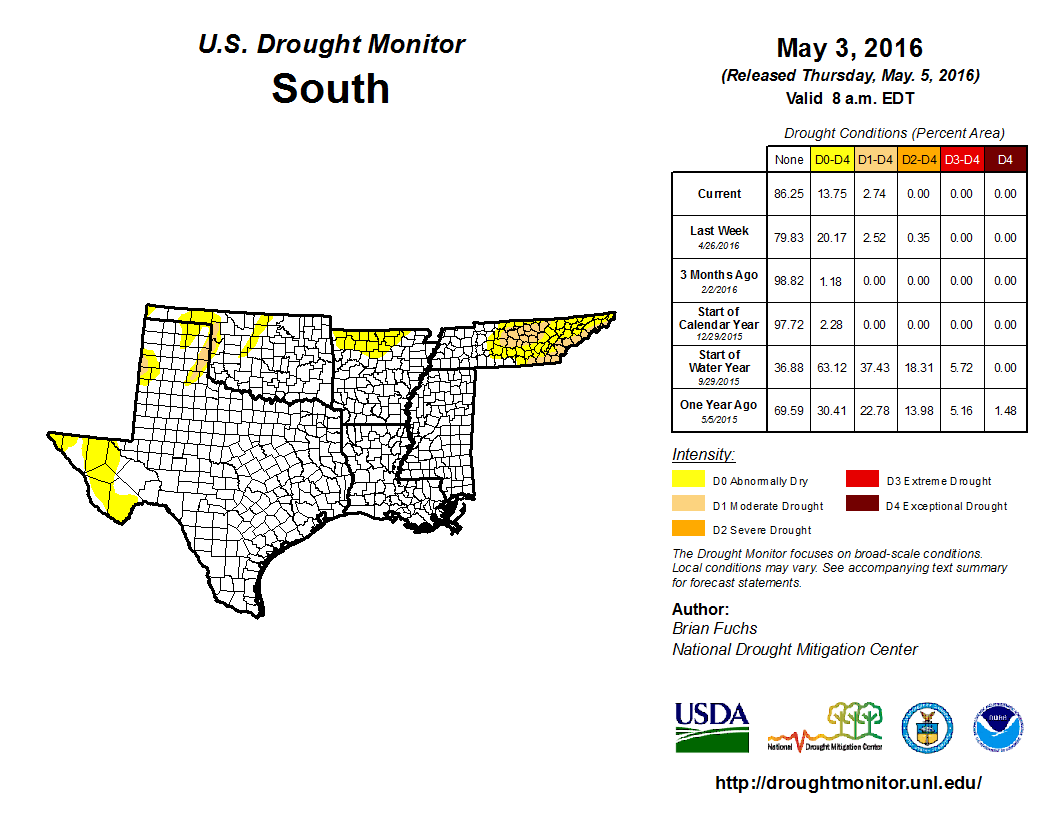
As explained by the Southern Regional Climate Center, as was the case in February and March, April average temperatures in the Southern region were consistently above normal for all six states. April precipitation varied spatially across the region. Conditions were quite dry in Tennessee, where most stations averaged roughly fifty to seventy percent of normal precipitation, and in the western Texas panhandle and along the southern tip of Texas. Drought conditions across the Southern region have improved in western Oklahoma and northwestern Texas. Above normal rainfall has helped alleviate soil moisture storage deficits and that section of the region is almost drought-free. Drier than normal conditions in Tennessee, however, have led to the expansion of some moderate drought in the central and eastern counties of the state.
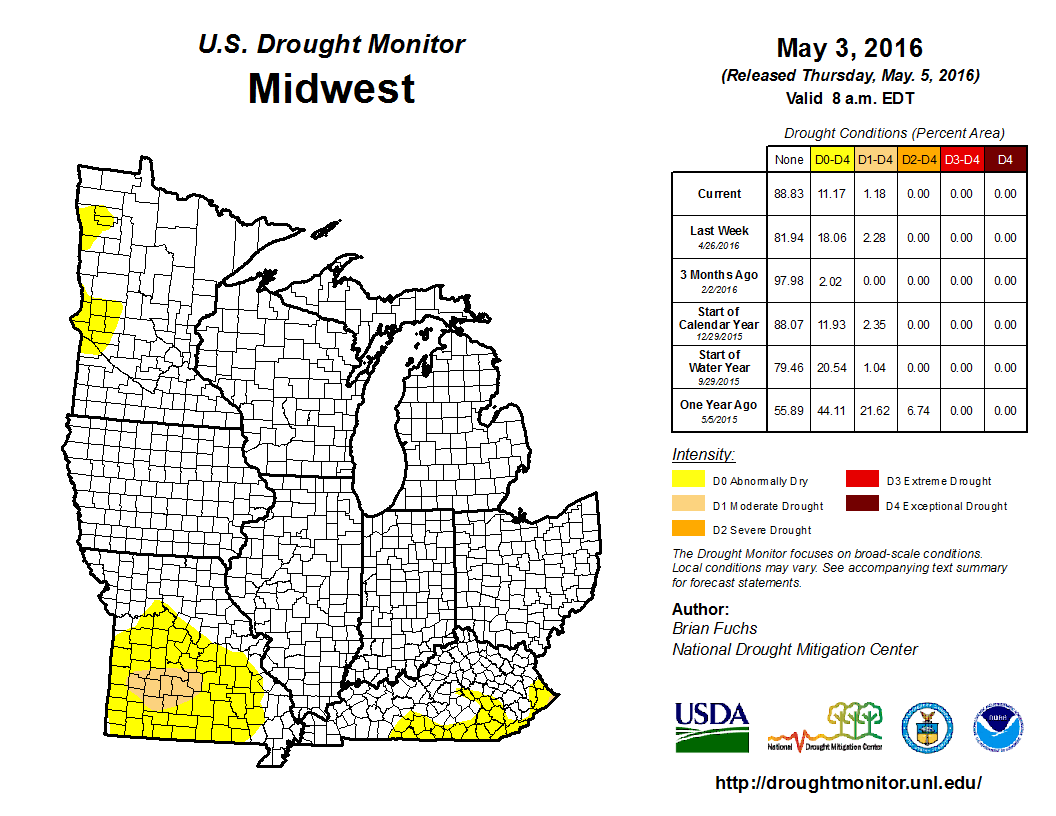
As summarized by the Midwest Regional Climate Center, above-normal precipitation fell across the western and northern portions of the region, with near- to below-normal precipitation elsewhere. April temperature departures ranged from below normal in the Great Lakes region to near to above normal elsewhere. After a 14-week stretch of drought-free conditions, moderate drought was reintroduced into the region in mid-April. As of the April 26th USDM, 2.28 percent of the region was experiencing moderate drought, while 18.06 percent was considered abnormally dry. The 14-week stretch with no Midwest drought was the longest such period in the history of the USDM, which began in 2000. The lack of drought was good for the region heading into the growing season. The warmer conditions the second half of the month and near- to below-normal precipitation in many places proved favorable for planting corn and soybeans in many states across the Midwest in April.
As noted by the Southeast Regional Climate Center, temperatures were near average and precipitation was highly variable across the Southeast region during April, with several extremes recorded. The driest locations were found across portions of central and southern Florida, northern Georgia, northeastern Alabama, Upstate South Carolina, central North Carolina, and central Virginia. Monthly precipitation totals were between 5 and 50 percent of normal in these areas. Precipitation was generally above normal across Puerto Rico and the U.S. Virgin Islands and temperatures were above average during the month. San Juan, PR (1899-2016) observed its sixth wettest April on record with 10.02 inches (255 mm) of precipitation. Moderate (D1) drought conditions developed across a few portions of the Southeast region during April, including northeastern Georgia and western Virginia. The extent of moderate-to-severe (D1 through D2) drought conditions across eastern and southern portions of Puerto Rico remained near 18 percent during the month. Favorable weather conditions during much of April allowed farmers in southern Georgia and northern Florida to plant watermelons, and it also aided in the harvesting of the sweet corn crop in parts of southern Florida. Pasture conditions continued to improve across portions of Alabama and Florida, as warm, dry weather was predominant during mid-to-late April.
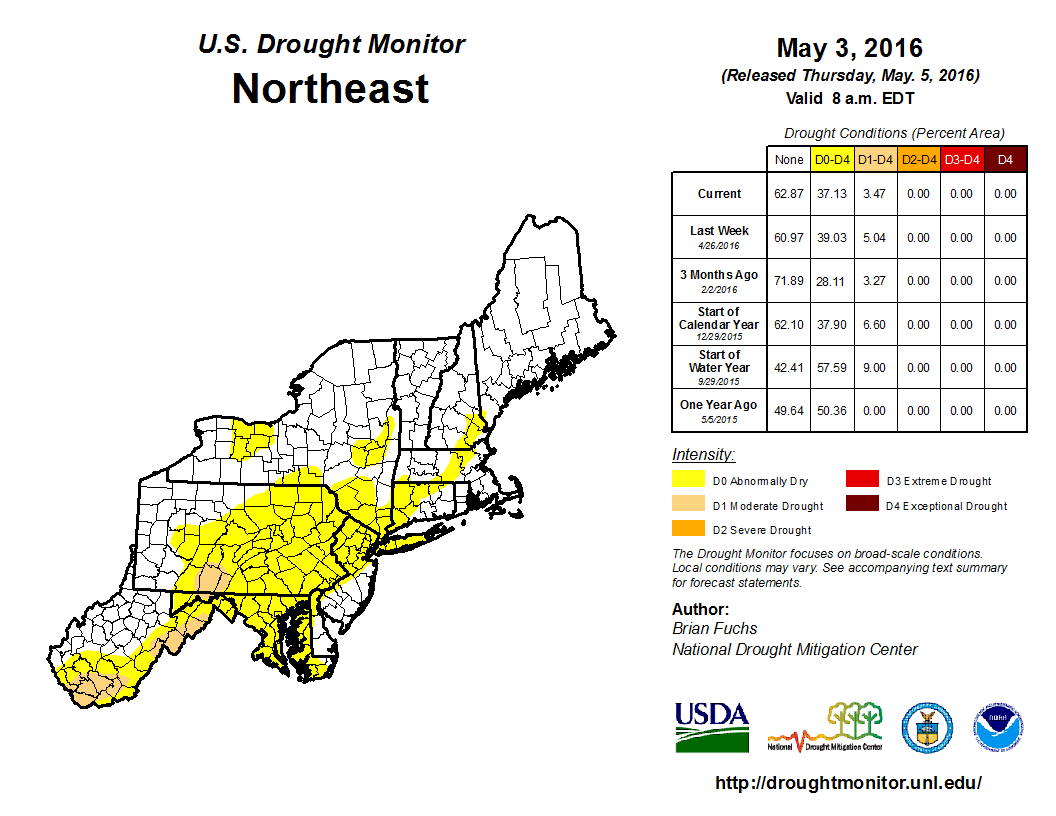
As explained by the Northeast Regional Climate Center, April was another drier-than-normal month for the Northeast, regionwide, and for all twelve states individually. According to the USDM from April 7, 6 percent of the region was abnormally dry. With below-normal precipitation in March and April, streamflow levels dropped, soils began drying out, and some vegetation showed signs of stress. By the end of April, abnormal dryness expanded to cover 34 percent of the region and moderate drought was introduced in parts of West Virginia, western Maryland, and south-central Pennsylvania. Dry conditions during the month contributed to several wildfires in the region. For example, a brush fire in Pike and Monroe counties in Pennsylvania burned more than 8,000 acres. April was the first month since October 2015 that the Northeast had a below-normal monthly average temperature.
As summarized by the Western Regional Climate Center, April saw several slow-moving closed low-pressure systems travel across the West, bringing above normal precipitation to places such as the Southwest and Great Basin that had been drier than normal in the two preceding months. The Pacific Northwest and northern California saw a turn to drier conditions this month, accompanied by well above normal temperatures. Coastal southern California also saw drier than normal conditions in April. Strong high pressure over the Pacific Northwest produced well above normal temperatures during the beginning and middle of the month. The warm temperatures helped to accelerate snow melt in the West, with many locations in the Sierra Nevada and Cascades seeing an earlier than usual maximum snowpack, up to a month early in the northern Cascades. At the month's end, snowpack was down to 75% of normal across the Cascades and northern and central Rockies. April snowfall helped put Great Basin ranges and the Colorado Rockies at near-normal snowpack. The Eastward draining basins of the Sierra Nevada were near normal, while basins on the western side of the Crest averaged to 61% of normal snowpack.
Temperatures in the upper tercile were observed across Alaska, with several locations experiencing record warmth. Further south, Hawaii saw above normal temperatures throughout the state. Precipitation was near normal for many windward locations and below normal in leeward areas. Drought conditions expanded on the southern and western portions of Big Island this month, while some improvement was seen on windward coasts of all islands.
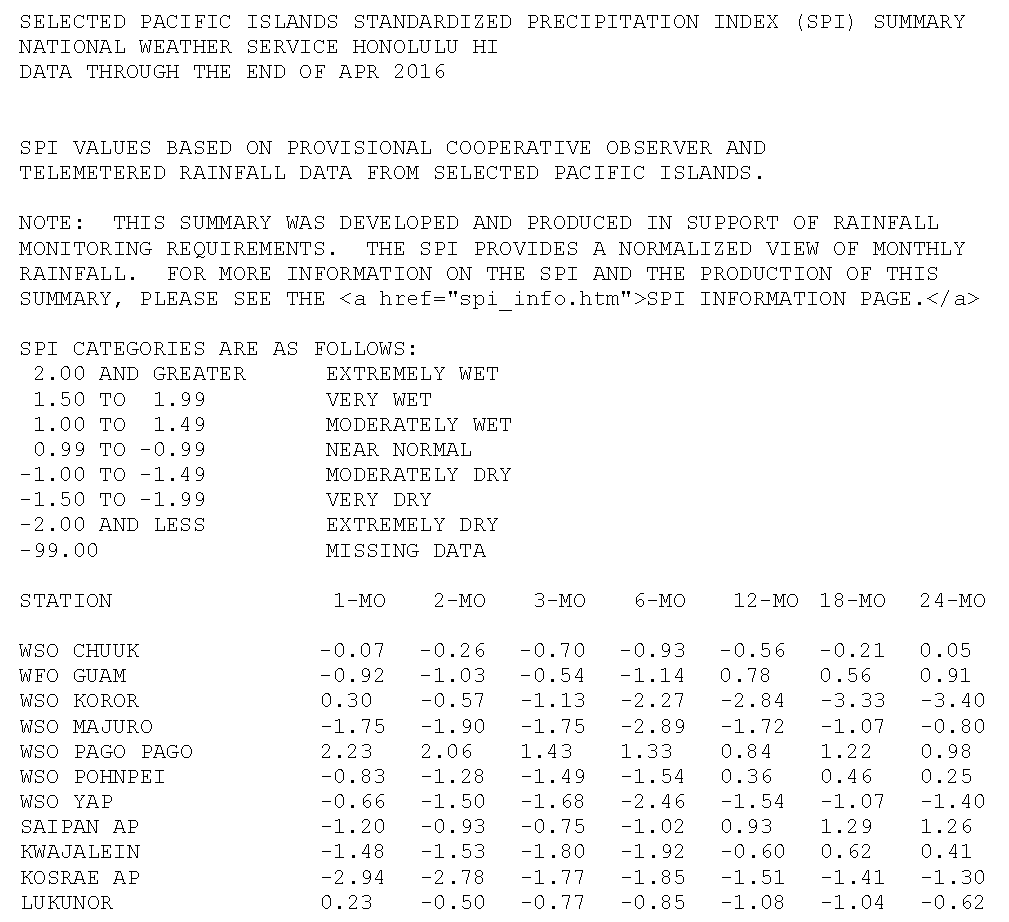
Pacific Islands: The NOAA National Weather Service (NWS) offices, the Pacific ENSO Applications Climate Center (PEAC), and partners provided reports on conditions across the Pacific Islands.
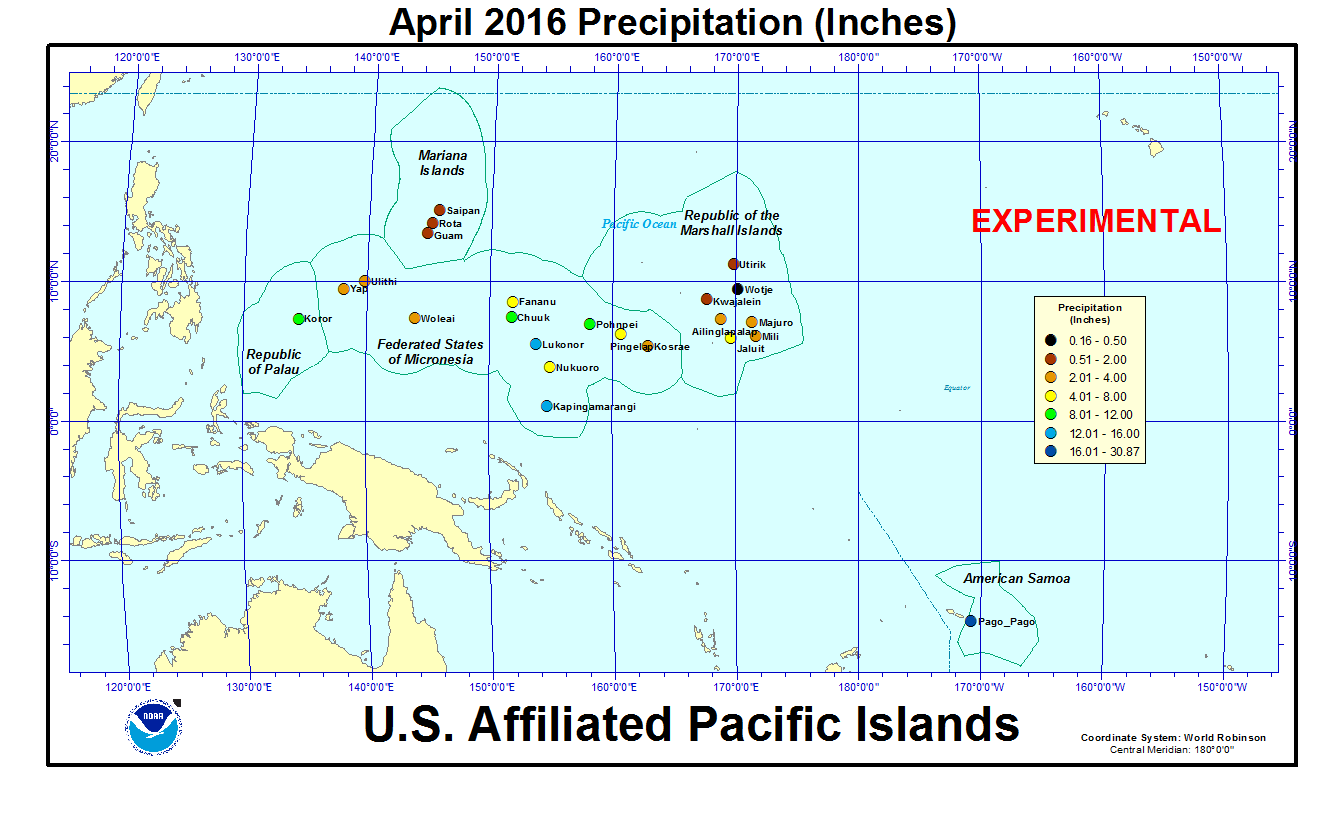
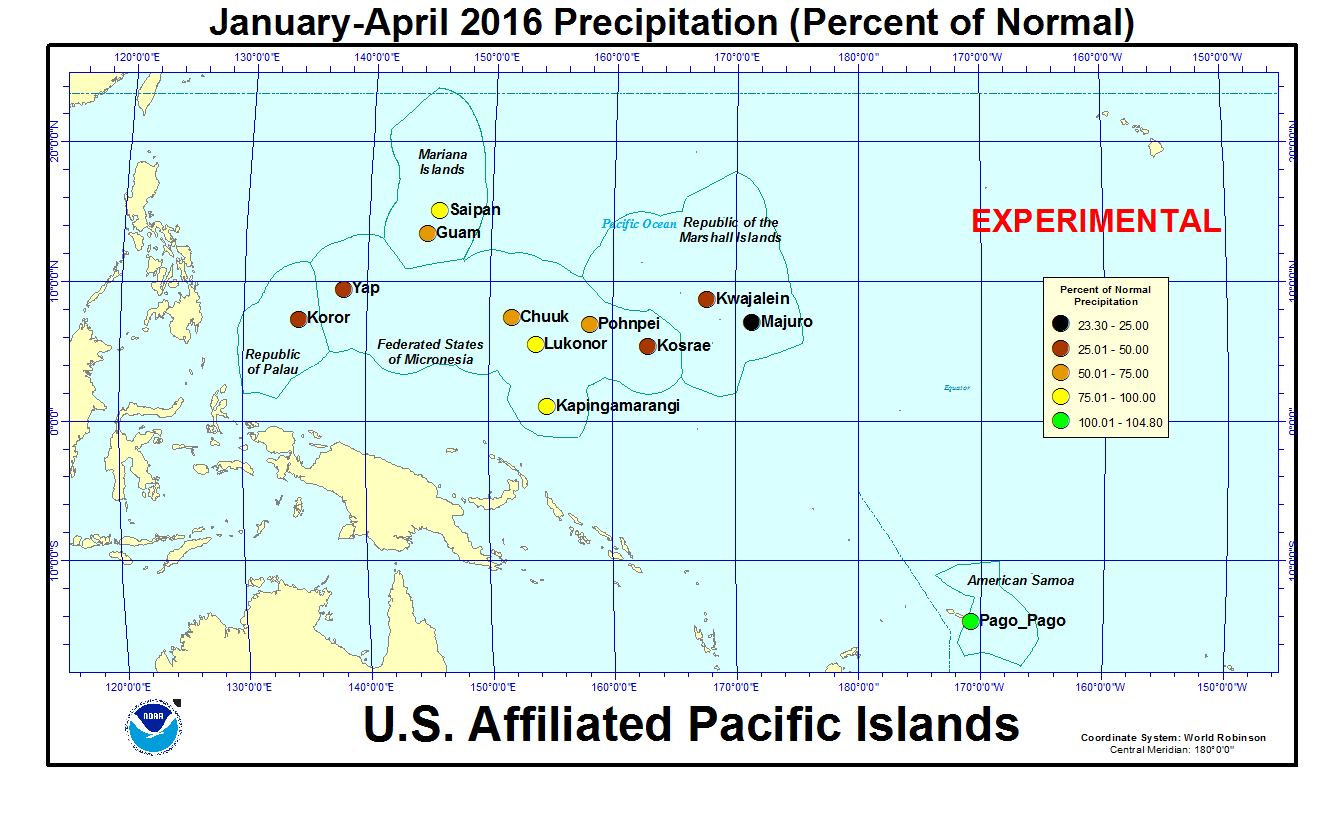
In the U.S. Affiliated Pacific Islands (maps — Federated States of Micronesia, Northern Mariana Islands, Marshall Islands, Republic of Palau, American Samoa, basinwide), April 2016 was wetter than normal at only Koror, Lukonor, and Pago Pago. It was drier than normal at the rest of the primary stations.
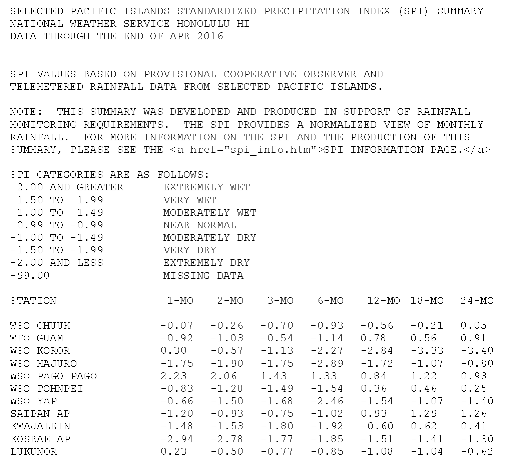
Rainfall amounts were below the minimum thresholds (4 or 8 inches) required to meet most monthly water needs at most stations across the region. April rainfall was above the monthly minimum thresholds at stations in the Republic of Palau (Koror), eastern Federated States of Micronesia (FSM) (Chuuk, Kapingamarangi, Lukonor, and Pohnpei), and American Samoa (Pago Pago). Most of the stations in the western FSM, Mariana Islands, and Republic of the Marshall Islands had rainfall amounts below the minimum thresholds. In the Marshall Islands, Utirik recorded 1.86 inches in April 2016 with 15 of the last 18 months less than 8 inches. Wotje has 0.16 inch of rain with 14 of the last 18 months dry (less than 8 inches). Mili had 2.70 inches with 13 of the last 18 months dry. Ailinglapalap measured 2.54 inches in April with 12 of the last 18 months dry. Jaluit had 4.52 inches with 12 of the last 15 months dry. Majuro had 2.05 inches in April which marked the sixth consecutive dry month. Kwajalein measured 1.13 inches with the last five months dry. In the Mariana Islands, Guam's 1.31 inches of rain during April marked the fifth consecutive dry month (less than 4 inches). Saipan had 1.78 inches in April with five of the last six months dry. Rota received 0.91 inch with three of the last four months dry. In the FSM, Maap measured 2.00 inches of rain for April, Dugor 2.18 inches, Woleai 2.41 inches, and Tamil 2.82 inches. The last nine consecutive months have been dry (less than 8 inches) at Woleai. The last eight consecutive months have been dry at Ulithi and Gilman. The last seven consecutive months have been dry at Dugor, Fananu, Luweech, Maap, North Fanif, Rumung, Tamil, and Yap. The 4- and 8-inch thresholds are important because, if monthly precipitation falls below the threshold, then drought becomes a concern. Below-normal rainfall is expected to continue for many of these stations as the El Niño continues to weaken and even for a few months beyond.
An analysis of historical data for the USAPI stations in the Global Historical Climatology Network-Daily (GHCN-D) dataset, augmented with fill-in data from the 1981-2010 Normals, indicated that several stations had record or near-record dryness during April, the last seven months (October-April, and the last 12 months (May-April). Some stations have a long period of record and their dataset is fairly complete, while other stations have a shorter period of record and the dataset has some missing data. April 2016 was the driest April on record for Kosrae (out of 46 years). The last seven months have been the driest October-April on record for Koror and Yap out of 65 years of data, and for Woleai out of 27 years of data. May 2015-April 2016 was the driest such 12-month period for Jaluit (out of 31 years of data), Pingelap (30 years), and Woleai (19 years).
Rank of 1 = driest.
| Station | April 2016 Rank |
April No. of Years |
October 2015- April 2016 Rank |
October- April No. of Years |
May 2015- April 2016 Rank |
May- April No. of Years |
Period of Record |
| Jaluit | 4 | 33 | 2 | 31 | 1 | 31 | 1981-2016 |
| Koror | 43 | 65 | 1 | 65 | 2 | 64 | 1951-2016 |
| Woleai | 3 | 37 | 1 | 27 | 1 | 19 | 1968-2016 |
| Yap | 19 | 65 | 1 | 65 | 5 | 64 | 1951-2016 |
| Majuro | 4 | 62 | 2 | 62 | 5 | 61 | 1954-2016 |
| Mili | 3 | 33 | 2 | 31 | 2 | 31 | 1981-2016 |
| Ulithi | 13 | 35 | 2 | 33 | 10 | 33 | 1981-2016 |
| Ailinglapalap | 6 | 33 | 2 | 31 | N/A | 30 | 1981-2016 |
| Pingelap | 5 | 33 | 3 | 32 | 1 | 30 | 1981-2016 |
| Kosrae | 1 | 46 | 2 | 33 | 2 | 29 | 1954-2016 |
| Lukonor | 21 | 32 | 5 | 30 | 5 | 19 | 1981-2016 |
| Saipan | 16 | 36 | 4 | 27 | 2 | 27 | 1981-2016 |
| Pohnpei | 11 | 65 | 4 | 65 | 38 | 64 | 1951-2016 |
| Kwajalein | 5 | 64 | 5 | 64 | 17 | 64 | 1952-2016 |
| Kapingamarangi | 13 | 24 | 6 | 18 | 6 | 11 | 1962-2016 |
| Chuuk | 28 | 65 | 8 | 65 | 16 | 64 | 1951-2016 |
| Guam | 8 | 60 | 7 | 59 | 40 | 59 | 1957-2016 |
| Nukuoro | 3 | 33 | 10 | 31 | 22 | 30 | 1981-2016 |
| Pago Pago | 51 | 51 | 45 | 50 | 43 | 50 | 1966-2016 |
| Wotje | 3 | 33 | N/A | 30 | N/A | 30 | 1981-2016 |
| Utirik | 8 | 15 | N/A | 6 | N/A | 2 | 1985-2016 |
A State of Emergency has been declared by the government of the Republic of Palau and by the government of the Federated States of Micronesia (FSM) due to the drought. A State of Emergency has been declared by the state governors of the FSM States of Chuuk, Kosrae, Pohnpei, and Yap. In early March, a State of Disaster was declared by the government of the Republic of the Marshall Islands. In late April, the NOAA National Weather Service office in Guam updated the Drought Information Statement for the Republic of Palau, the Mariana Islands, the Marshall Islands, and FSM. The Drought Information Statement noted the very dry conditions of the last seven months and urged close monitoring of water supplies, implementation of water conservation measures, and concern for grass fires and impacts on crops and other vegetation.
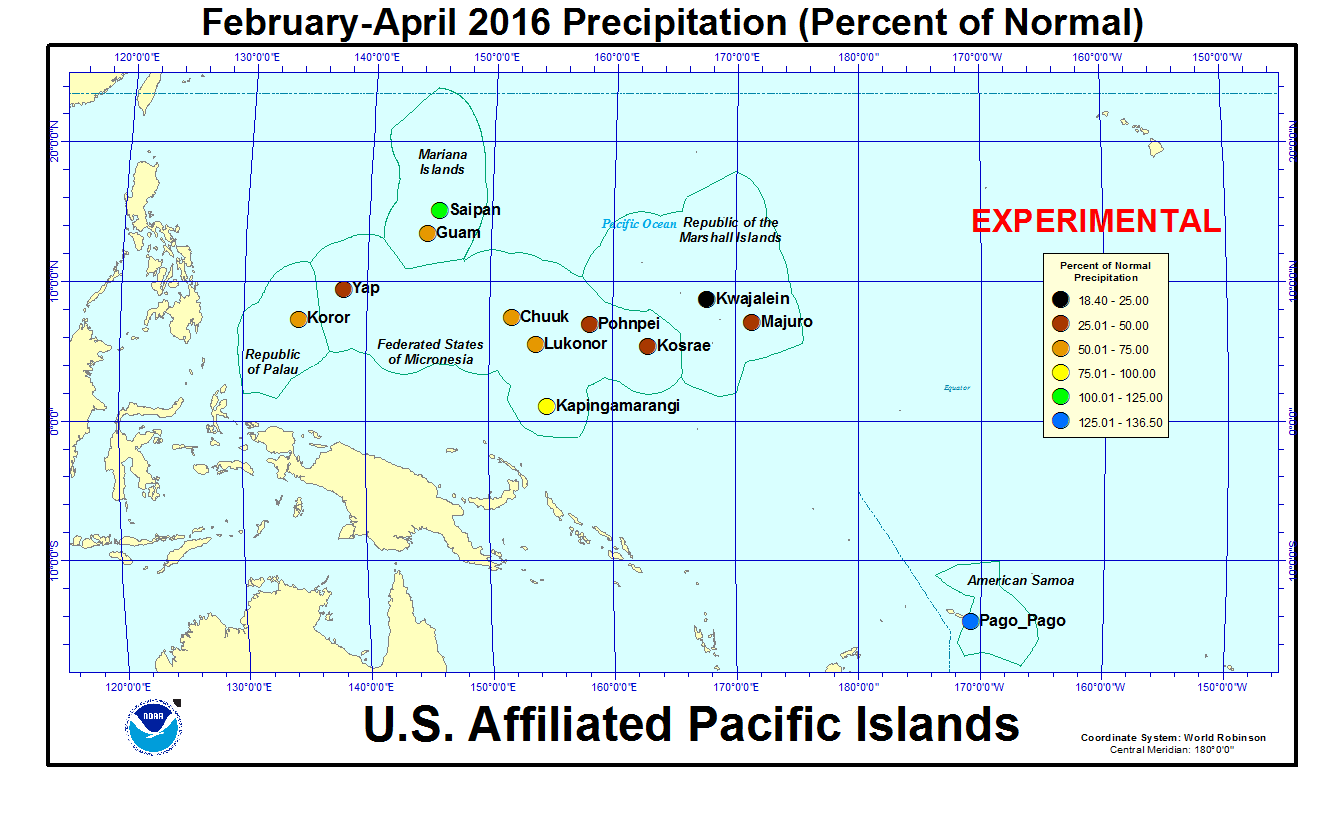
As measured by percent of normal precipitation, Chuuk, Kapingamarangi, Kosrae, Kwajalein, Majuro, and Yap have been drier than normal in the short term (April, the last 3 months [February-April 2016], and the year-to-date [January-April]) as well as the long term (last 12 months [May 2015-April 2016]). Guam and Pohnpei were drier than normal in the short term but near to wetter than normal in the long term. Saipan was near to drier than normal in the short term but wetter than normal in the long term. Koror and Lukonor were wetter than normal for April but drier than normal for the other three time scales. Pago Pago was near to wetter than normal at all four time scales.
| Station Name | May 2015 | Jun 2015 | Jul 2015 | Aug 2015 | Sep 2015 | Oct 2015 | Nov 2015 | Dec 2015 | Jan 2016 | Feb 2016 | Mar 2016 | Apr 2016 | May- Apr |
|---|---|---|---|---|---|---|---|---|---|---|---|---|---|
| Chuuk | 89% | 172% | 54% | 155% | 188% | 53% | 70% | 82% | 63% | 29% | 85% | 86% | 93% |
| Guam NAS | 291% | 86% | 215% | 146% | 108% | 125% | 81% | 74% | 65% | 120% | 79% | 52% | 106% |
| Kapingamarangi | 173% | 161% | 54% | 162% | 112% | 63% | 89% | 134% | 103% | 65% | 88% | 94% | 96% |
| Koror | 33% | 107% | 27% | 73% | 143% | 53% | 69% | 41% | 26% | 30% | 36% | 135% | 59% |
| Kosrae | 84% | 143% | 108% | 138% | 115% | 63% | 33% | 95% | 60% | 113% | 32% | 23% | 69% |
| Kwajalein | 204% | 117% | 104% | 171% | 95% | 105% | 88% | 59% | 64% | 17% | 45% | 21% | 99% |
| Lukonor | 89% | 136% | 77% | 75% | 149% | 40% | 123% | 56% | 123% | 61% | 51% | 113% | 79% |
| Majuro | 171% | 57% | 87% | 207% | 96% | 83% | 40% | 61% | 14% | 46% | 20% | 22% | 79% |
| Pago Pago | 172% | 170% | 72% | 125% | 18% | 88% | 210% | 183% | 34% | 54% | 101% | 329% | 114% |
| Pohnpei | 219% | 108% | 138% | 199% | 124% | 78% | 67% | 71% | 102% | 49% | 44% | 60% | 106% |
| Saipan | 341% | 115% | 112% | 141% | 92% | 198% | 64% | 154% | 54% | 105% | 106% | 68% | 126% |
| Yap | 235% | 92% | 82% | 148% | 68% | 43% | 37% | 58% | 35% | 34% | 15% | 62% | 79% |
| Station Name | May 2015 | Jun 2015 | Jul 2015 | Aug 2015 | Sep 2015 | Oct 2015 | Nov 2015 | Dec 2015 | Jan 2016 | Feb 2016 | Mar 2016 | Apr 2016 | May- Apr |
|---|---|---|---|---|---|---|---|---|---|---|---|---|---|
| Chuuk | 10.08" | 20.03" | 6.45" | 19.91" | 22.07" | 6.09" | 7.46" | 9.25" | 6.40" | 2.09" | 7.08" | 10.73" | 127.64" |
| Guam NAS | 9.91" | 5.32" | 21.80" | 21.54" | 13.71" | 14.26" | 5.96" | 3.77" | 2.62" | 3.63" | 1.63" | 1.31" | 105.46" |
| Kapingamarangi | 20.84" | 22.14" | 7.71" | 13.14" | 11.08" | 5.13" | 8.28" | 13.20" | 9.40" | 6.04" | 10.02" | 12.78" | 139.76" |
| Koror | 3.96" | 18.66" | 4.98" | 9.90" | 16.88" | 6.24" | 7.86" | 4.59" | 2.64" | 2.53" | 2.68" | 9.90" | 90.82" |
| Kosrae | 14.89" | 20.90" | 16.17" | 19.69" | 16.36" | 6.90" | 4.55" | 15.37" | 9.95" | 14.56" | 5.15" | 3.99" | 148.48" |
| Kwajalein | 13.69" | 8.12" | 10.28" | 16.63" | 10.24" | 11.71" | 9.98" | 3.90" | 2.02" | 0.46" | 1.05" | 1.13" | 89.21" |
| Lukonor | 10.36" | 15.83" | 12.22" | 10.55" | 15.15" | 4.53" | 11.18" | 6.35" | 10.37" | 5.44" | 4.75" | 12.83" | 119.56" |
| Majuro | 17.27" | 6.31" | 9.72" | 24.24" | 10.72" | 10.52" | 5.33" | 6.93" | 1.11" | 3.17" | 1.33" | 2.05" | 98.7" |
| Pago Pago | 16.59" | 9.07" | 3.99" | 6.75" | 1.20" | 8.15" | 21.33" | 23.53" | 4.49" | 6.49" | 10.76" | 30.87" | 143.22" |
| Pohnpei | 43.68" | 16.03" | 21.31" | 28.33" | 15.59" | 11.86" | 9.95" | 11.41" | 13.49" | 4.64" | 5.76" | 11.01" | 193.06" |
| Saipan | 8.11" | 4.15" | 10.00" | 18.51" | 9.26" | 21.00" | 3.61" | 5.94" | 1.36" | 2.72" | 2.00" | 1.78" | 88.44" |
| Yap | 18.41" | 11.07" | 12.39" | 21.99" | 9.21" | 5.29" | 3.31" | 4.93" | 2.23" | 1.77" | 0.70" | 3.47" | 94.77" |
| Station Name | May 2015 | Jun 2015 | Jul 2015 | Aug 2015 | Sep 2015 | Oct 2015 | Nov 2015 | Dec 2015 | Jan 2016 | Feb 2016 | Mar 2016 | Apr 2016 | May- Apr |
|---|---|---|---|---|---|---|---|---|---|---|---|---|---|
| Chuuk | 11.30" | 11.66" | 11.98" | 12.86" | 11.71" | 11.51" | 10.61" | 11.25" | 10.10" | 7.25" | 8.32" | 12.47" | 136.77" |
| Guam NAS | 3.40" | 6.18" | 10.14" | 14.74" | 12.66" | 11.44" | 7.38" | 5.11" | 4.01" | 3.03" | 2.07" | 2.53" | 99.09" |
| Kapingamarangi | 12.08" | 13.78" | 14.15" | 8.13" | 9.93" | 8.19" | 9.27" | 9.84" | 9.15" | 9.27" | 11.43" | 13.64" | 145.85" |
| Koror | 11.83" | 17.48" | 18.53" | 13.50" | 11.77" | 11.84" | 11.39" | 11.16" | 10.18" | 8.56" | 7.44" | 7.32" | 152.90" |
| Kosrae | 17.75" | 14.64" | 14.91" | 14.22" | 14.22" | 10.94" | 13.83" | 16.11" | 16.67" | 12.93" | 16.06" | 17.51" | 213.87" |
| Kwajalein | 6.72" | 6.93" | 9.87" | 9.74" | 10.74" | 11.18" | 11.28" | 6.66" | 3.16" | 2.64" | 2.35" | 5.26" | 90.41" |
| Lukonor | 11.69" | 11.65" | 15.93" | 14.04" | 10.15" | 11.32" | 9.08" | 11.27" | 8.41" | 8.93" | 9.26" | 11.31" | 151.36" |
| Majuro | 10.11" | 11.01" | 11.17" | 11.69" | 11.17" | 12.73" | 13.44" | 11.39" | 7.74" | 6.88" | 6.58" | 9.42" | 125.25" |
| Pago Pago | 9.66" | 5.33" | 5.55" | 5.38" | 6.53" | 9.26" | 10.14" | 12.84" | 13.34" | 12.00" | 10.68" | 9.39" | 125.57" |
| Pohnpei | 19.96" | 14.81" | 15.43" | 14.26" | 12.55" | 15.27" | 14.83" | 16.08" | 13.18" | 9.55" | 13.17" | 18.41" | 182.36" |
| Saipan | 2.38" | 3.62" | 8.91" | 13.13" | 10.09" | 10.62" | 5.61" | 3.85" | 2.53" | 2.59" | 1.89" | 2.63" | 70.25" |
| Yap | 7.85" | 12.04" | 15.08" | 14.82" | 13.50" | 12.18" | 8.83" | 8.51" | 6.39" | 5.19" | 4.56" | 5.63" | 120.31" |


[top]
State/Regional/National Moisture Status
A detailed review of drought and moisture conditions is available for all contiguous U.S. states, the nine standard regions, and the nation (contiguous U.S.):
| northeast u. s. | east north central u. s. | central u. s. |
| southeast u. s. | west north central u. s. | south u. s. |
| southwest u. s. | northwest u. s. | west u. s. |
| Contiguous United States |
[top]
Contacts & Questions