|
Contents Of This Report: |

|
Please note that the values presented in this report are based on preliminary data. They will change when the final data are processed, but will not be replaced on these pages.
National Drought Overview
|
|
[top]
Detailed Drought Discussion
Overview

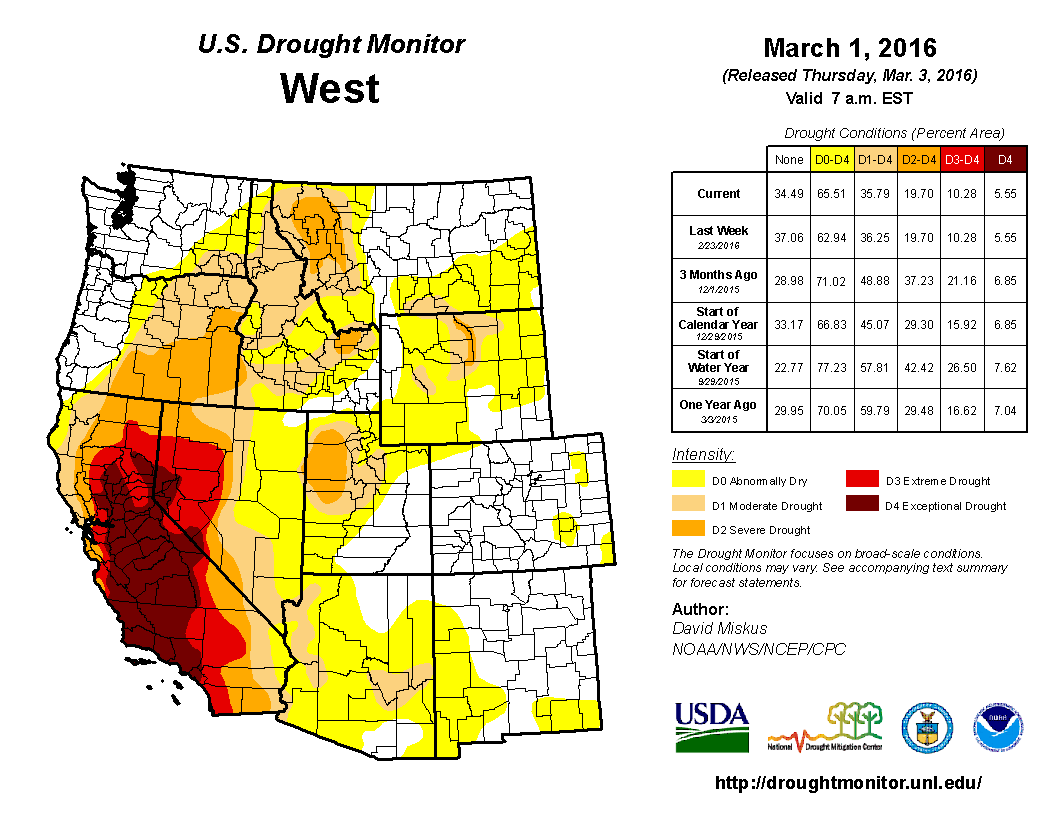
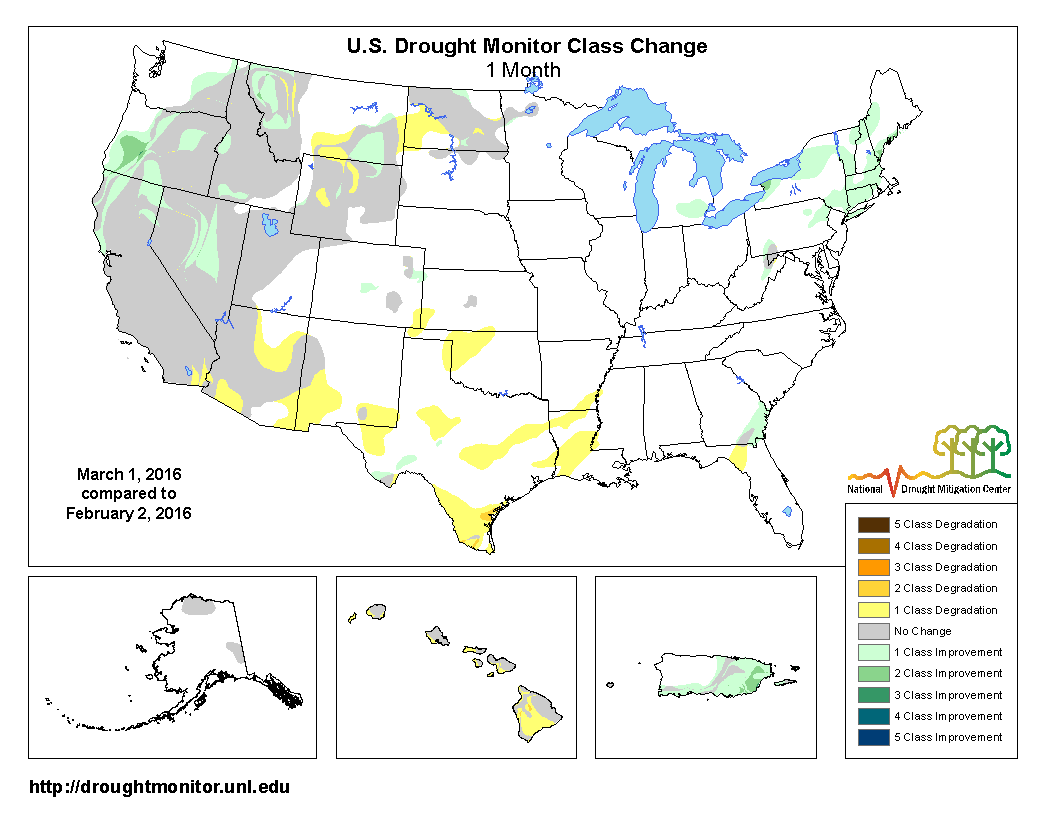
The U.S. Drought Monitor drought map valid March 1, 2016.
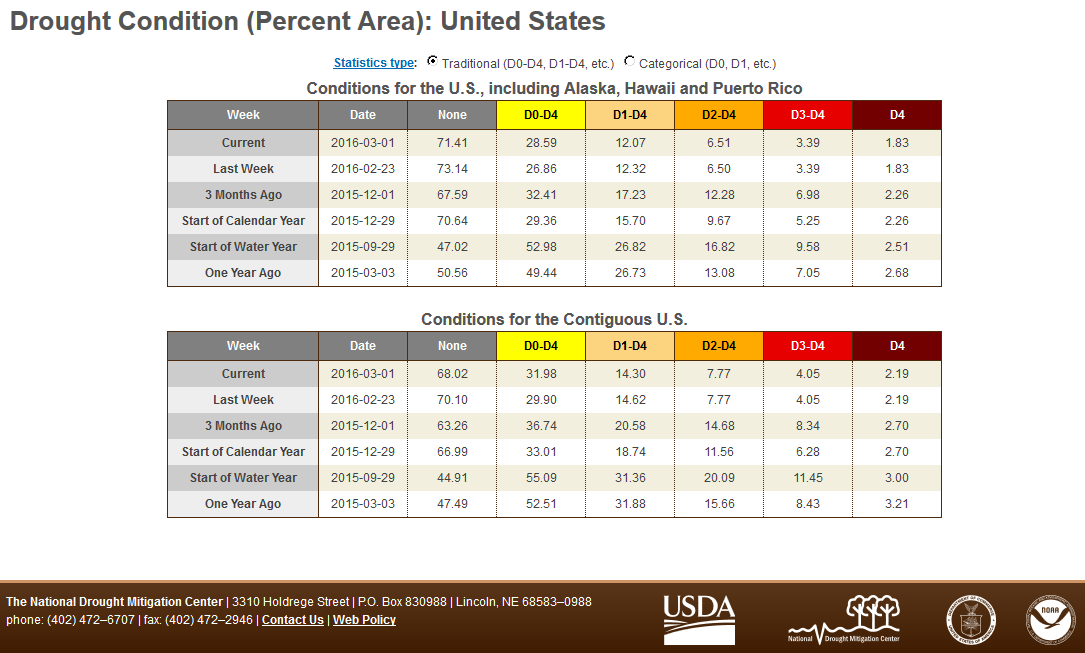
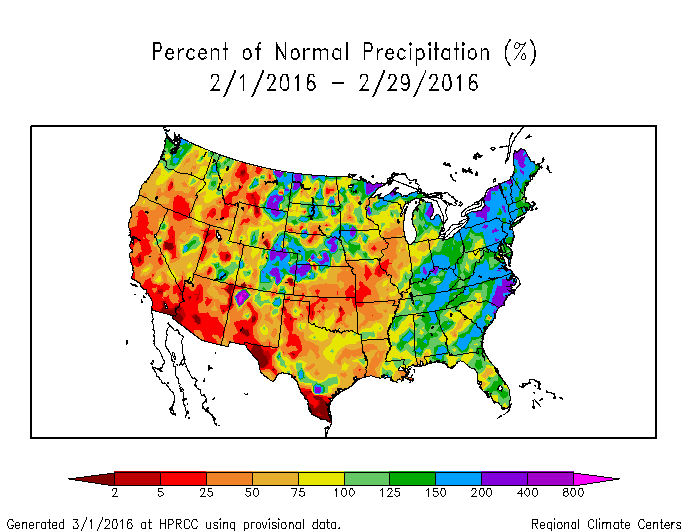
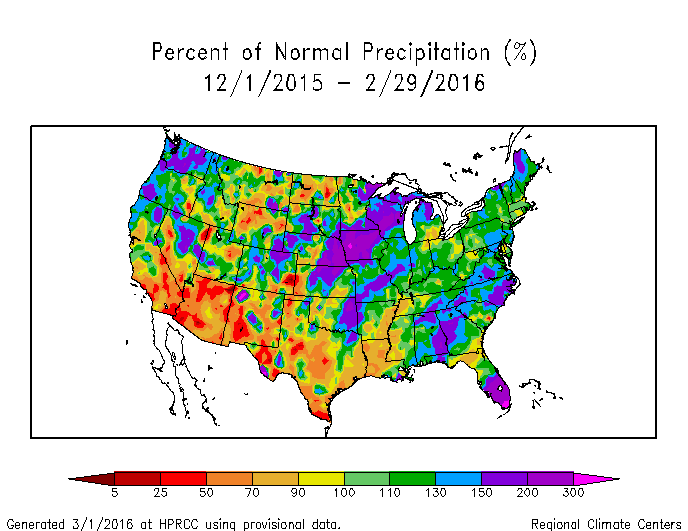
During February 2016, a strong El Niño continued to pump moisture and energy from the tropical Pacific Ocean into the atmosphere, invigorating the upper-level circulation in the mid-latitudes. Numerous weather systems in the jet stream flow moved across North America. A ridge in the upper atmosphere weakened or deflected many of the weather systems away from the western CONUS, resulting in below-normal precipitation for much of the region. A resulting northwesterly flow dominated over the central part of the country, blocking Gulf of Mexico moisture and resulting in below-normal precipitation from the Southern Plains to Mid-Mississippi Valley. Weather systems intensified as they moved into a trough over the eastern CONUS, bringing above-normal precipitation. Even though much of the West was drier than normal in February, abundant precipitation in January improved the mountain snowpack which held together through February and helped improve the hydrologic situation. The El Niño kept Hawaii dry and the western ridge hindered precipitation over much of Alaska, but it was mostly wetter than normal in Puerto Rico. When integrated across the CONUS, February 2016 ranked as the 46th driest February in the 1895-2016 record. Due to delayed improvement in the West, the national drought footprint shrank slightly to 12.1 percent of the U.S. (14.3 percent of the CONUS). According to the Palmer Drought Index, which goes back to the beginning of the 20th century, about 7.0 percent of the CONUS was in moderate to extreme drought at the end of February, an increase of about 4.8 percent compared to last month.
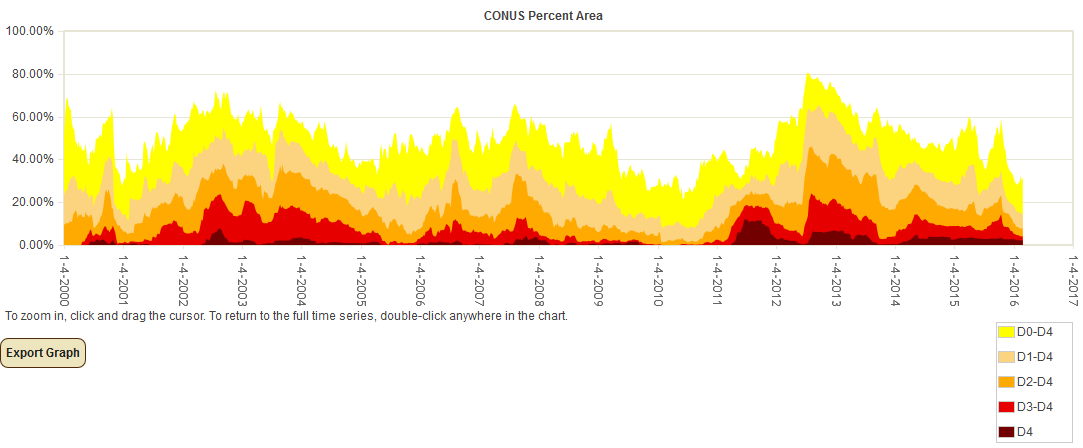
Percent area of the CONUS in moderate to exceptional drought, January 4, 2000 to present, based on the U.S. Drought Monitor.
Palmer Drought Index
The Palmer drought indices measure the balance between moisture demand (evapotranspiration driven by temperature) and moisture supply (precipitation). The Palmer Z Index depicts moisture conditions for the current month, while the Palmer Hydrological Drought Index (PHDI) and Palmer Drought Severity Index (PDSI) depict the current month's cumulative moisture conditions integrated over the last several months. While both the PDSI and PHDI indices show long-term moisture conditions, the PDSI depicts meteorological drought while the PHDI depicts hydrological drought. The PDSI map shows less severe and extensive drought in parts of the West than the PHDI map because the meteorological conditions that produce drought and wet spell conditions are not as long-lasting as the hydrological impacts.
|
 |
Used together, the Palmer Z Index and PHDI maps show that short-term dry conditions occurred over parts of the West, expanding long-term dry conditions in February compared to January. Short-term wet conditions contracted long-term drought in southern New England. Continued short-term dry conditions in February reduced the intensity long-term wet conditions from the Southern Plains and Lower Mississippi Valley.
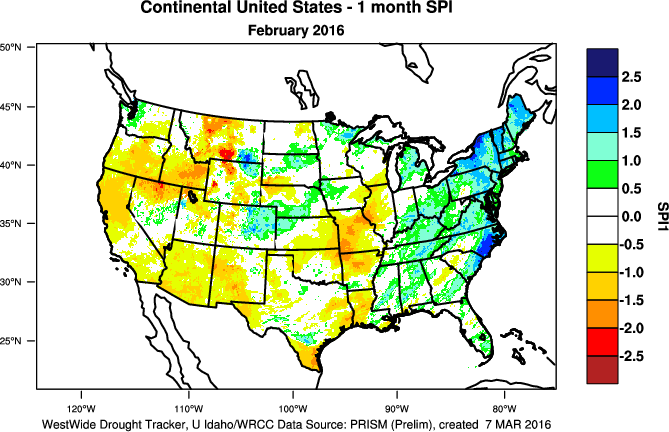
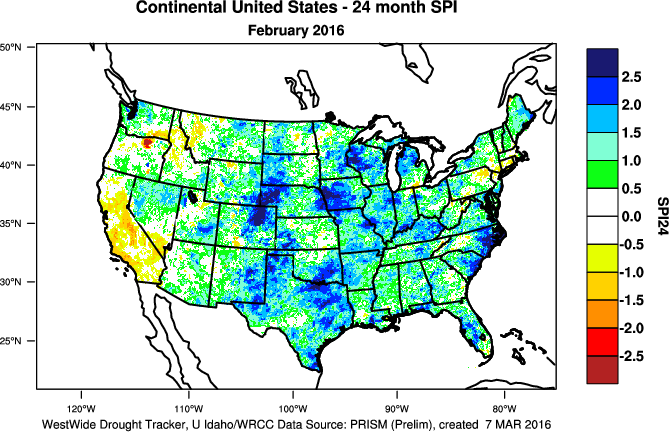
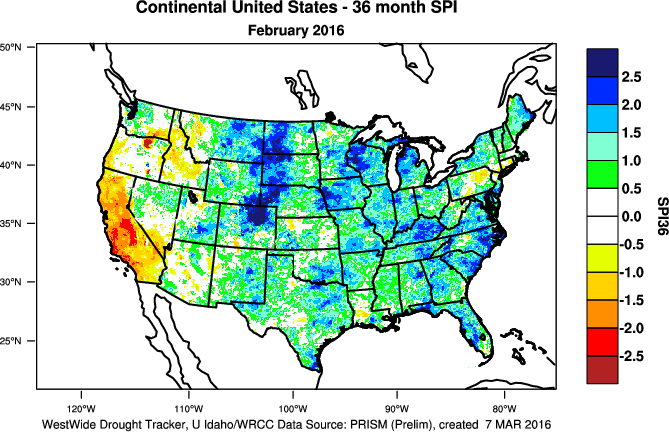
Standardized Precipitation Index
The Standardized Precipitation Index (SPI) measures moisture supply. The SPI maps here show the spatial extent of anomalously wet and dry areas at time scales ranging from 1 month to 24 months.
 |
 |
 |
The SPI maps illustrate how moisture conditions have varied considerably through time and space over the last two years. Dryness dominates the West on the 1-month SPI map, with dryness evident in parts of the Northwest, Northern Rockies, and Southwest at 2 months, but wet conditions become dominant at 3 to 9 months, especially along the Northwest coast and in the intermountain basin. Near-normal to dry conditions hold sway in the Northern Rockies to Northern High Plains throughout the seven time periods. California registers as dry to near normal for virtually all of the seven time periods. The last 1 to 2 months were quite dry from the Southern Plains to Mid-Mississippi Valley, with dryness patchy in parts of the Northern Plains and western Gulf of Mexico coast at 2 to 3 months. Wet conditions become evident across much of the CONUS east of the Rockies at 3 months, and hold sway from 6 to 24 months. Despite wet conditions in the Northeast at 1 to 3 months, dryness holds on in southern New England from 6 to 24 months.
 |
 |
 |
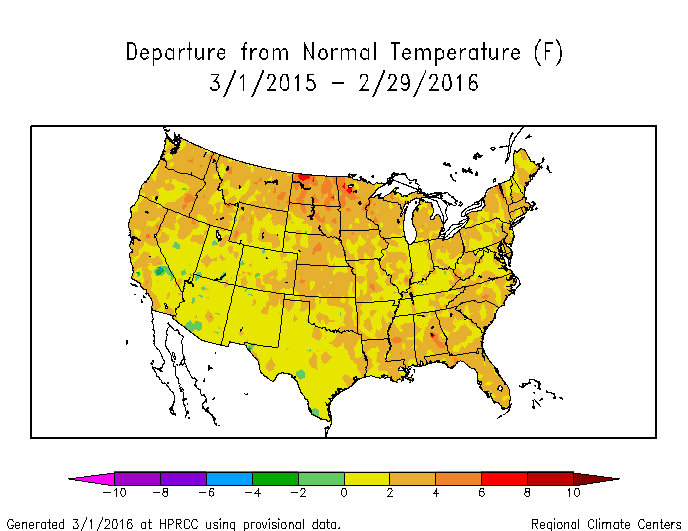
Standardized Precipitation Evapotranspiration Index
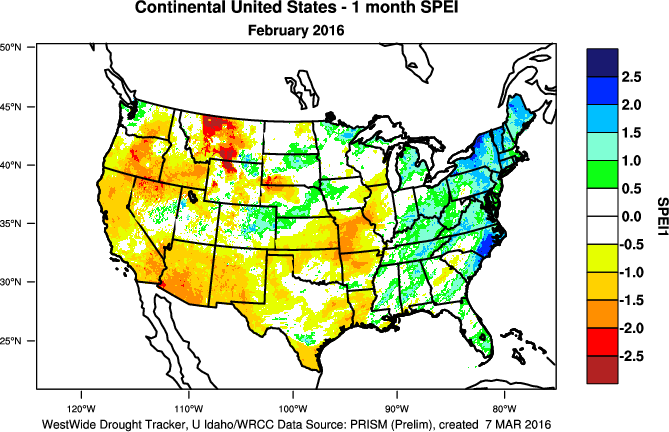
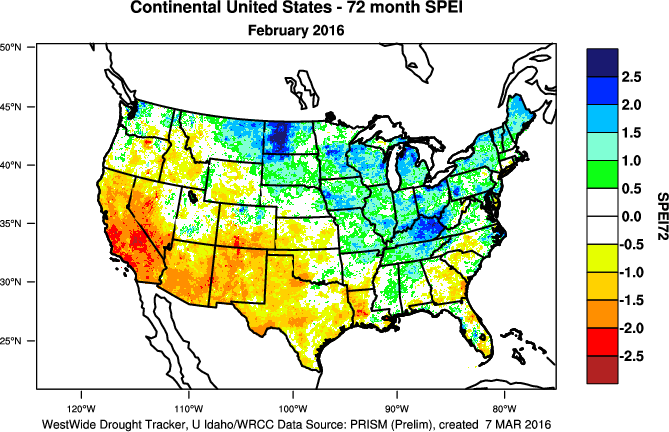
The SPI measures water supply (precipitation), while the SPEI (Standardized Precipitation Evapotranspiration Index) measures the combination of water supply (precipitation) and water demand (evapotranspiration as computed from temperature). Warmer temperatures tend to increase evapotranspiration, which generally makes droughts more intense.
 |
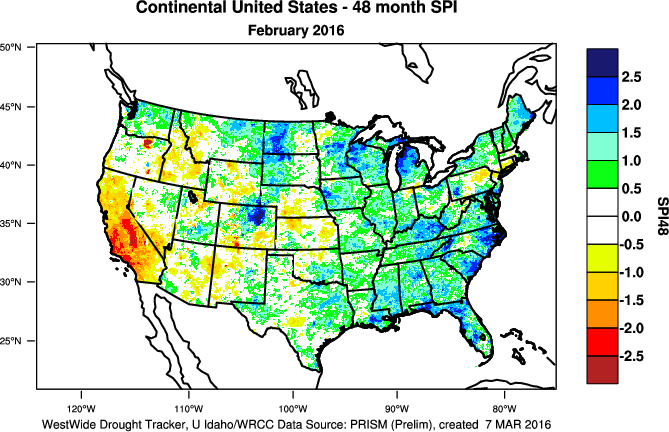 |
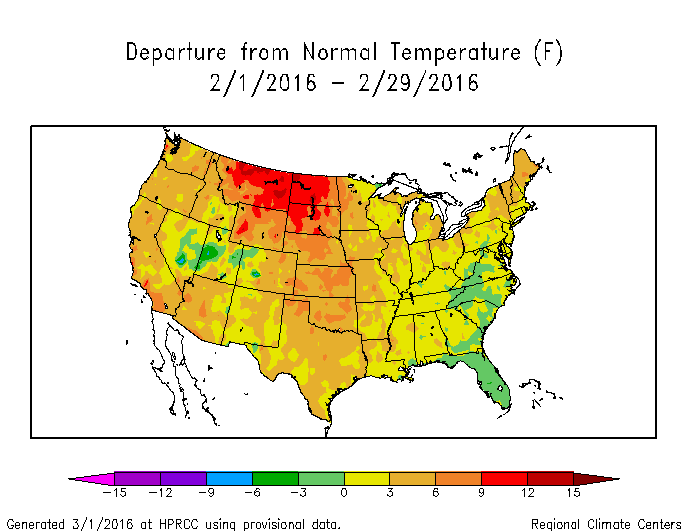
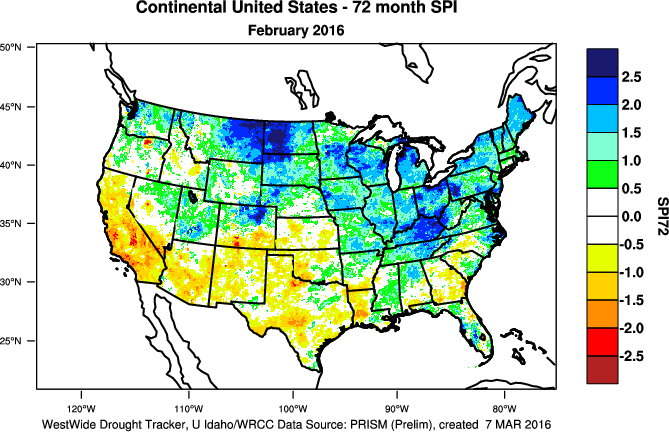
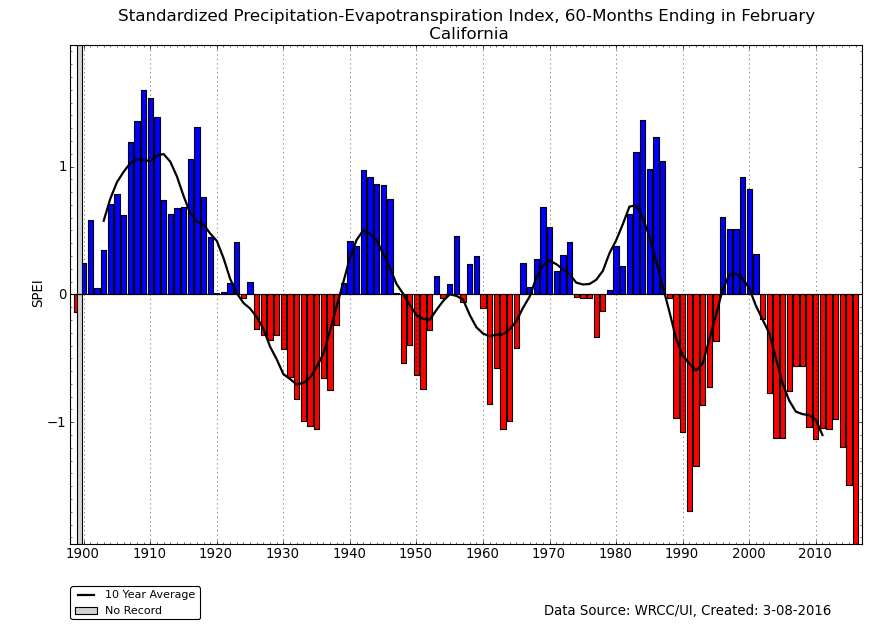
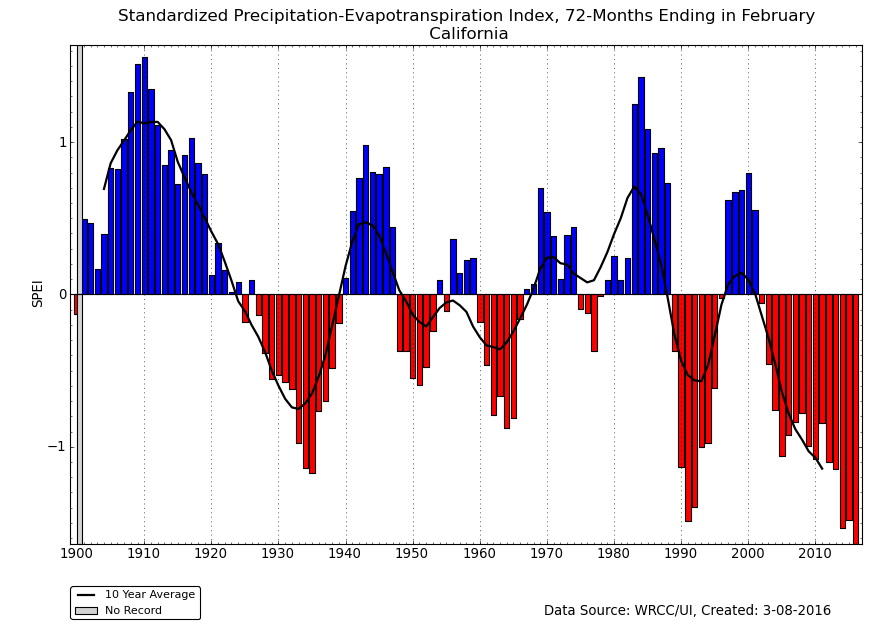
Temperatures were much warmer than normal across most of the West and Northeast during February 2016, and near to below normal in the Southeast. With this being the coldest time of year, evapotranspiration is at a minimum, so the February 1-month SPEI and SPI maps are similar in pattern and magnitude, although the SPEI still shows somewhat more severe dry conditions. But for the last six months, the combination of warmer- and drier-than-normal weather in Wyoming resulted in a more severe SPEI compared to SPI in that state for September 2015-February 2016. For the year as a whole, much of the country was warmer and wetter than normal, but the warmth in the West exacerbated the dry conditions there, resulting in more severe drought on the 12-month SPEI map there compared to the SPI. The persistent above-normal temperatures in the West have resulted in more severe SPEI values, compared to the SPI, for much of the last six years (SPEI maps for the last 24, 36, 48, 60, 72 months) (SPI maps for the last 24, 36, 48, 60, 72 months). The excessive heat has exacerbated drought conditions.
 |
|
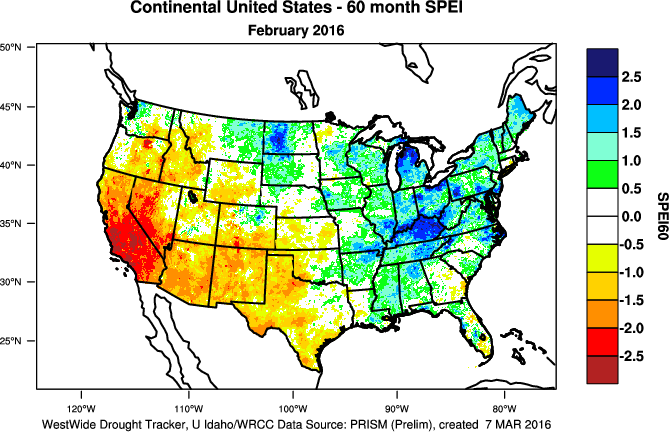 |
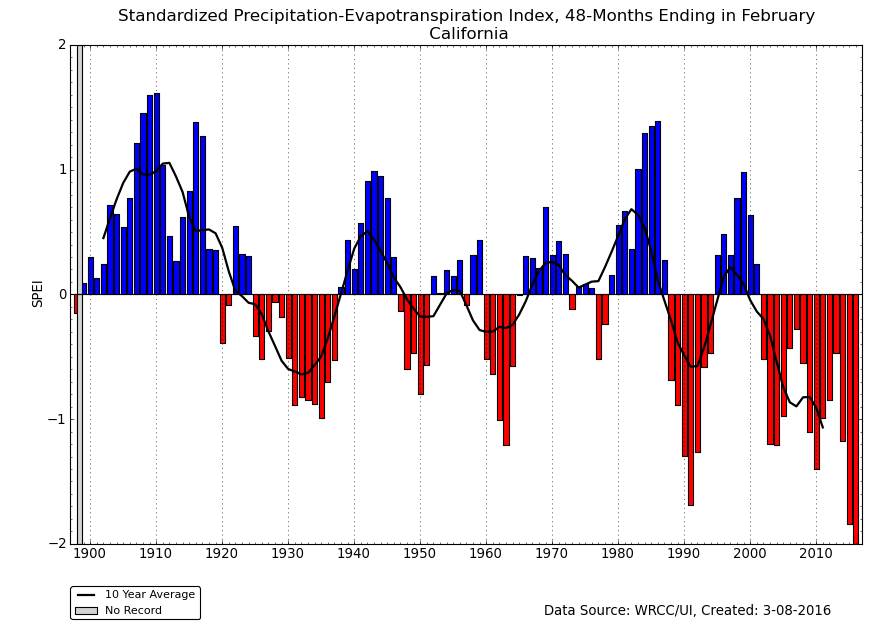
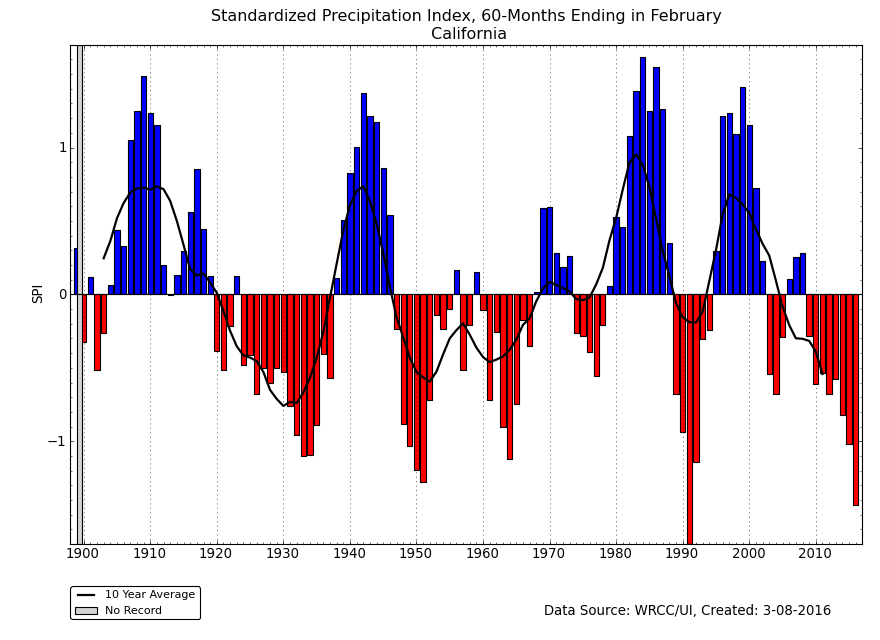
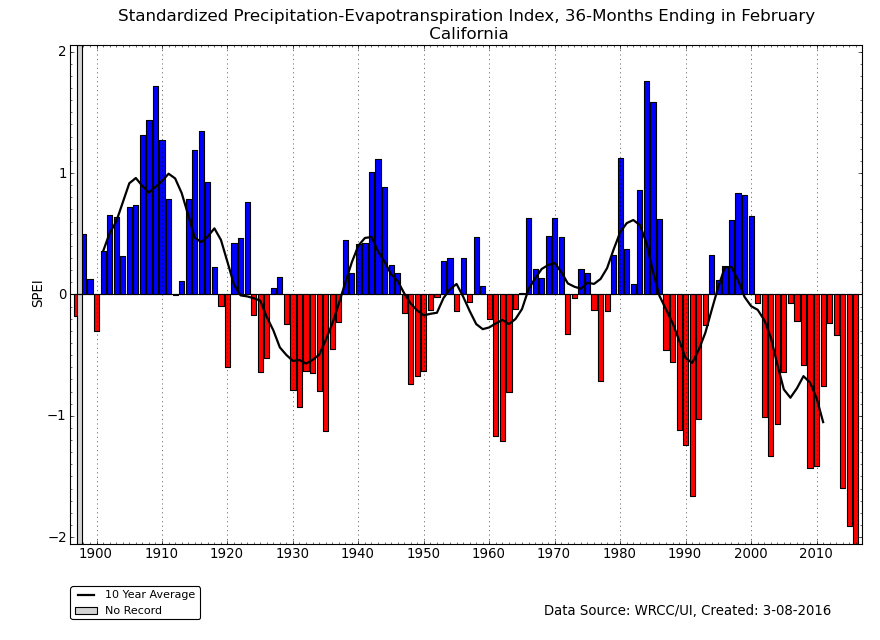
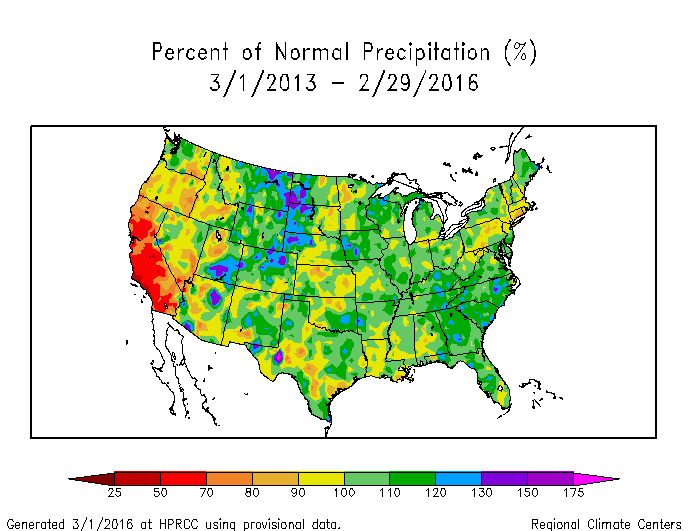
This is especially the case in California, where the last three March-February 12-month periods ranked as the warmest, second warmest, and third warmest such periods in the 1895-2016 record, and all three were much warmer than all of the years before them. The last three years cap a period of persistent unusual warmth which has lasted over three decades. The precipitation earlier this winter helped raise California's statewide precipitation rank to 39th driest for March 2015-February 2016. But the persistent dryness over the last nine years still gave the state the second driest SPI for the last 60 months. When the temperature is factored in, California has had the most severe SPEI for the last 36, 48, 60, and 72 months.
 |
 |
Regional Discussion
 |
 |
CONUS Agricultural & Hydrological Impacts:
Improving drought conditions were reflected in numerous agricultural, hydrological, and other meteorological indicators, both observed and modeled. As of March 1st, ten percent of the nation's cattle inventory, eight percent of the nation's hay, six percent of winter wheat production, and less than one percent of soybean production and corn production were in drought. These are decreases compared to a month ago.
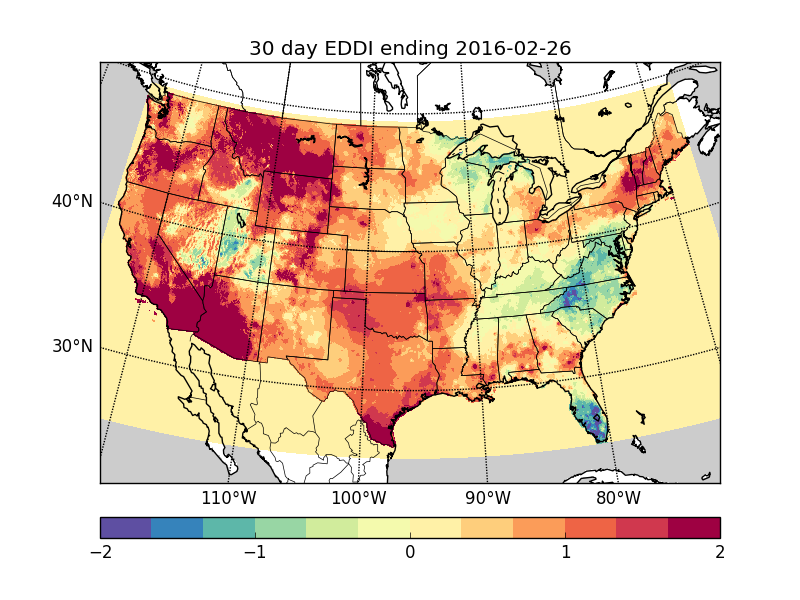
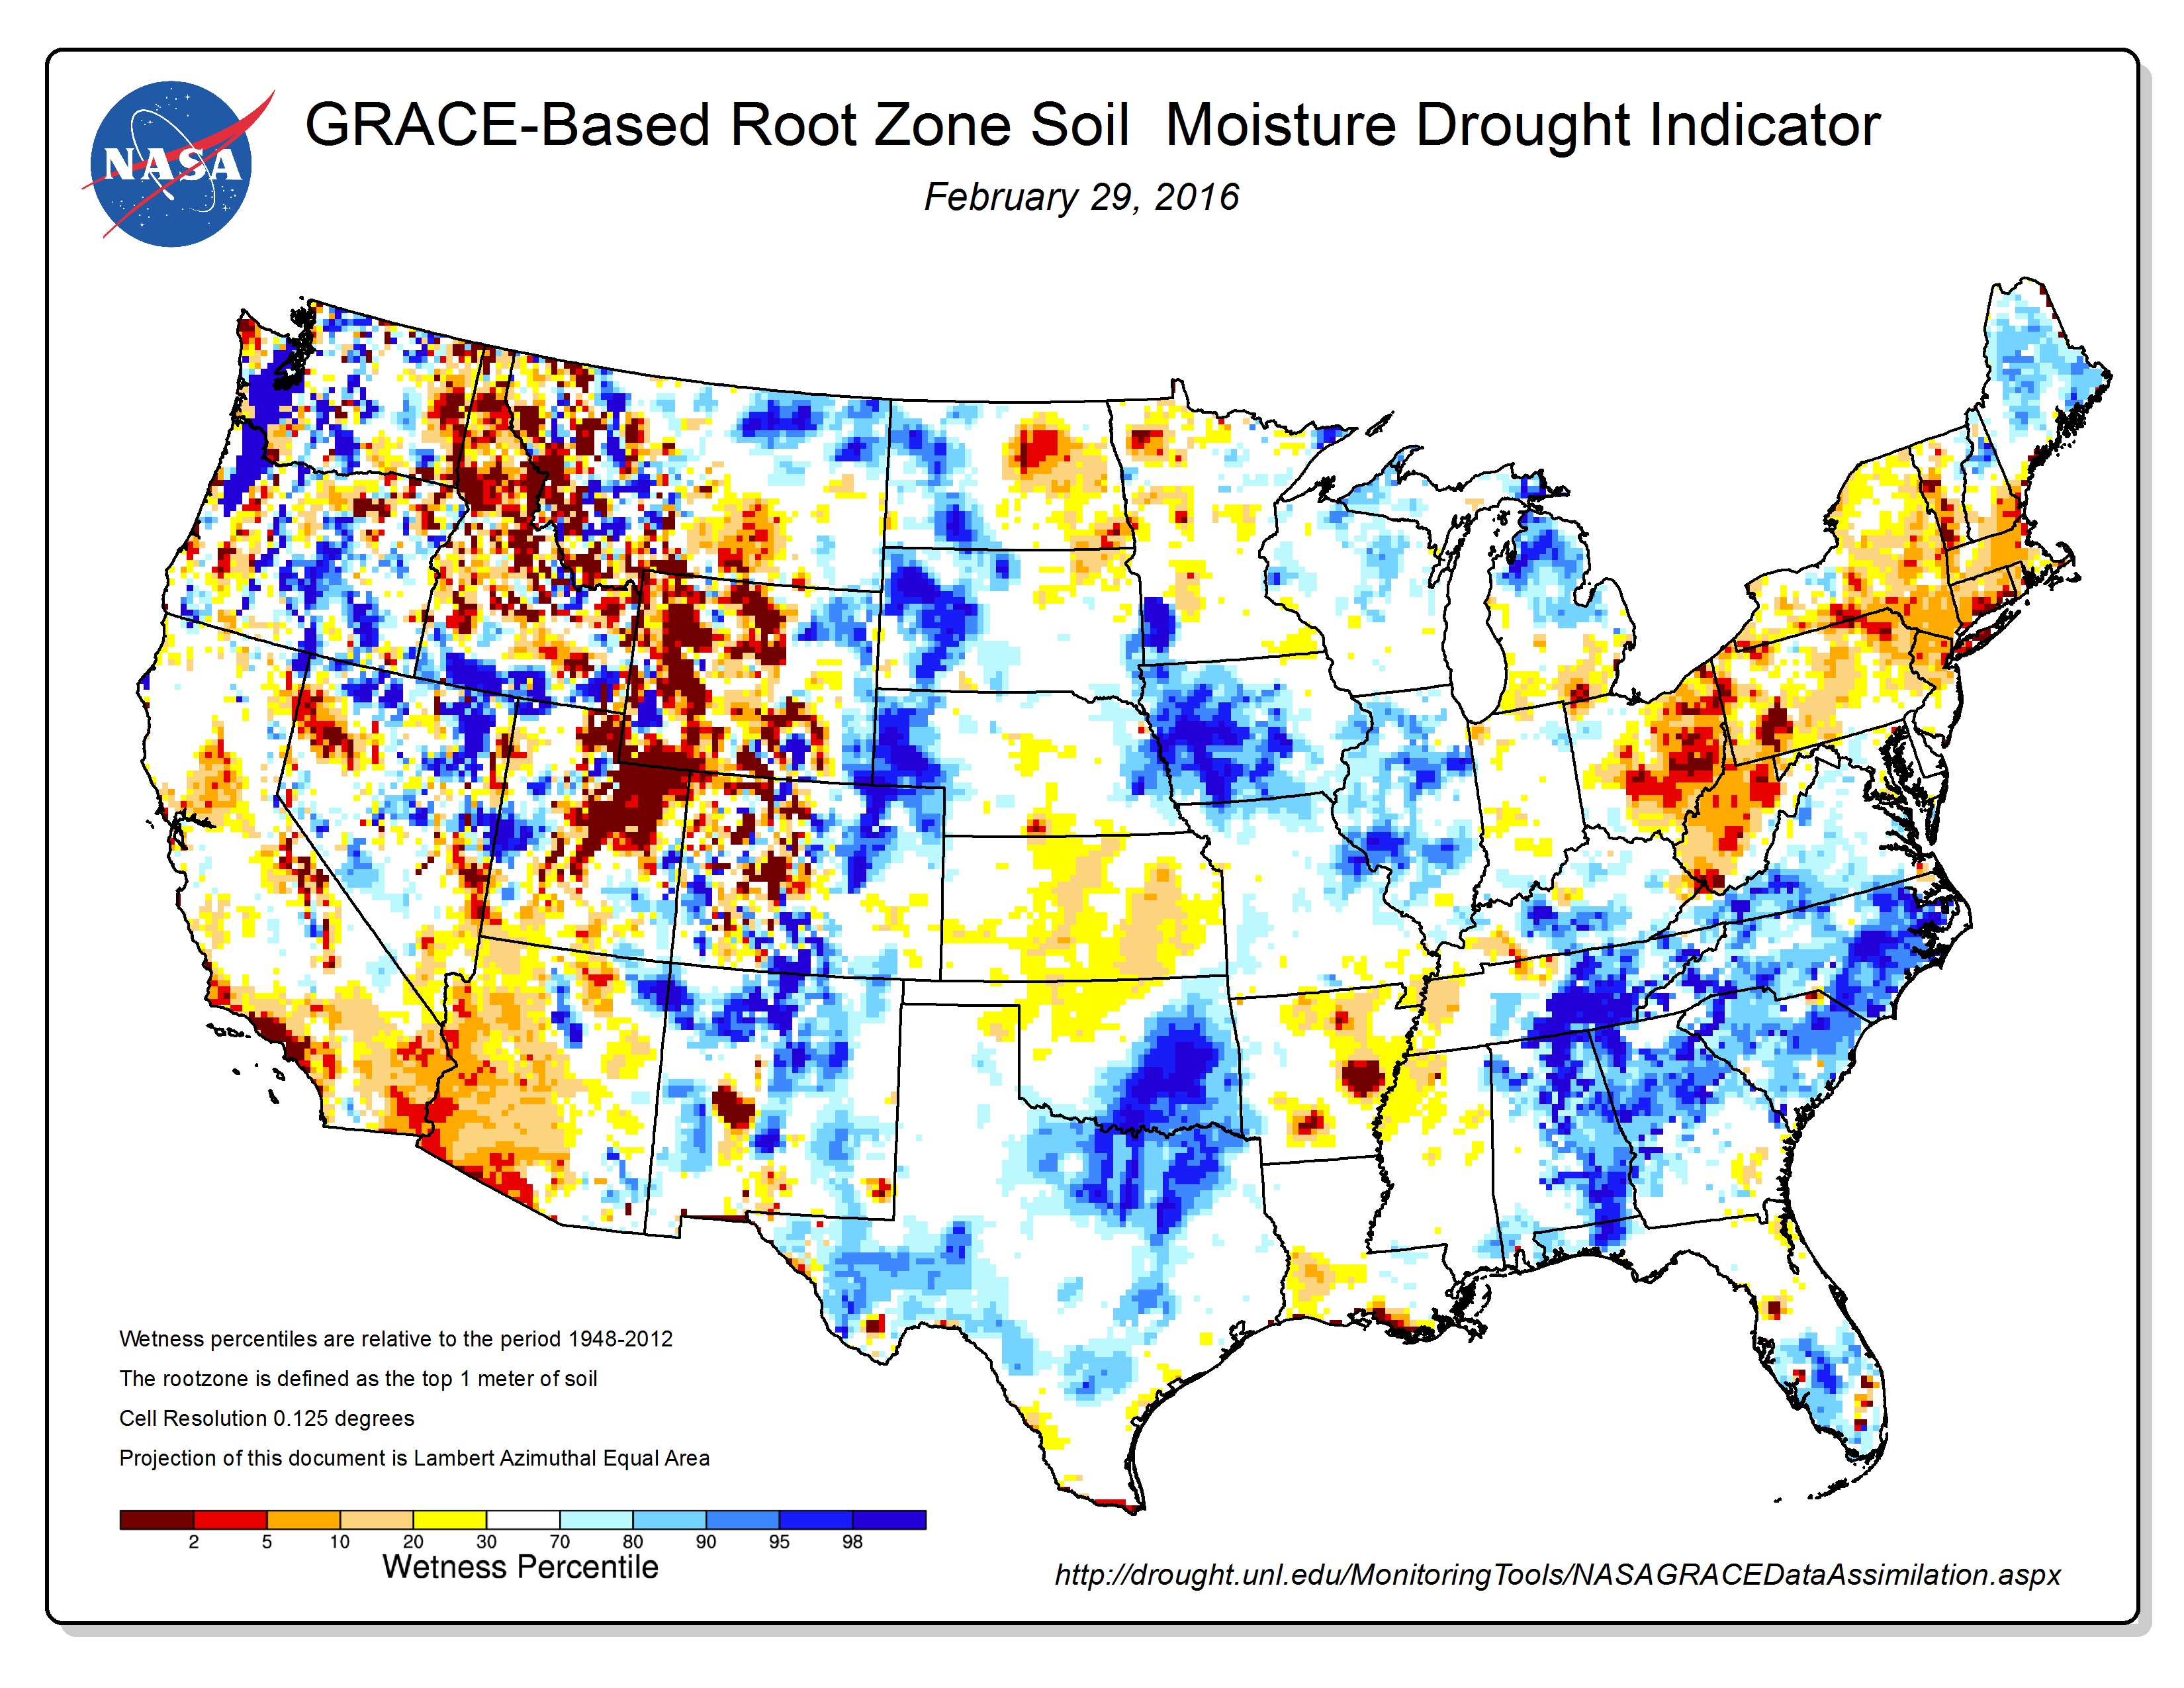
The below-normal precipitation in the Southern Plains to Midwest during the last two months resulted in decreasing soil moisture conditions. Soil moisture was still near to above normal in the Southern Plains and Southeast from previous wet months, but soils were getting dry from Wyoming to North Dakota. Evaporative demand was above normal from the West Coast to the Mississippi River, and in the Northeast, mainly due to the above-normal temperatures.
Drought conditions at the end of the month, as depicted on the March 1st USDM map, included the following CONUS core drought and abnormally dry areas:
- Moderate (D1) to severe (D2) drought covered a large part of the western U.S., with extreme (D3) to exceptional (D4) drought extending from California into Nevada. —
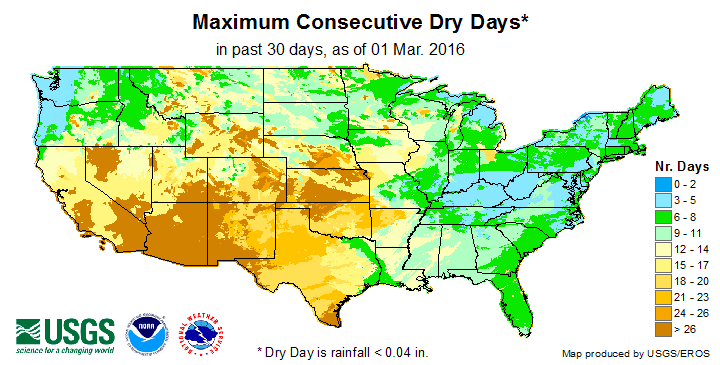
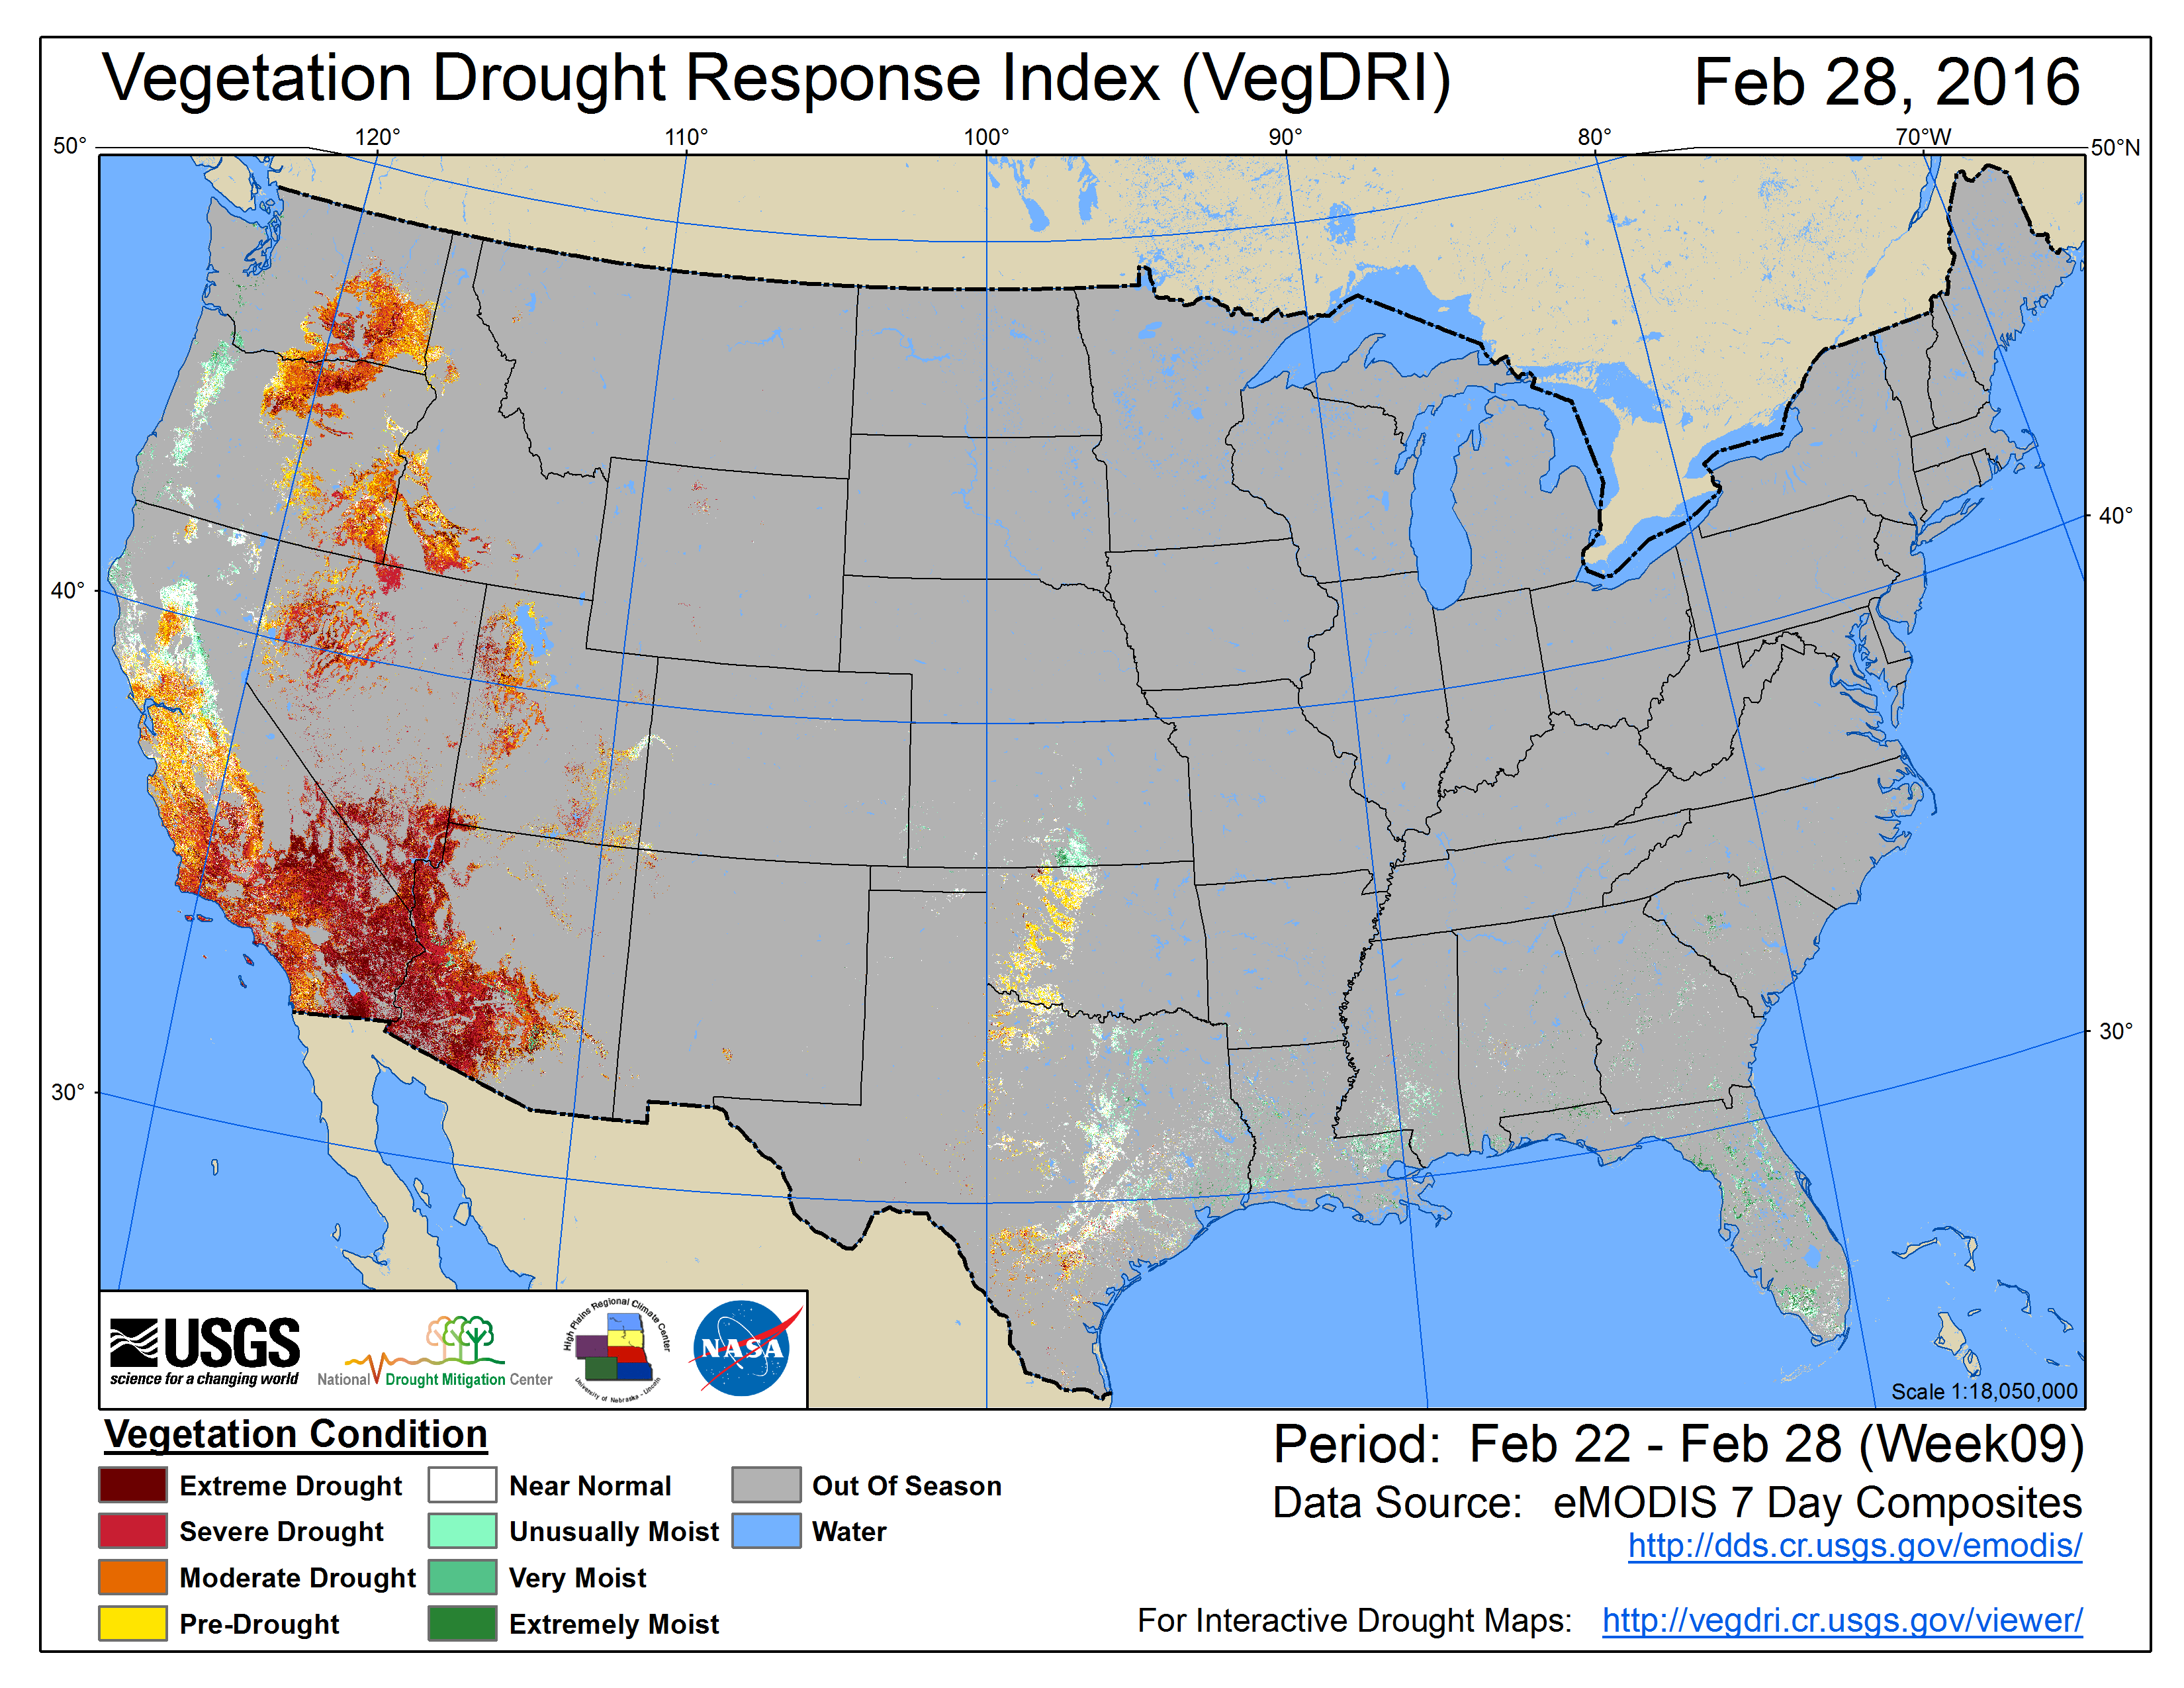
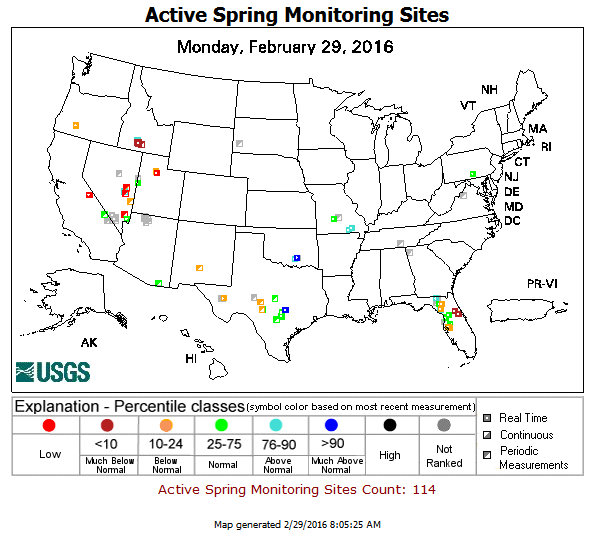
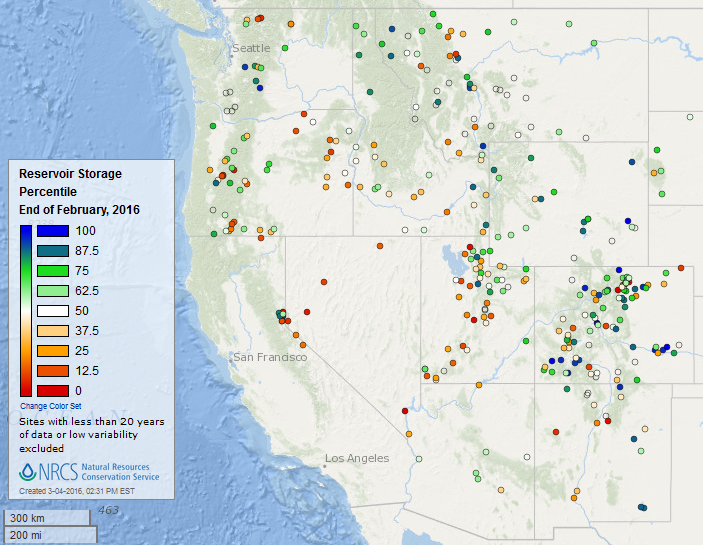
- February 2016 was characterized by below-normal precipitation across the West and few days with precipitation and long runs of consecutive dry days in the Southwest. The VegDRI tool showed vegetative impacts from drought still widespread across the West, with vegetation slow to recover from drought. Some springs and groundwater levels were still low in parts of the West. Soil moisture was still dry in parts of the Rockies and Southwest. In spite of this winter's precipitation, especially in the Northwest, reservoir levels were still below average in many of California's reservoirs, as well as reservoirs in many other western states. Mountain snowpack was low in Arizona and New Mexico, parts of Oregon, and some rainshadow areas of Montana and Wyoming. But snowpack was near to above normal in other parts of the West due to beneficial snowfall from late fall and early winter storms. The favorable snowpack and streamflow conditions contributed to drought contraction in parts of the West, but the continued low reservoir conditions contributed to drought continuing across much of the West.
- Abnormally dry to moderate drought conditions continued in parts of the Northern Plains and redeveloped in parts of the Southern Plains. —
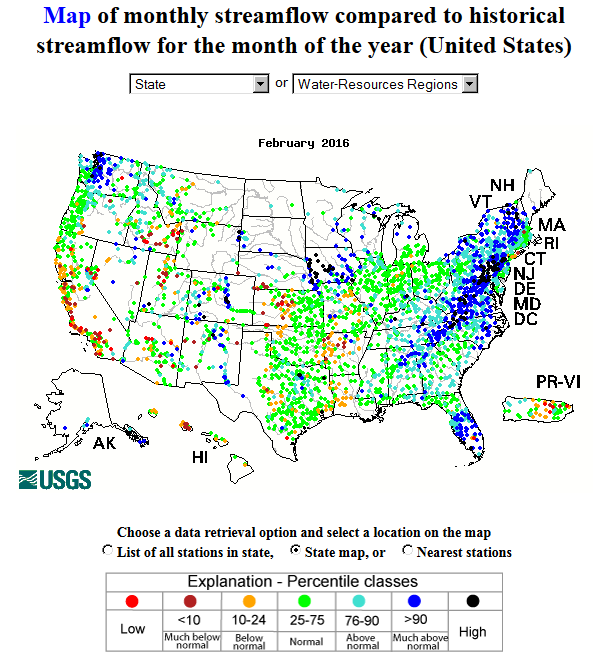
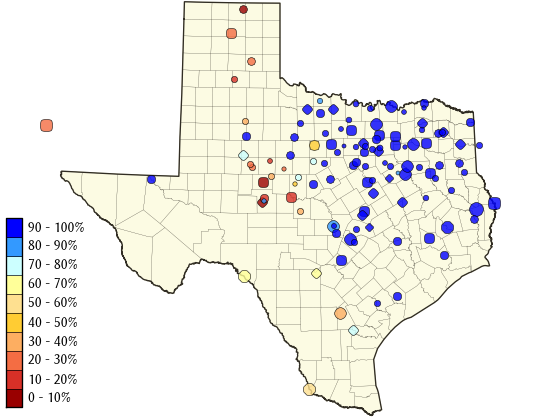
- Modeled soil moisture was dry in parts of the Central and Northern Plains. Some ground water and streamflow levels were low, and there were few days with precipitation and long runs of consecutive dry days, in parts of the Central to Southern Plains. Numerous large wildfires developed in Oklahoma, especially during the last half of the month. Some reservoirs in west-central and panhandle Texas were still low. The recent dryness has created moisture stress in the Lower to Mid Mississippi Valley, according to satellite observations of vegetation condition.
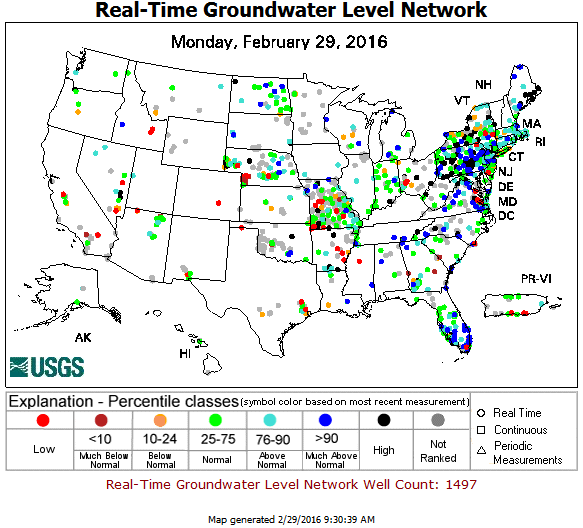
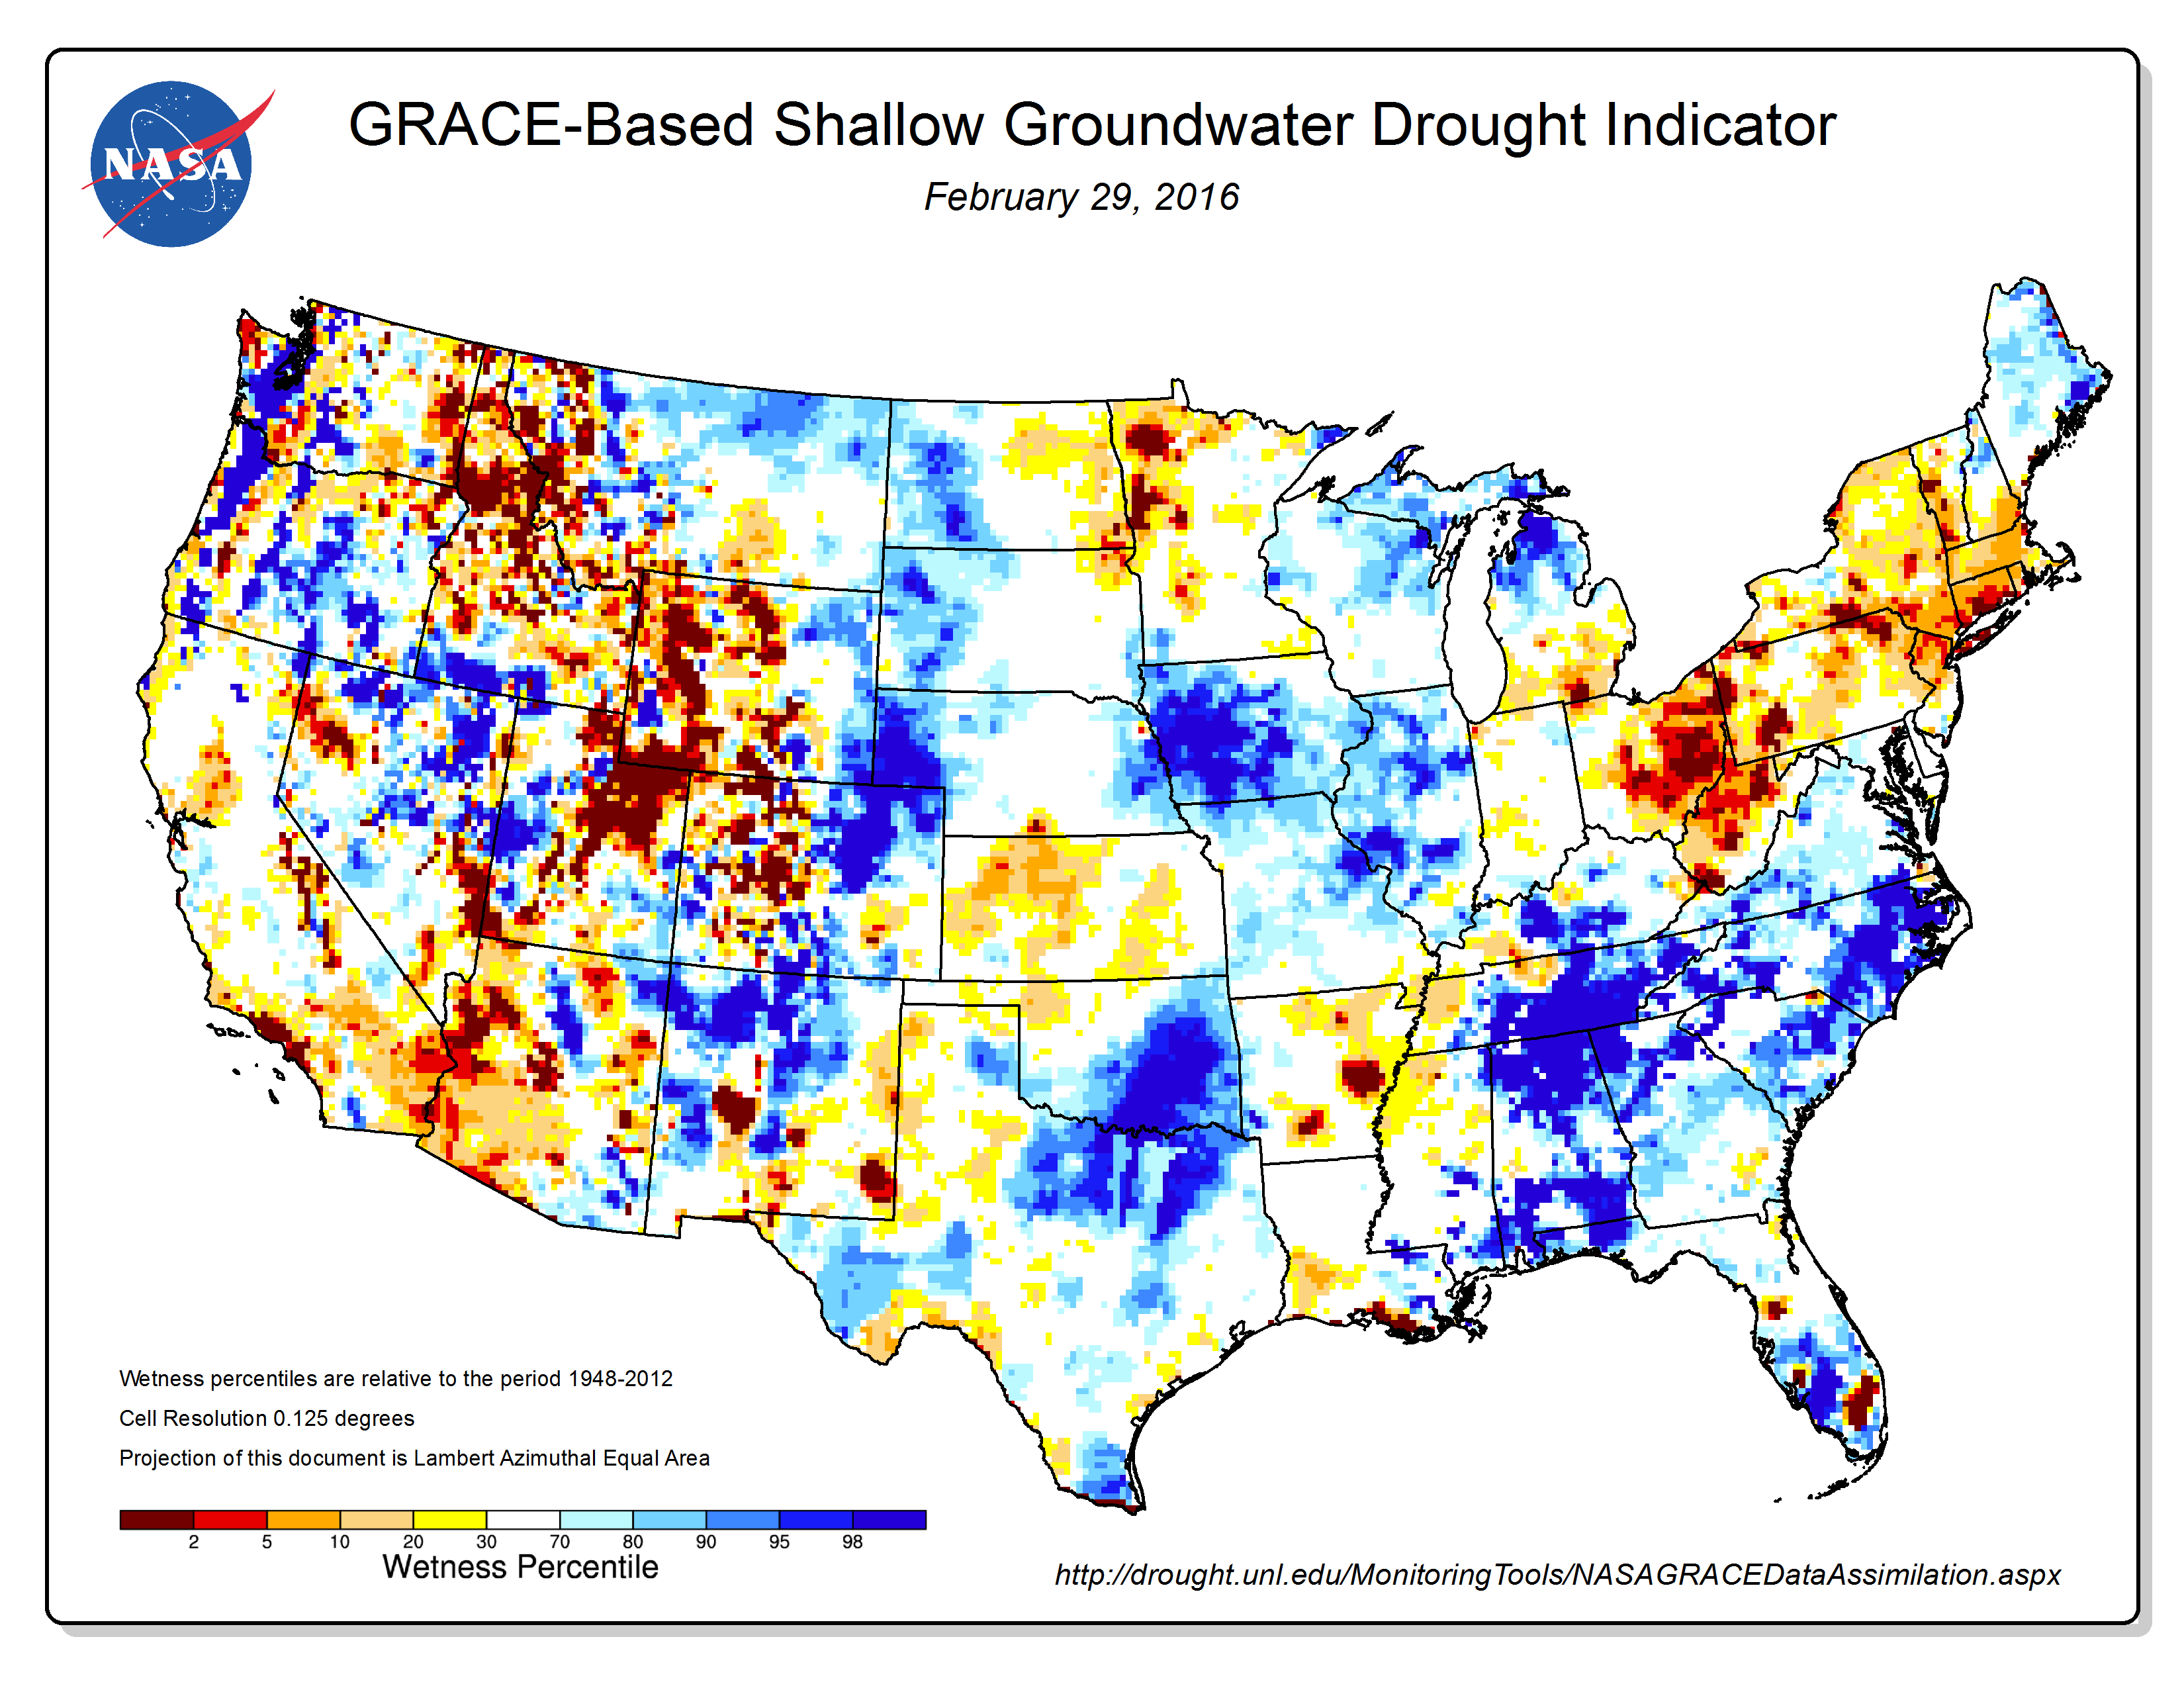
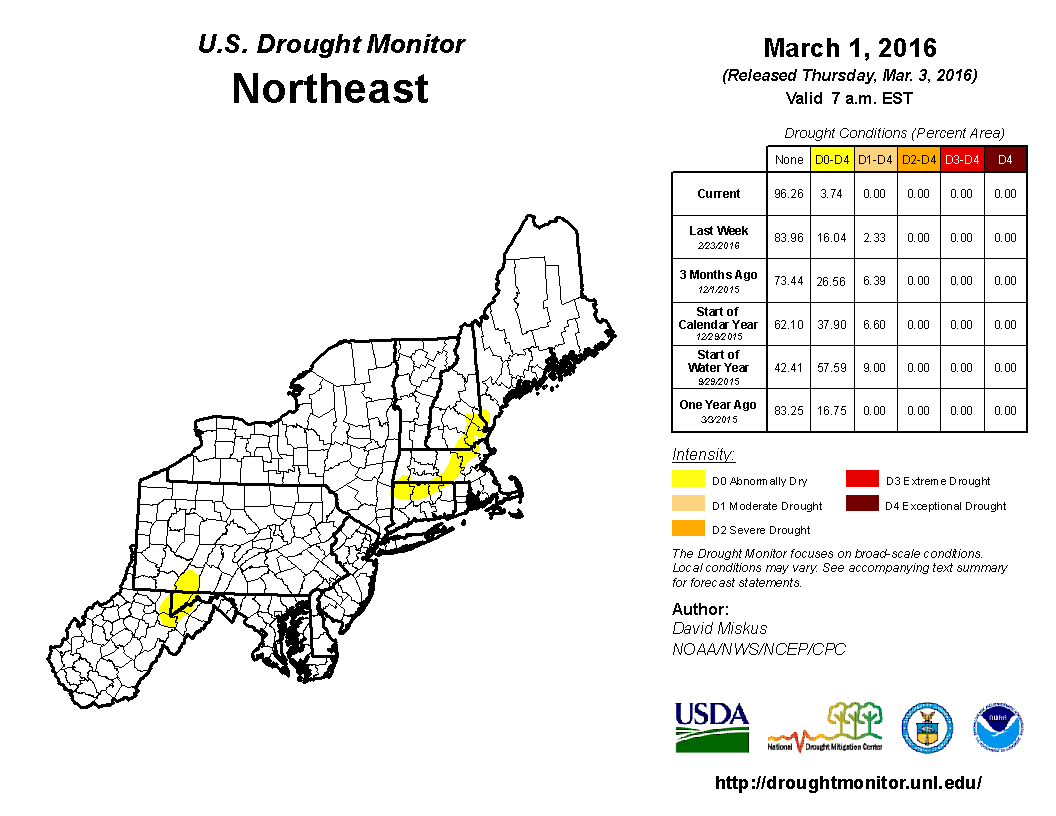
- Although February precipitation eliminated drought from the Northeast, pockets of abnormal dryness remained. According to the GRACE model, groundwater levels were still low and soil moisture was still dry in parts of the Northeast and Central Appalachians.
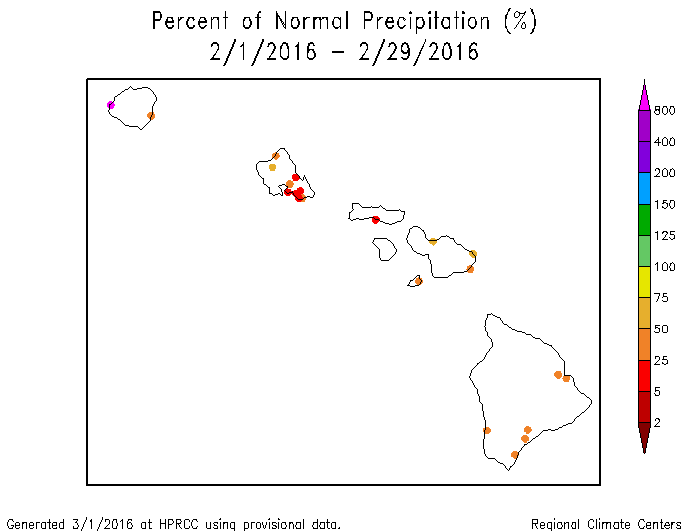
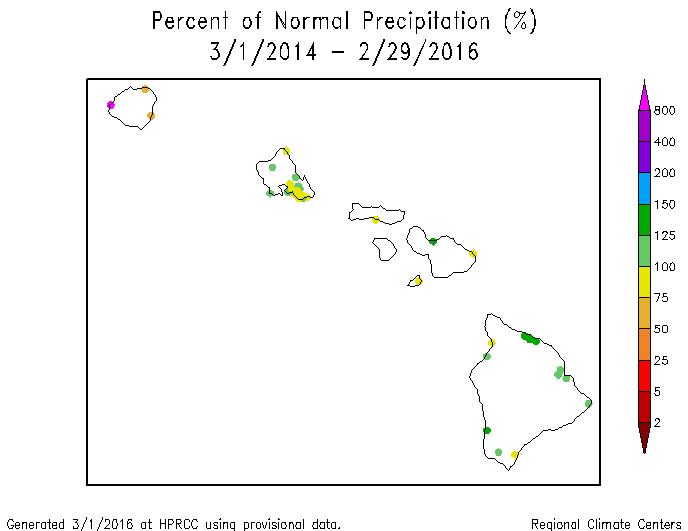
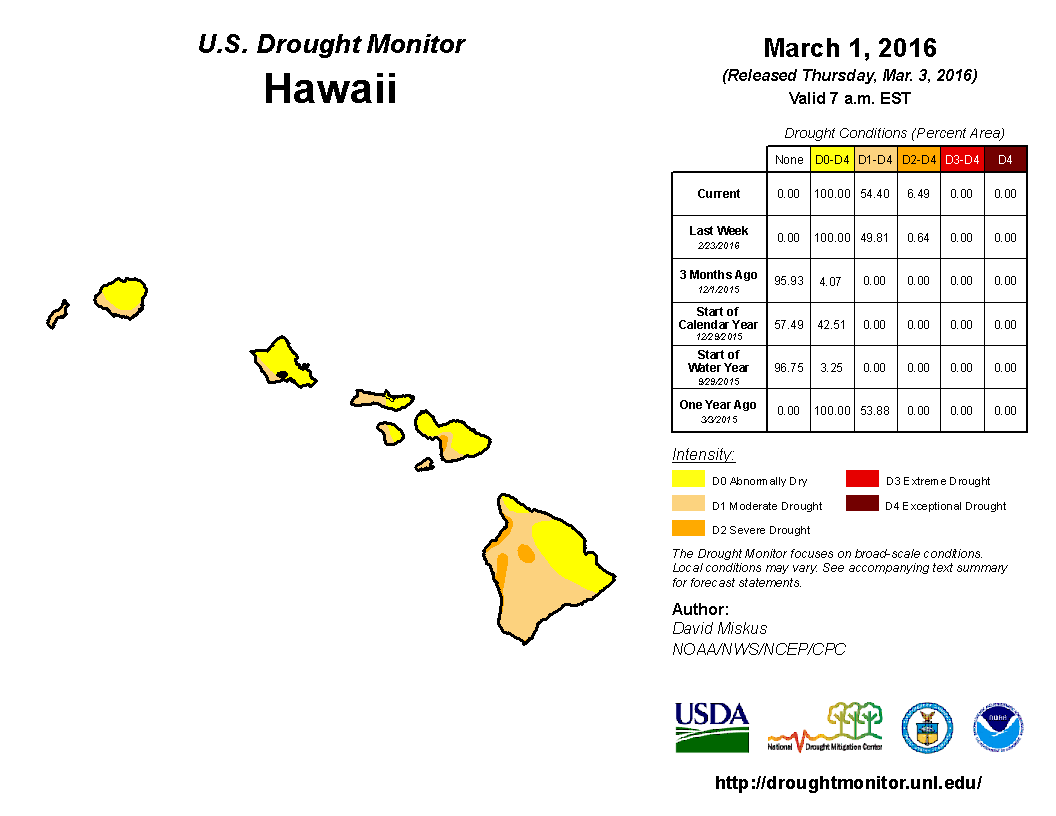
Hawaii: February 2016 continued a dry trend across much of Hawaii which has lasted much of the last five months (last 1, 2, 3, and 5 months). A mixed precipitation anomaly pattern is evident at the longer time scales (last 6, 8, 11, 12, 24, and 36 months). Streamflow was low on some islands, and pasture conditions and other vegetation conditions worsened. Moderate drought had expanded to cover more than half of the state, with severe drought covering about 6 percent, on the March 1st USDM map.

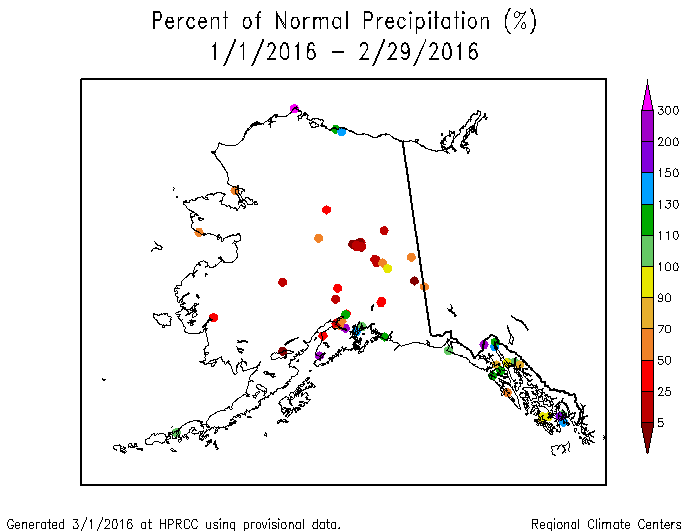
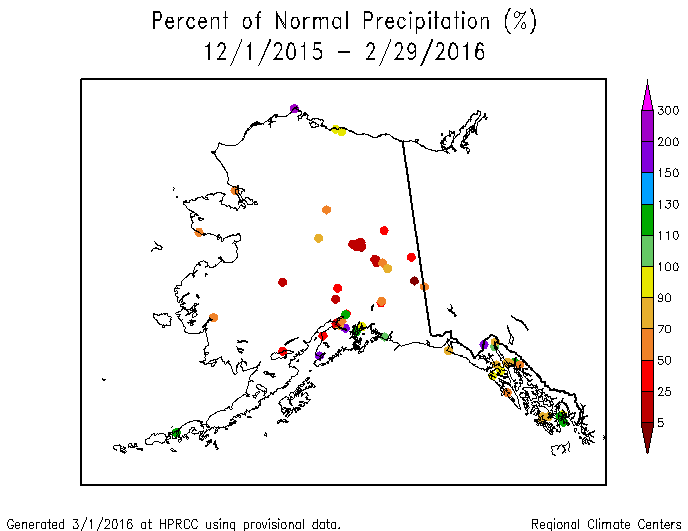
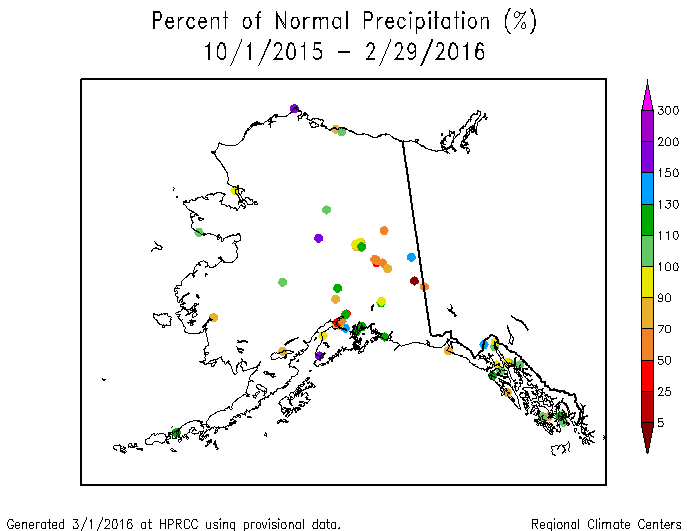
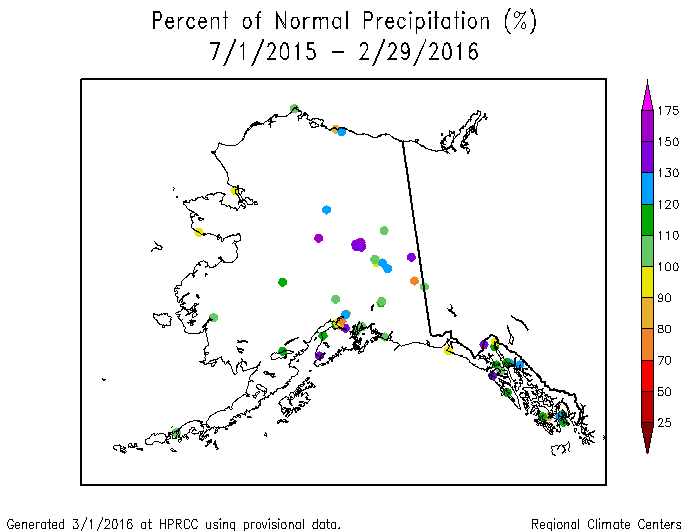
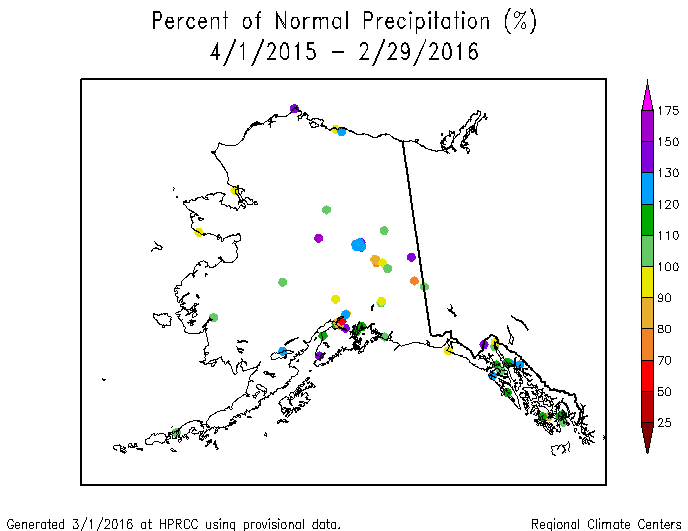
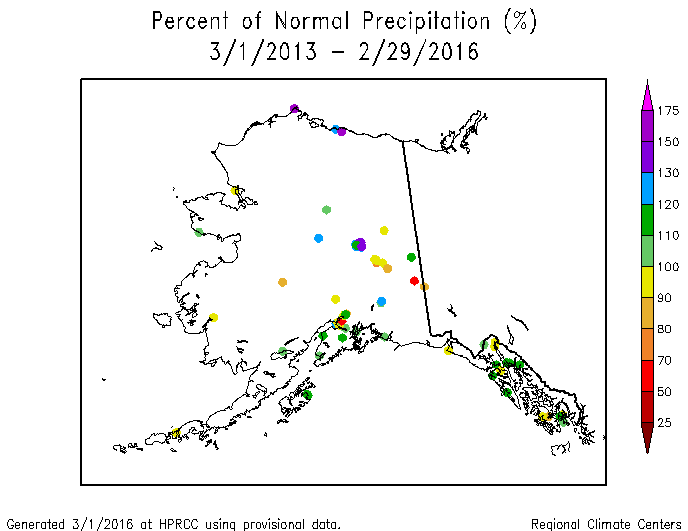
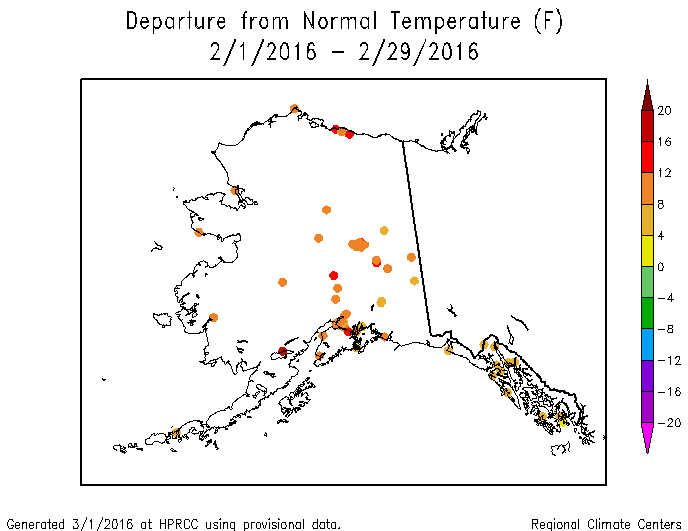
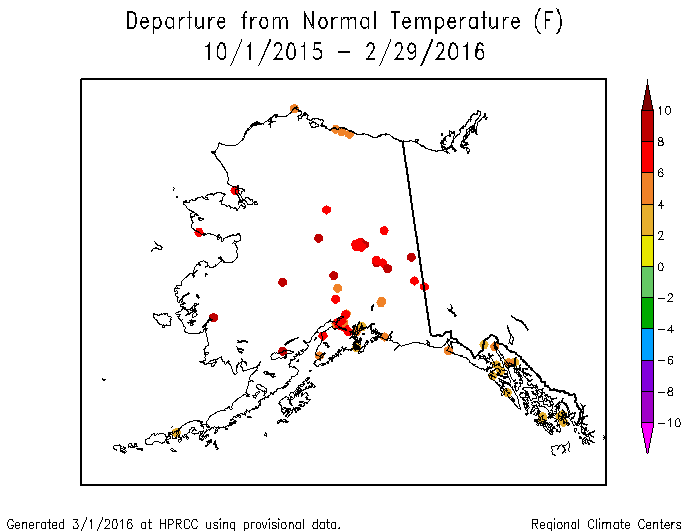
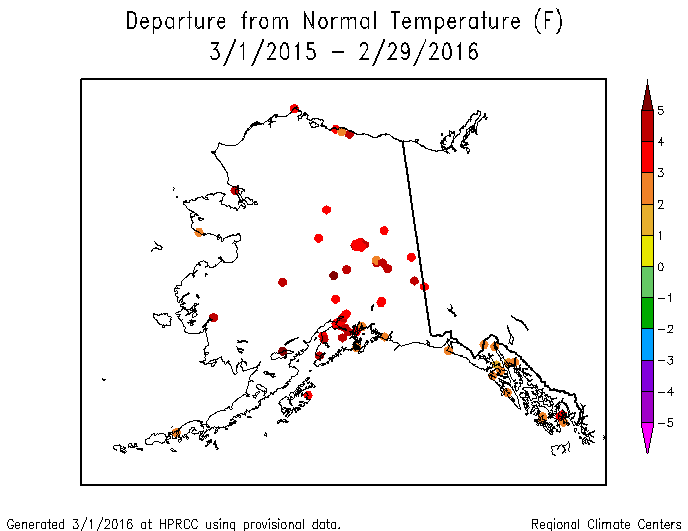
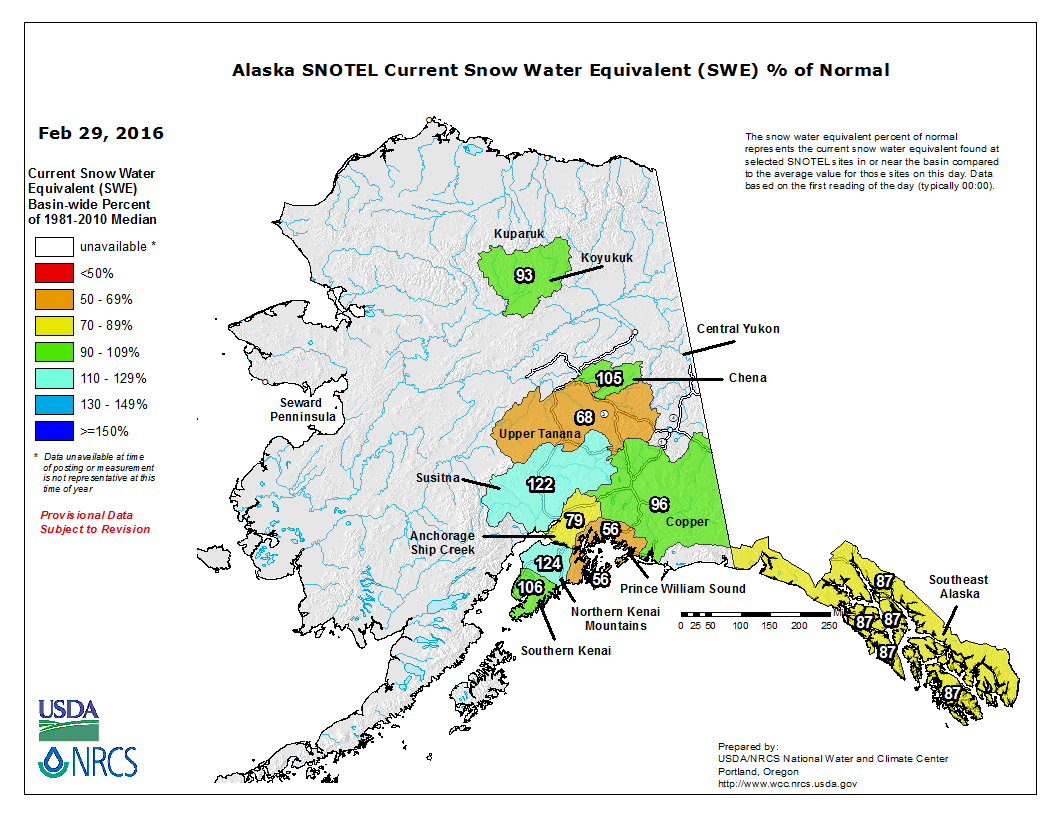
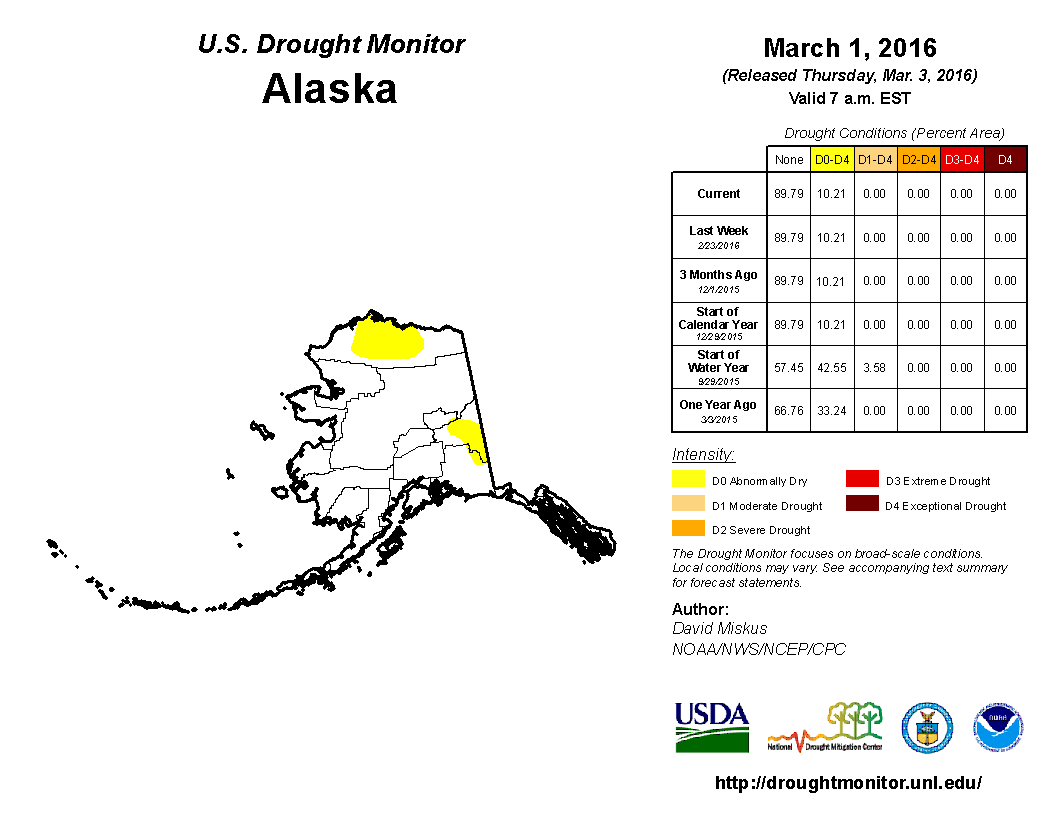
Alaska: A drier-than-normal precipitation pattern dominated Alaska in February and throughout the winter (divisional precipitation ranks for February, January-February, December-February) (station percent of normal precipitation for February, January-February, December-February). This is in contrast to the wetter pattern of the previous months (station maps for the last 5, 6, 8, 11, 12, 24, and 36 months) (climate division maps for the last 6 and 12 months). Warmer-than-normal temperatures have dominated for most of the last 12 months on both the climate division (last 1, 2, 3, 6, 12 months) and station (last 1, 2, 3, 5, 12 months) analyses. Snowpack water content was varied from basin to basin. Abnormal dryness continued across 10.2 percent of the state on the March 1st USDM map.
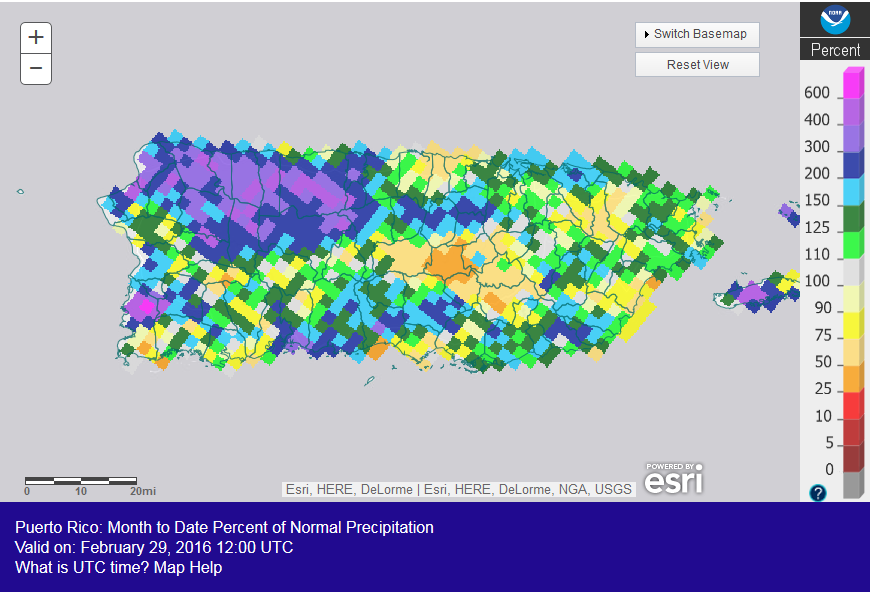
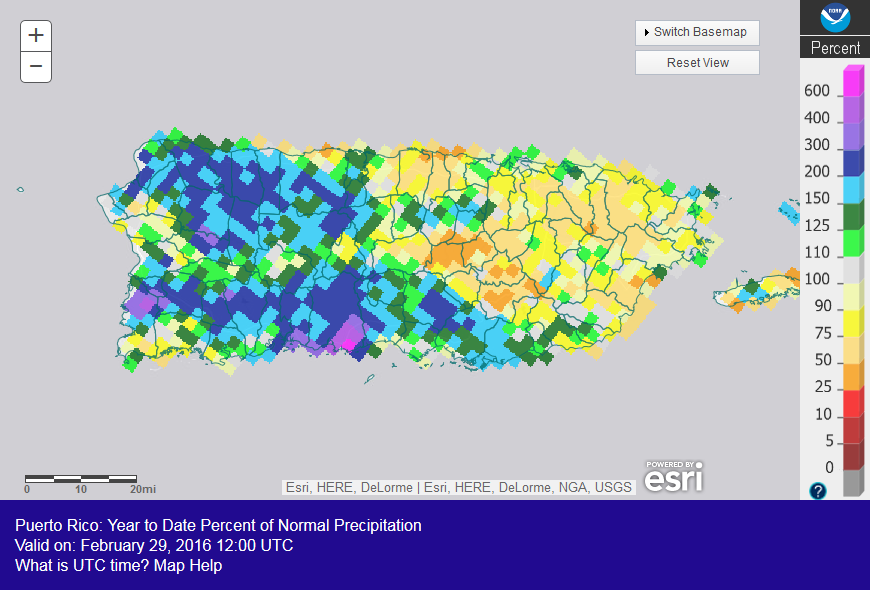
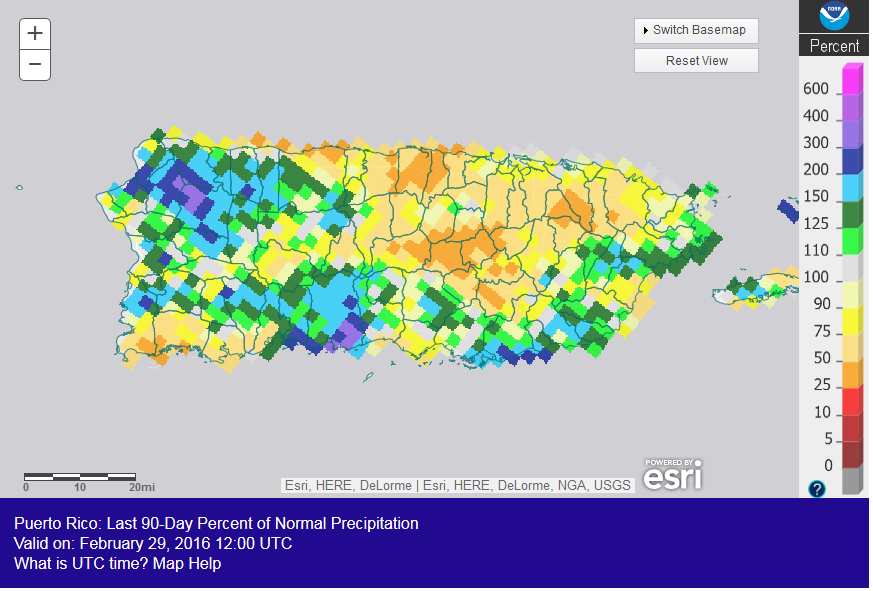
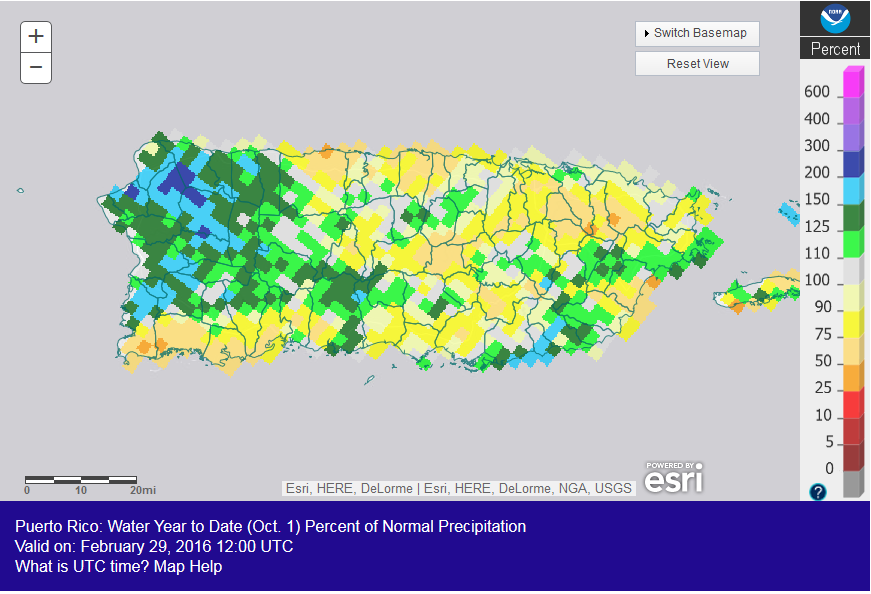
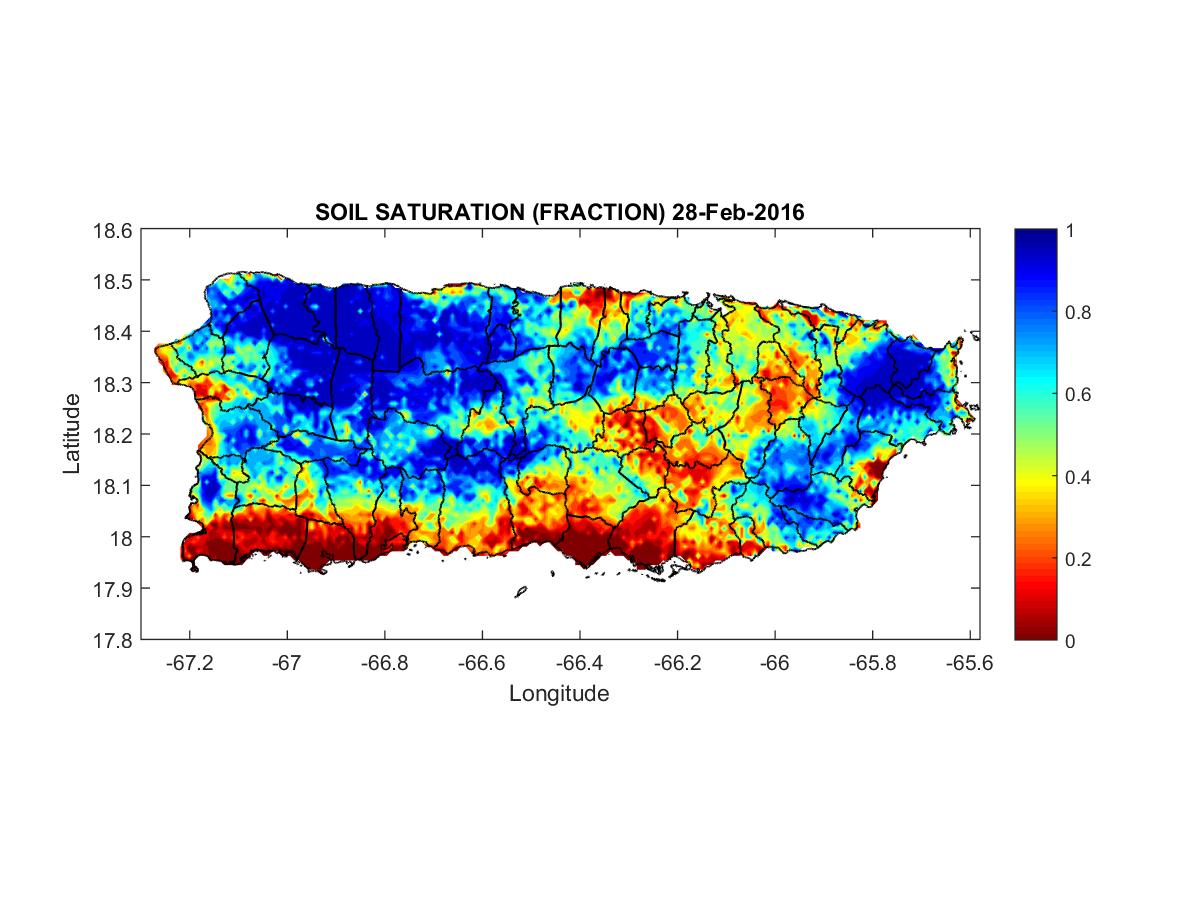
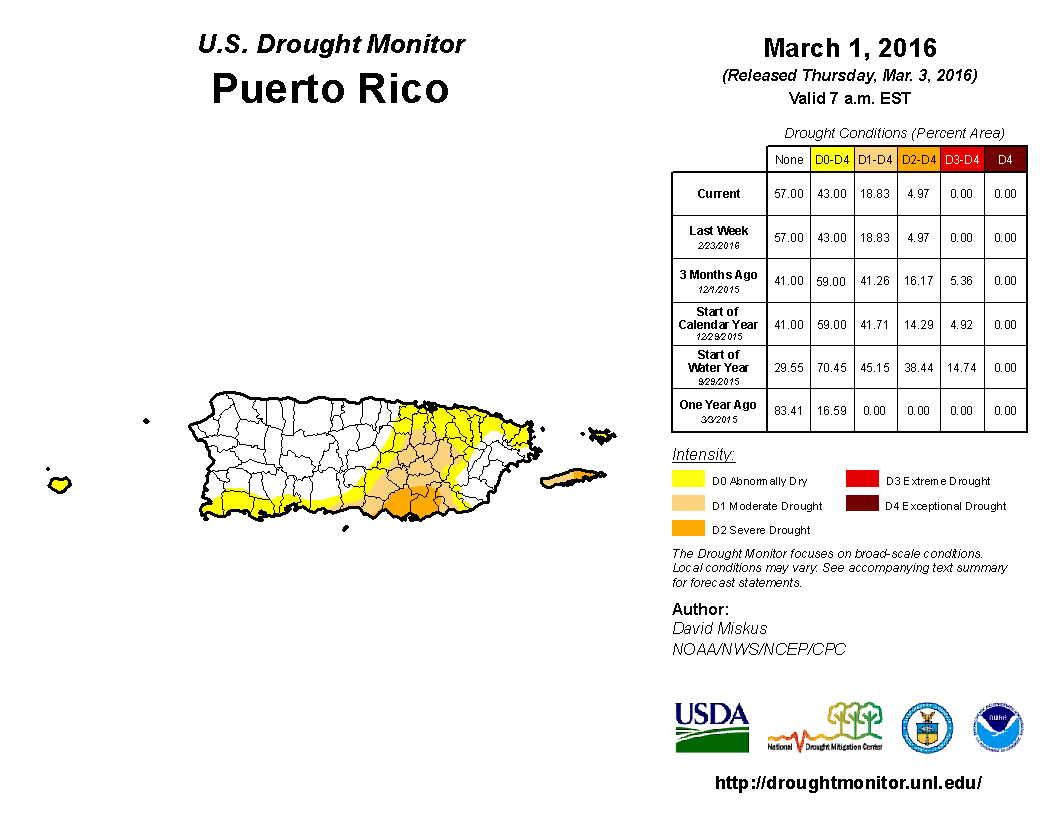
Puerto Rico: Much of Puerto Rico was wetter than normal during February. Dryness dominated at most other time scales (last 2, 3, 5, 6 months), except for wetter-than-normal conditions in the west. Soils continued dry across the southern coastal area and parts of the east. On the February 2nd USDM map, abnormal dryness and drought shrank to about 43.0 percent of Puerto Rico, with moderate to extreme drought shrinking to 18.8 percent of the island.
CONUS State Precipitation Ranks:
 |
|
Connecticut statewide precipitation, March-February, 1895-2016.
February 2016 was drier than normal across much of the country from the West Coast to the Mississippi Valley, with 16 states ranking in the driest third of the 1895-2016 record. The year-to-date was drier than normal for much of this same area, with 12 states ranking in the driest third of the historical record and two — Illinois and Missouri — having the tenth driest, or drier, January-February.
With wet conditions dominating in December and earlier months, most states had precipitation ranks in the near-normal to wetter-than-normal range for December-February, September-February, and March-February. One state ranked in the top ten driest category — Connecticut — with the ninth driest March-February.
|

|
Percent area of the Western U.S. in moderate to extreme drought, January 1900 to present, based on the Palmer Drought Index.
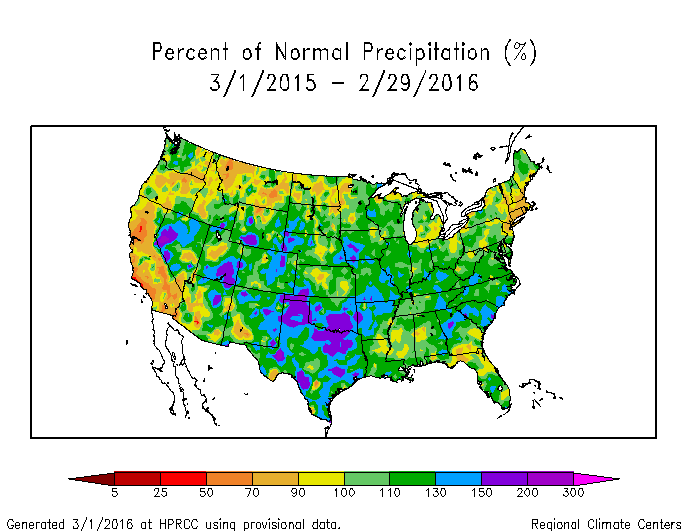
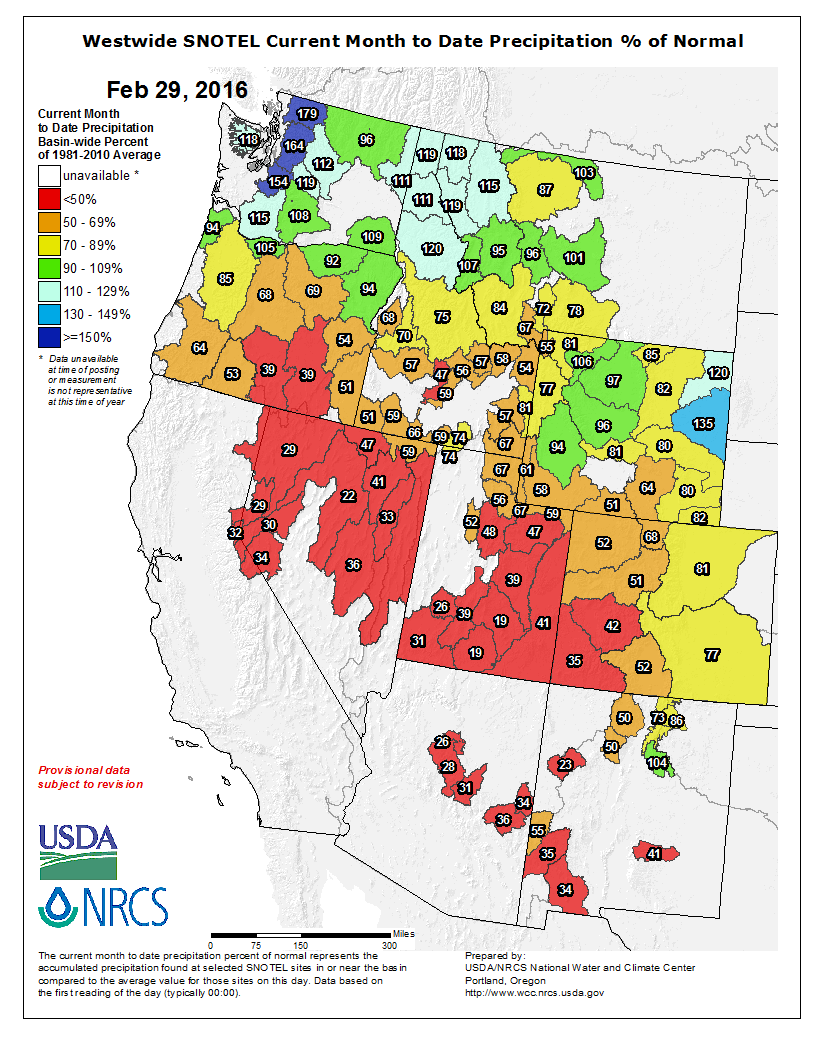
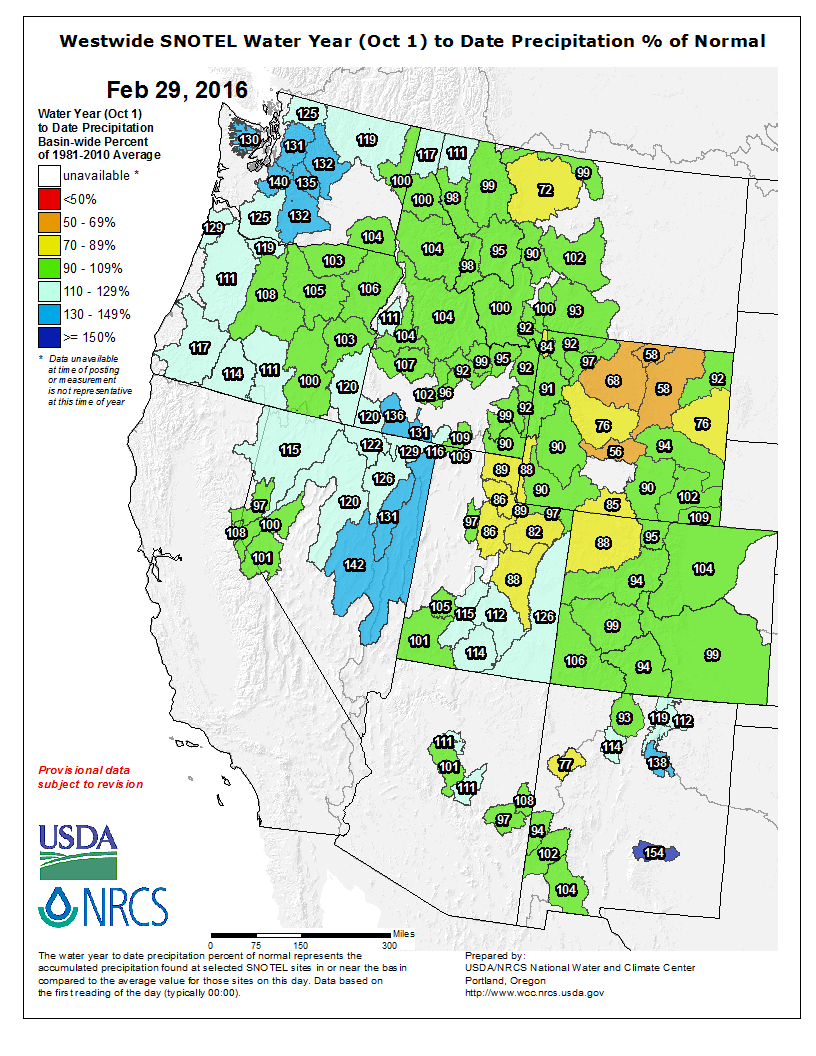
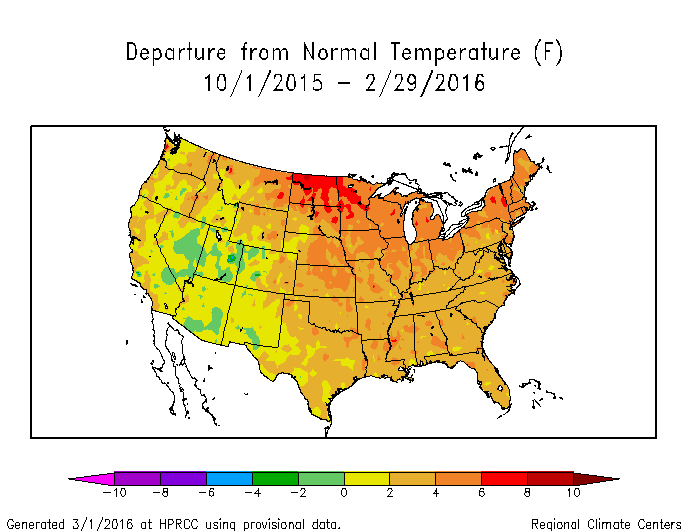
February was drier than normal across most of the West. With previous months having wetter-than-normal conditions in many parts of the region, the water year-to-date (October 1, 2015-February 29, 2016) showed a surplus of precipitation across much of the West. But the precipitation mostly missed some leeside Rocky Mountain locations, especially the Bighorn Mountain region of north central Wyoming. The winter-season storm systems have helped build up the mountain snowpack to near- to above-normal levels in many areas, which contributed to contraction of drought in the USDM analysis. The drier- and warmer-than-normal February conditions resulted in an expansion of drought in the PHDI analysis. But one wet season cannot make up for several years of moisture deficits, so drought continues in both the USDM and Palmer analyses. According to the USDM, 35.8 percent of the West was experiencing moderate to exceptional drought at the end of February, which is less than the previous month. The Palmer Drought Index percent area statistic for the West increased to 17.5 percent, which is more than double the previous month.
 |
 |
February 2016 was drier- and warmer-than-normal in the Primary Hard Red Winter Wheat agricultural belt, ranking as the 42nd driest and eighth warmest February in the 1895-2016 record, regionwide. October marks the beginning of the growing season. The region was generally wetter- and warmer-than-normal for the growing season-to-date, with October 2015-February 2016 ranking as the tenth wettest and third warmest October-February in the 1895-2016 record, regionwide.
NOAA Regional Climate Centers:
A more detailed drought discussion, provided by the NOAA Regional Climate Centers and others, can be found below.
West
As described by the High Plains Regional Climate Center, February was a very warm and quite windy month across much of the High Plains. Warm, dry, and windy conditions later in the month combined to elevate fire danger in many locations. Precipitation was variable across the region in February. Snowpack continued to suffer in northern Wyoming, which has been warm and dry since the fall. However, the wet pattern continued across northern Kansas and eastern Nebraska. In Wyoming, warm and dry conditions caused the snowpack to decline across much of the state throughout the month, and snowpack conditions were still the worst in the Bighorn Mountains in northern Wyoming. This region has been in drought since December and conditions intensified during February.
Degradations in drought conditions were more pronounced than improvements in the High Plains Region in February. By the end of the month, nearly 13 percent of Wyoming was in drought. Severe drought (D2) was introduced to an area in the Bighorn Mountains in northern Wyoming, and moderate drought (D1) developed in the Wind River Range in west-central Wyoming. Snowpack was still below normal in these areas, and the region also experienced a continuation of above normal temperatures that have been present since the fall. Dryness continued in North Dakota in February as well. Abnormally dry (D0) conditions expanded into northern and central North Dakota. Nearly 60 percent of the state was experiencing D0 or D1 conditions by the end of the month. The expansion of dryness was due to a lack of snow cover and above normal temperatures experienced in the region over the past couple of months. The area in D1 in southern North Dakota remained unchanged.
According to the 2015 Nebraska Statewide Groundwater-Level Monitoring Report, groundwater levels in Nebraska are finally beginning to recover from the intense drought that struck the central Plains in 2012-13. Above normal precipitation and more efficient water use practices were credited for the recovery. However, the state has not yet recovered enough to reach 2012 groundwater levels, which illustrates the long-term hydrologic impacts of a severe drought.
As explained by the Southern Regional Climate Center, February average temperatures in the Southern region were consistently above normal and precipitation totals varied across the region. The driest portions of the region included much of Oklahoma and western Texas, the extreme south of Texas, and northwestern Arkansas. Stations in these areas typically averaged less than half the normal precipitation, with many stations recording less than twenty-five percent of normal. February was a drier than normal month for Texas, Oklahoma, Arkansas and Louisiana. Though this is the second consecutive dry month, the Southern region remained drought-free as of February 23, with some small pockets of abnormally dry (D0) conditions.
As summarized by the Midwest Regional Climate Center, February temperatures were generally above normal and precipitation was mixed across the region. Dry conditions, with less than half of the normal precipitation for the month, extended through much of Missouri, eastern Iowa, central and northern Illinois, and southern Wisconsin. Areas with above normal precipitation, over 150 percent of normal included northwest Iowa, along the shores of the Great Lakes, and the eastern Ohio River valley and eastern Kentucky. Winter precipitation was above normal. The Midwest remained drought free for nine straight weeks. As of the March 1 USDM, less than 1 percent of the Midwest was classified as abnormally dry. Dryness in Missouri led to grassland fires in February. However, heavy rains in late December provided sufficient moisture to keep drought at bay throughout the winter.
As noted by the Southeast Regional Climate Center, precipitation ranged from slightly below normal to significantly above normal across the Southeast region during February, and temperatures ranged from slightly below average to slightly above average. Drought conditions (D1 and greater) were not observed across the Southeast region (excluding Puerto Rico). Extreme (D3) drought conditions were eliminated across southeastern Puerto Rico, and the extent of moderate-to-severe (D1 through D2) drought conditions across eastern and southern portions of Puerto Rico decreased 18 percent by the end of the month.
As explained by the Northeast Regional Climate Center, February brought mild temperatures and above-normal precipitation to the Northeast. At the start of the month, 25 percent of the Northeast was abnormally dry, with another 3 percent of the region experiencing moderate drought conditions. Above-normal precipitation during the month eased dryness. According to the USDM from February 25, 14 percent of the region was abnormally dry, with 2 percent of the region experiencing moderate drought conditions.
As summarized by the Western Regional Climate Center, in contrast with January's procession of storms, high pressure was present over the West during much of February. Persistent ridges yielded above normal temperatures and below normal precipitation for much of the region. In contrast with the anticipated strong El Niño wintertime precipitation pattern (dry in northwest, wet in southwest), southern California and Arizona were much drier than normal while western Washington, northern Idaho, and eastern Montana observed above normal precipitation this month.
Precipitation throughout California was below normal this month, raising concerns for water resources and drought amelioration. Shasta Dam, on California's largest reservoir, observed 2.99 in (76 mm) of precipitation, 26% of normal and its 15th driest February since records began in 1943. Southern California was very dry, where San Diego received a scant 0.05 in (1 mm), 2% of normal and the 3rd driest February since records began in 1933. Elsewhere in the Southwest, Phoenix observed no precipitation this month, as in six other years in its 84-year record. Normal precipitation there is 0.92 in (23 mm). Below normal precipitation was also observed in parts of the Intermountain West. Pocatello, Idaho, reported 0.2 in (5 mm), 21% of normal and the 4th driest since records began in 1939. Dry and warm conditions depleted snowpack in much of the West. Sierra Nevada snowpack fell from 116% to 83% of average during the month. A majority of basins in the Intermountain West reported near-normal snowpack, though percentages also fell there during the month. Basins in northern Wyoming continue to report below normal snowpack as in January. Expansion of drought conditions this month was limited to only small areas of Arizona, New Mexico, and Wyoming.
By contrast, western Washington, eastern Montana, and Colorado's Front Range observed slightly to well above normal precipitation. Seattle recorded 5.97 in (152 mm) of rainfall, 170% of normal and 10th wettest February since records began in 1945. Near normal Cascades snowpack in concert with a wet January helped to ease drought conditions in far northern California and southern Oregon. Parts of Colorado east of the Rockies were also moist; Colorado Springs had its 4th wettest February in a 69-year record at 1.0 in (25 mm), 294% of normal. Boulder observed 21.8 in (55 cm), the 12th snowiest since 1893. In southeastern Montana, Moorhead recorded 1.02 in (26 mm) precipitation, 408% of normal, the 3rd wettest February since records began in 1958.
Alaska was significantly warm for a second consecutive month. Barrow and Anchorage both observed their 4th warmest February on record at -4.1 F (-20 C) and 29.9 F (-1.2 C), respectively. The December-February period has been the warmest on record at Barrow and 2nd warmest at Anchorage. Dry conditions prevailed across Interior and Western Alaska, though some areas in the south were above normal. Kodiak's 12.88 in (327 mm) was 210% of normal and 2nd wettest February since records began in 1931. In Hawaii, dry conditions persisted this month, typical of an El Niño winter. Honolulu observed 0.40 in (10 mm) of rainfall, 20% of normal and the 6th driest in a 77-year record. The last 3 months have been the driest December-February period on record for Honolulu.
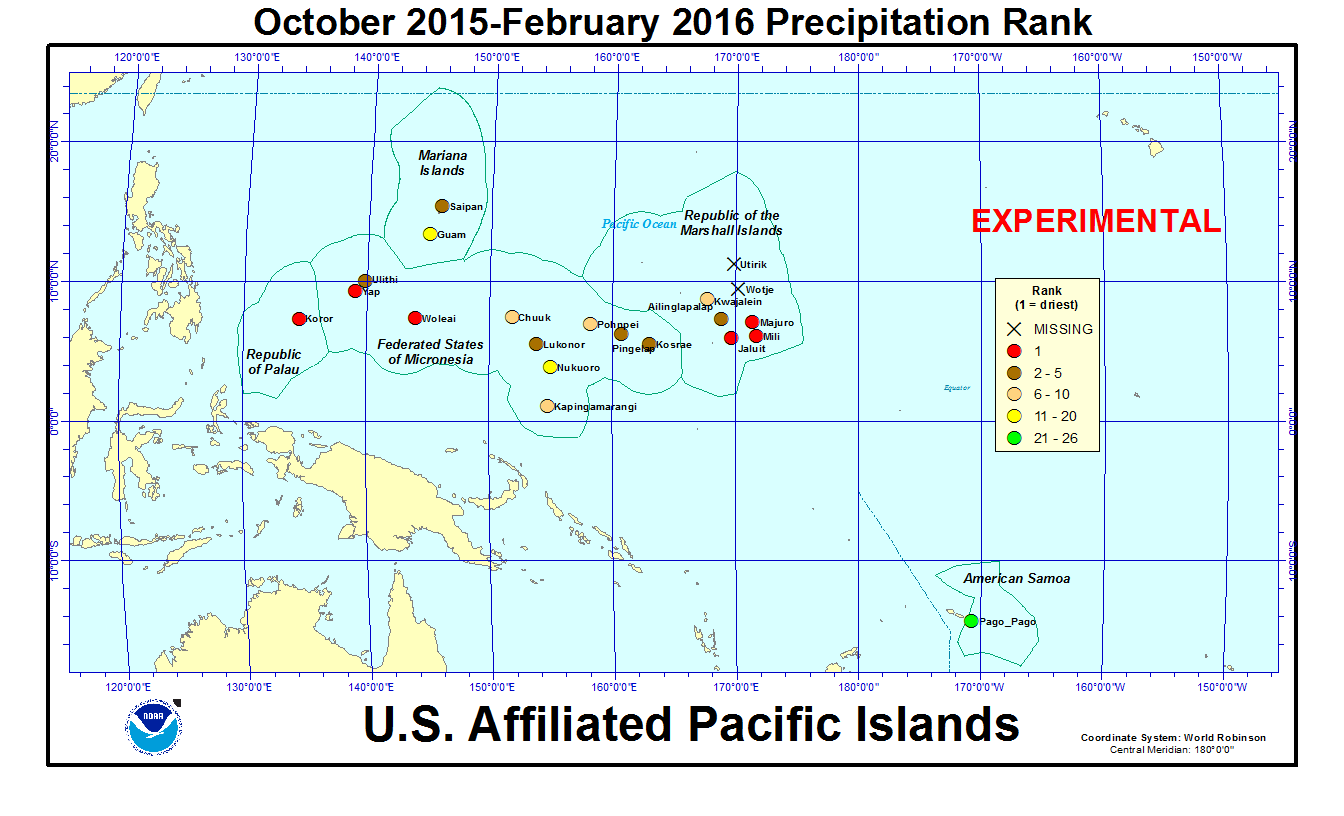
Pacific Islands: According to reports from National Weather Service offices, the Pacific ENSO Applications Climate Center (PEAC), and partners, conditions varied across the Pacific Islands.
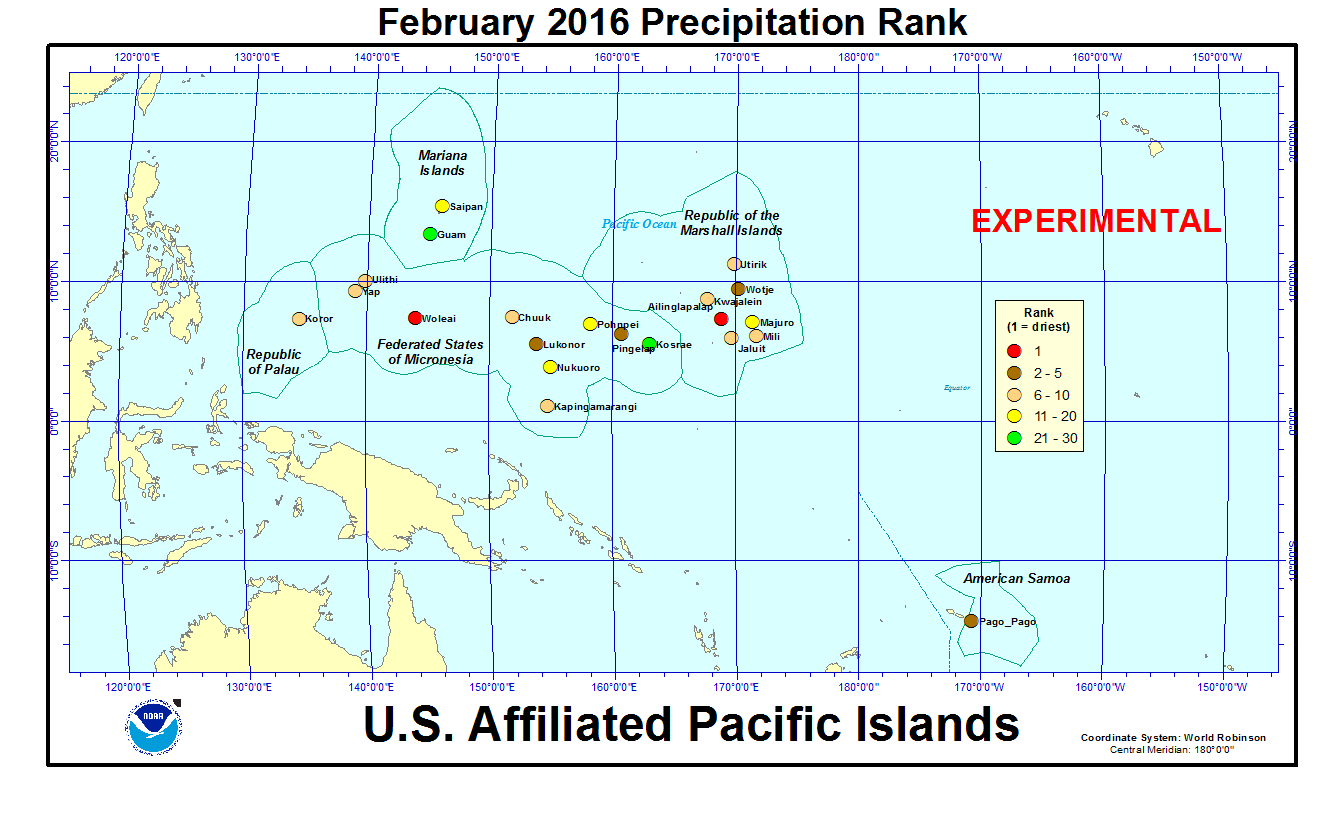
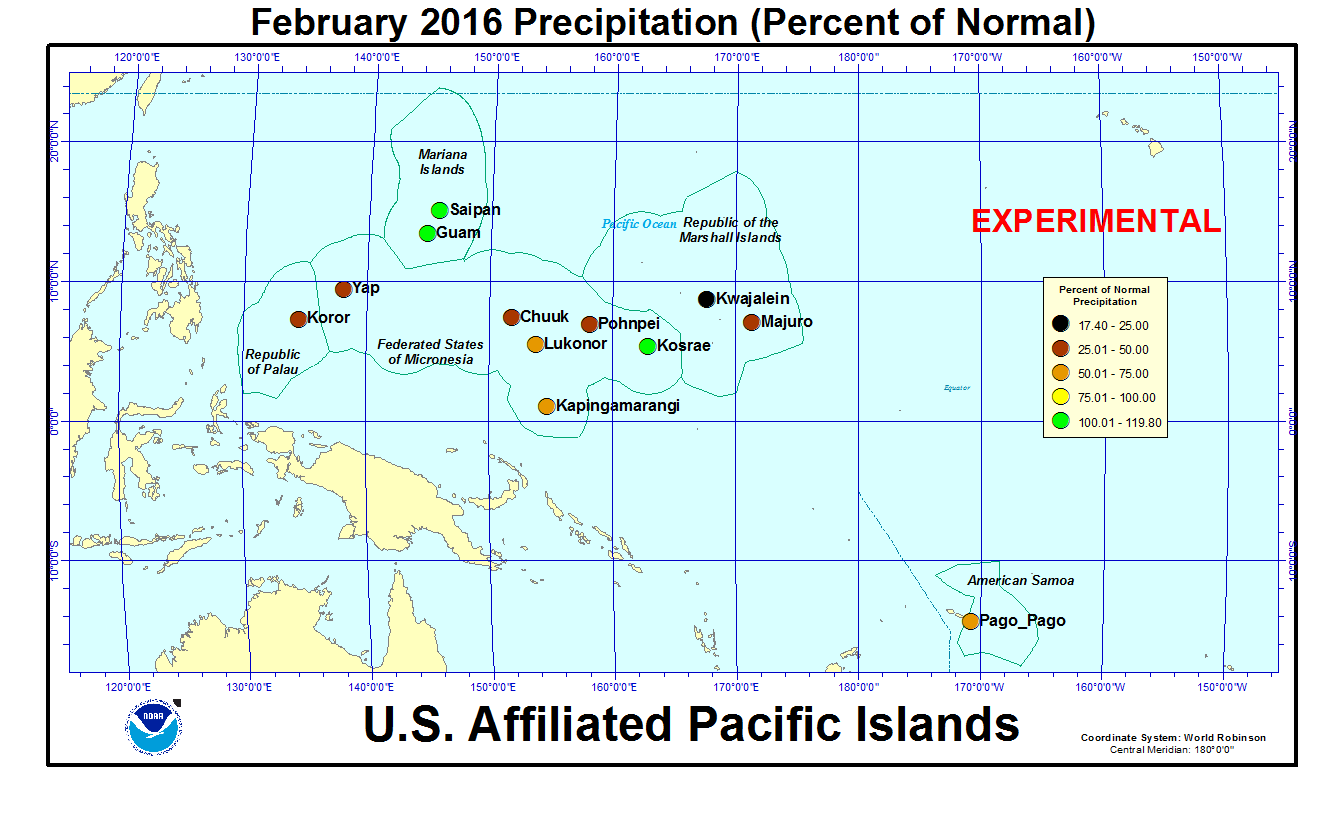
In the U.S. Affiliated Pacific Islands (maps — Federated States of Micronesia, Northern Mariana Islands, Marshall Islands, Republic of Palau, American Samoa, basinwide), February 2016 was wetter than normal at only Guam, Saipan, and Kosrae, and drier than normal at the rest of the primary stations.
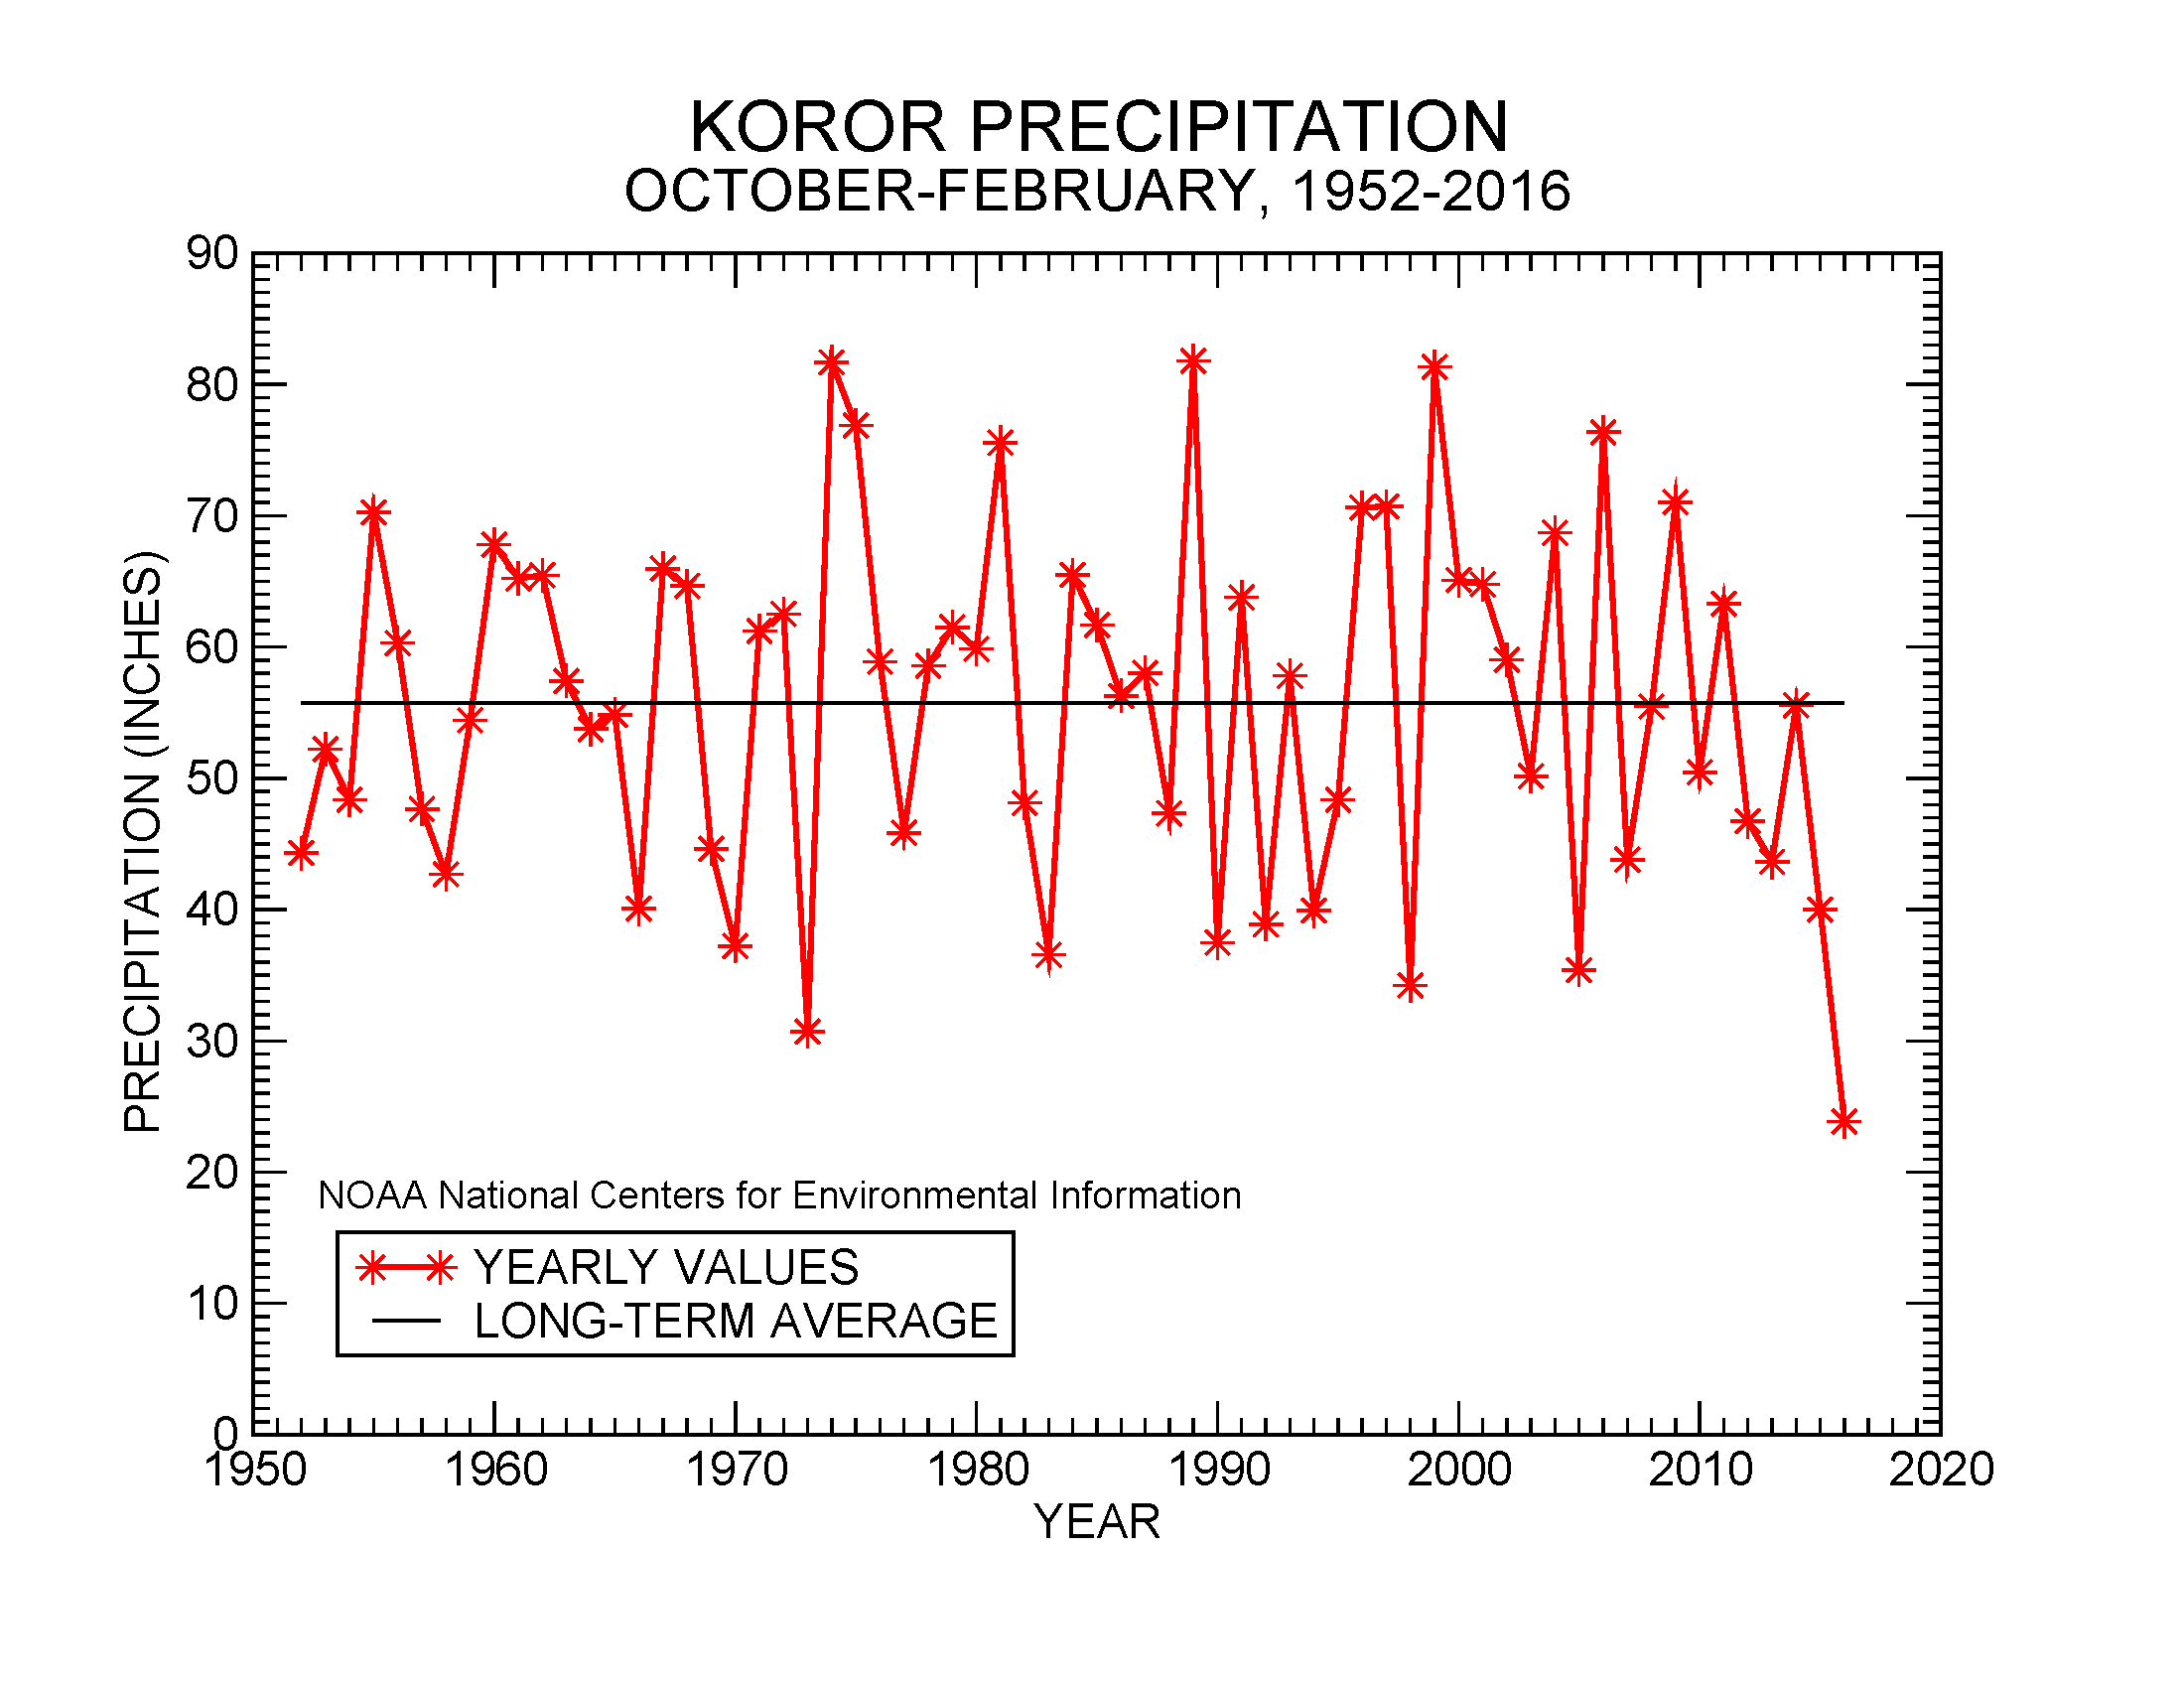
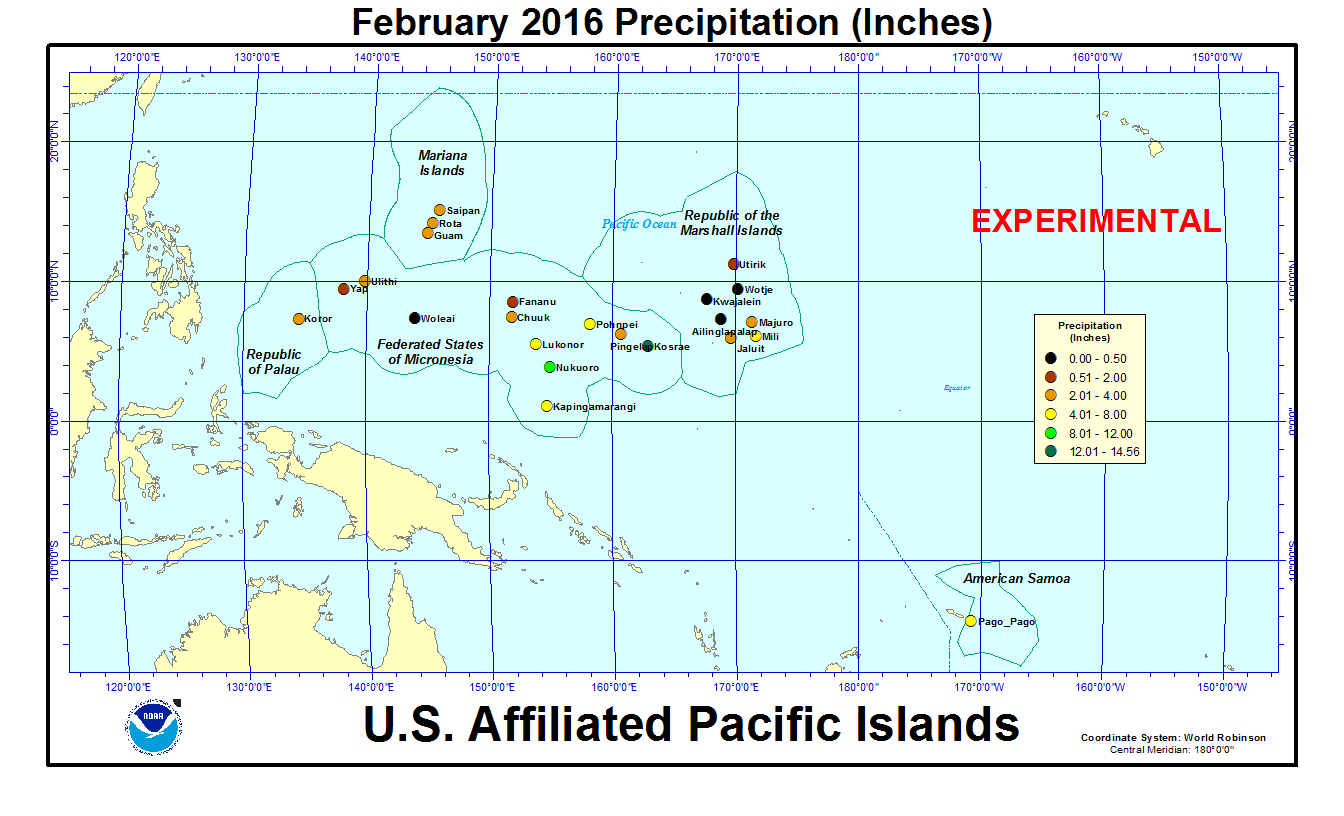
Rainfall amounts were below the minimum thresholds (4 or 8 inches) required to meet most monthly water needs at stations across the region. These included Guam, Rota, and Saipan in the Mariana Islands; Koror in the Republic of Palau; Chuuk, Dugor, Fananu, Gilman, Lukonor, Luweech, Maap, North Fanif, Pingelap, Pohnpei, Rumung, Tamil, Ulithi, Woleai, and Yap in the Federated States of Micronesia (FSM); Ailinglapalap, Kwajalein, Majuro, Jaluit, Mili, Utirik, and Wotje in the Republic of the Marshall Islands; and Pago Pago in American Samoa. Only stations in the southeastern FSM states of Pohnpei and Kosrae — including Kapingamarangi, Kosrae, and Nukuoro — had more than the monthly minimum threshold. Koror had 2.53 inches of rain in February, with 11 of the last 14 months drier than 8 inches. In the FSM, Yap reported 1.77 inches of rain in February, with the last five months very dry. The stations on the islands around Yap have also been much drier than 8 inches for each of the last four months. Gilman and Ulithi have reported less than 8 inches for the last six months, and Woleai for the last seven months. Woleai measured only 0.22 inch of rain for February. In the Marshall Islands, Ailinglapalap has had less than 8 inches of precipitation for 10 of the last 14 months, Jaluit for 11 of the last 13 months, and Mili for 11 of the last 16 months. Wotje received 0.05 inch of rain in February, Ailinglapalap 0.33 inch, Kwajalein 0.46 inch, and Utirik 0.94 inch. The 4- and 8-inch thresholds are important because, if monthly precipitation falls below the threshold, then drought becomes a concern. Below-normal rainfall is expected to continue for many of these stations as the strong El Niño persists.
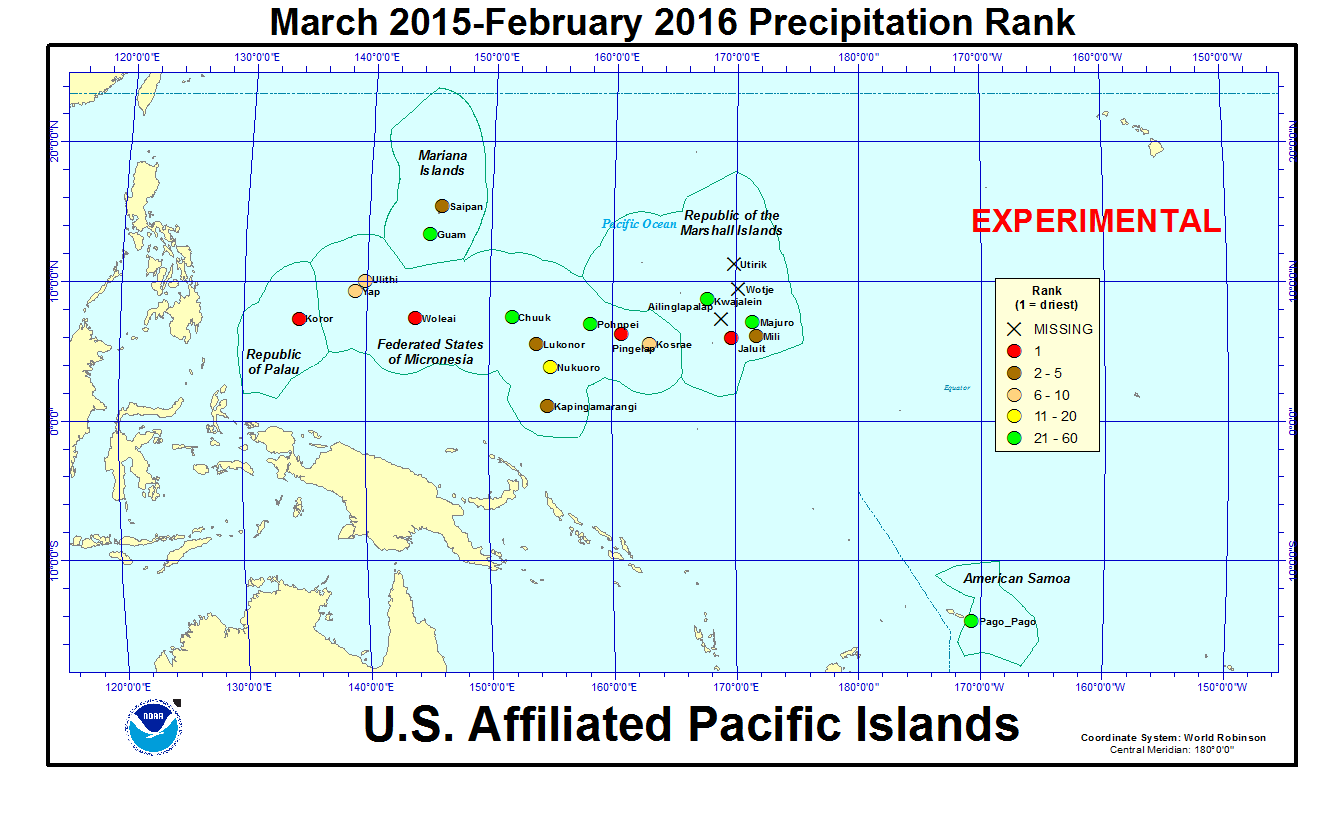
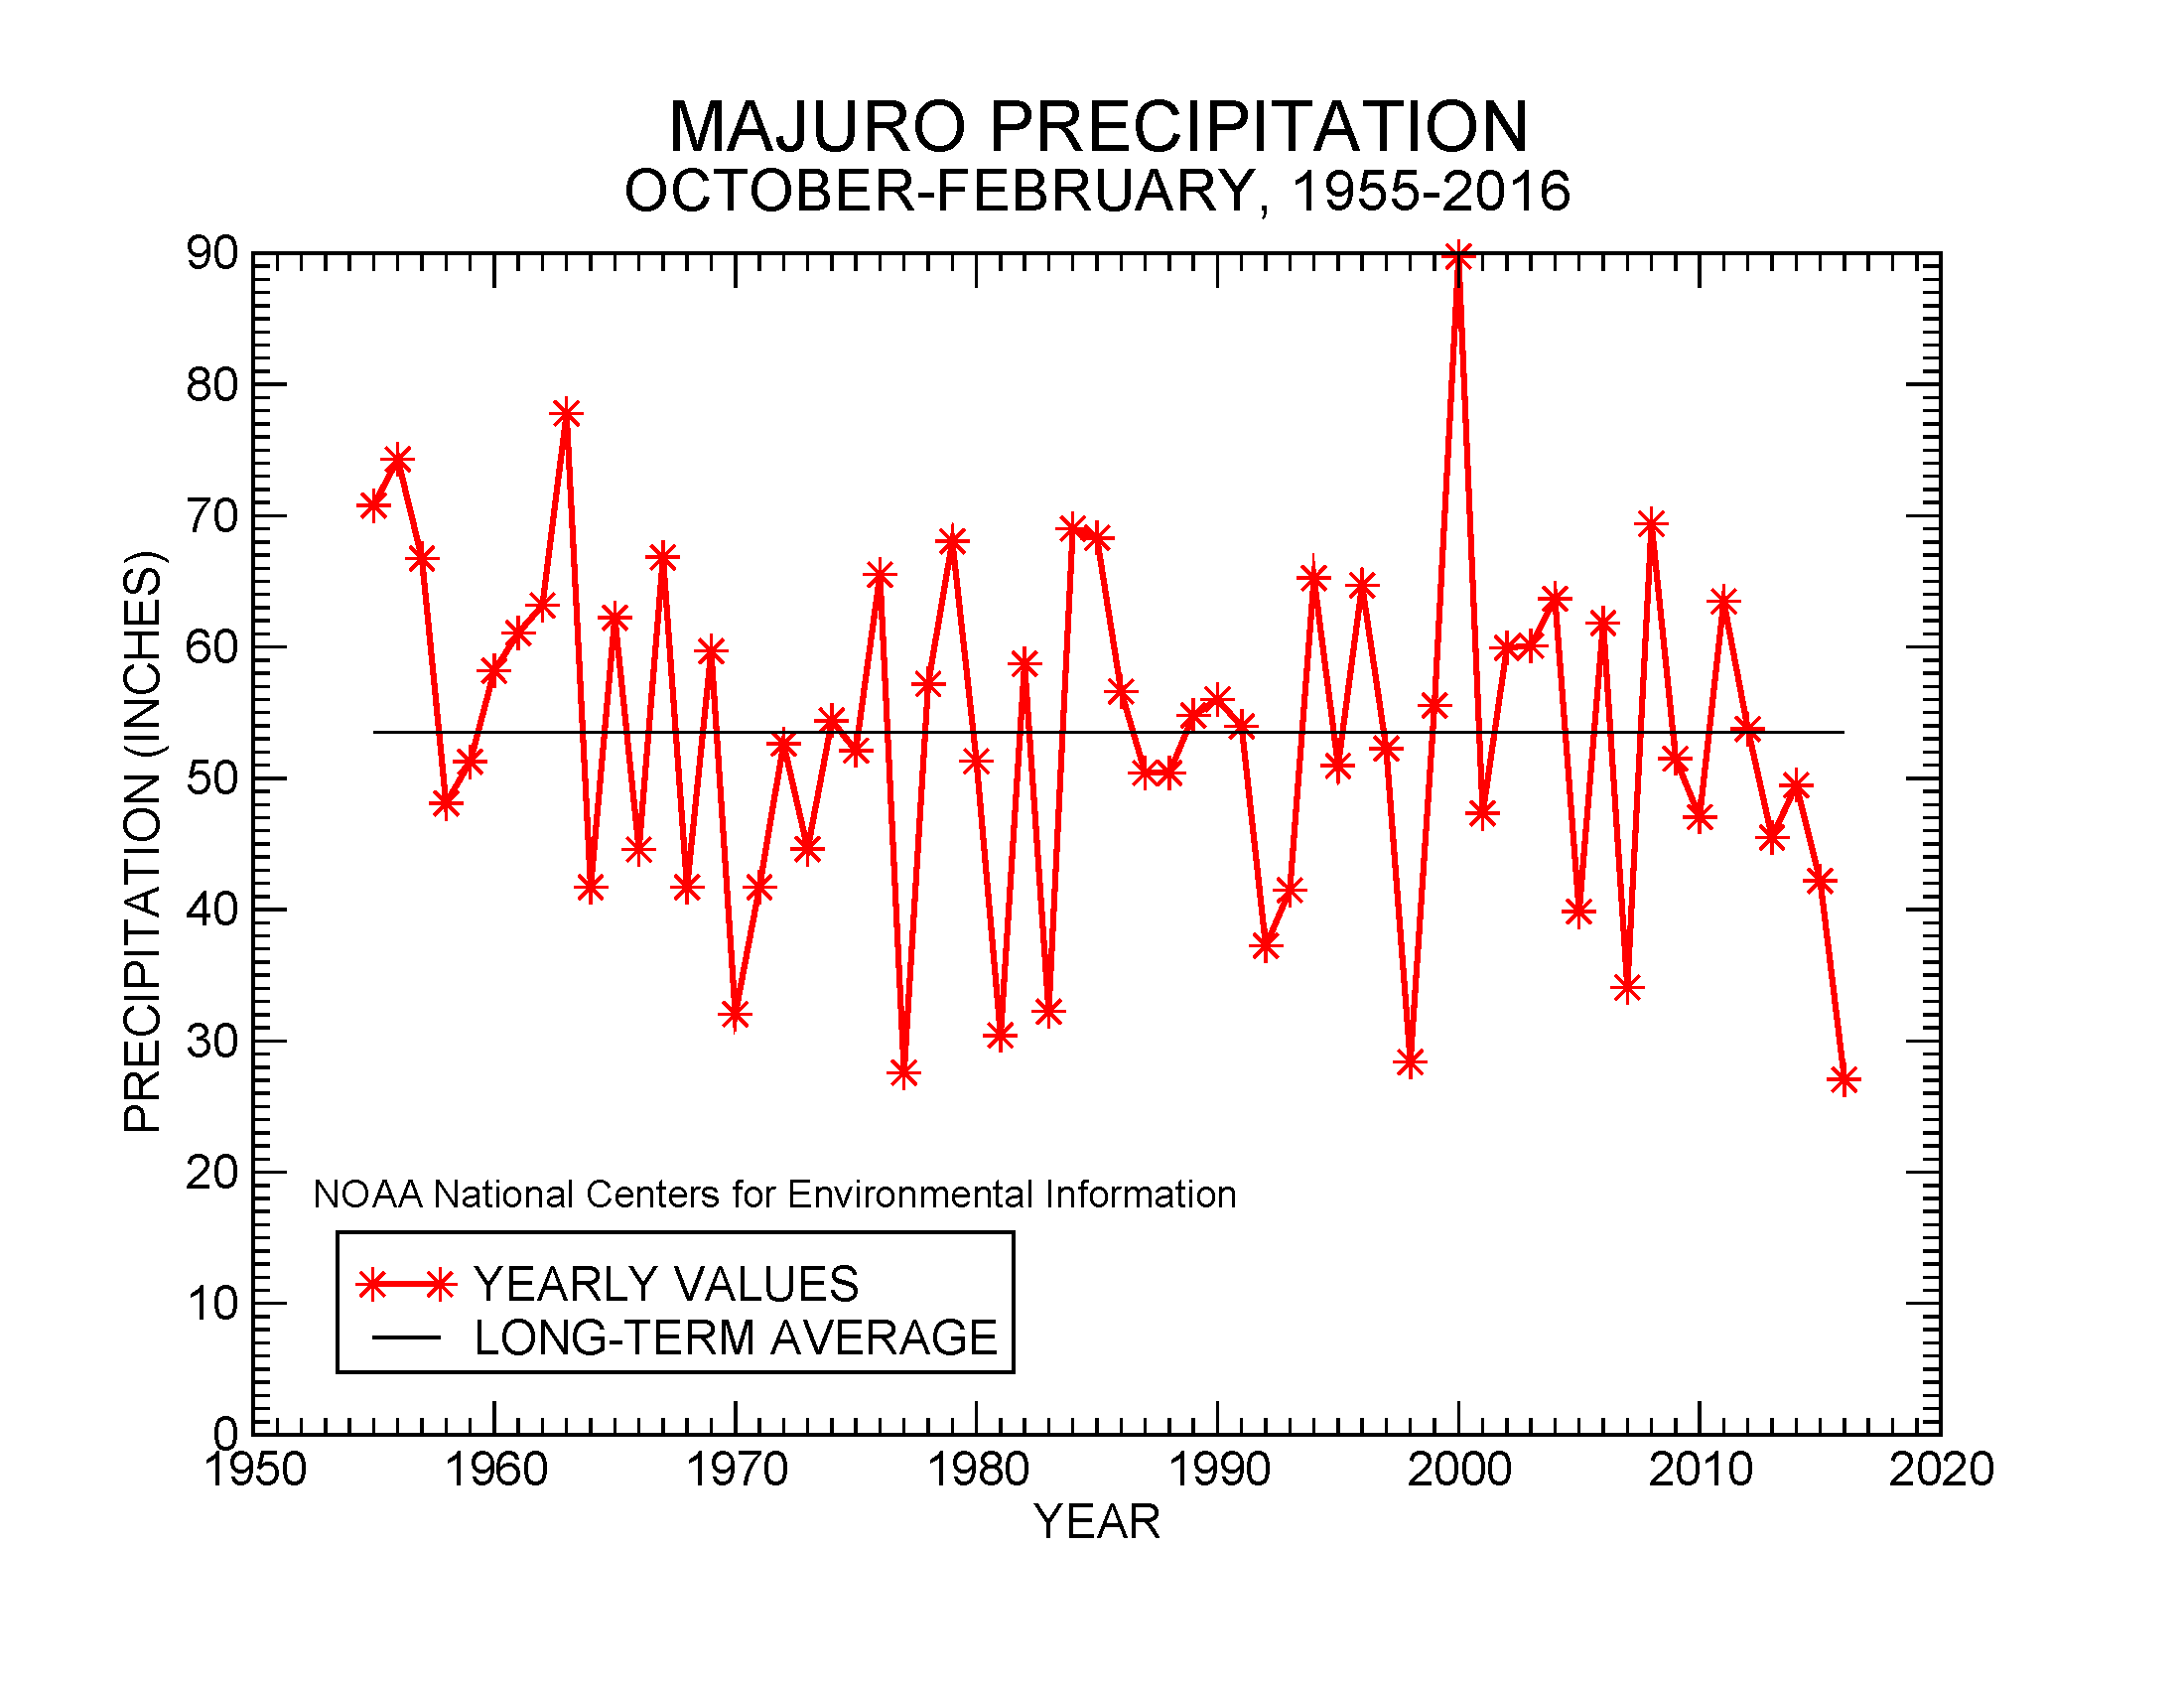
An analysis of historical data for the USAPI stations in the Global Historical Climatology Network-Daily (GHCN-D) dataset indicated that several stations had record or near-record dryness during February and the last five months. Some stations have a long period of record and their dataset is fairly complete, while other stations have a shorter period of record and the dataset has some missing data. The last five months have been the driest October-February on record for Koror and Yap out of 65 years of data, and driest for Majuro out of 62 years of data. Koror has also had the driest March-February (last 12 months) out of 64 years of data. Woleai had the driest February (out of 32 years of data), driest October-February (out of 29 years of data), and driest March-February (out of 20 years of data). Jaluit and Mili had the driest October-February on record, and Jaluit and Pingelap had the driest March-February, but they had fewer years of data (about a dozen or less years in the data base).
Rank of 1 = driest.
| Station | February 2016 Rank |
February No. of Years |
October 2015- February 2016 Rank |
October- February No. of Years |
March 2015- February 2016 Rank |
March- February No. of Years |
Period of Record |
| Woleai | 1 | 32 | 1 | 29 | 1 | 20 | 1968-2016 |
| Koror | 6 | 65 | 1 | 65 | 1 | 64 | 1951-2016 |
| Jaluit | 7 | 21 | 1 | 13 | 1 | 8 | 1985-2016 |
| Mili | 8 | 17 | 1 | 10 | 2 | 7 | 1985-2016 |
| Yap | 10 | 65 | 1 | 65 | 7 | 64 | 1951-2016 |
| Majuro | 12 | 62 | 1 | 62 | 33 | 61 | 1954-2016 |
| Pingelap | 4 | 28 | 2 | 21 | 1 | 13 | 1985-2016 |
| Ailinglapalap | 1 | 20 | 2 | 14 | N/A | 8 | 1985-2016 |
| Ulithi | 9 | 24 | 3 | 22 | 8 | 15 | 1989-2016 |
| Saipan | 16 | 28 | 4 | 25 | 3 | 23 | 1988-2016 |
| Kosrae | 26 | 48 | 4 | 33 | 8 | 27 | 1954-2016 |
| Lukonor | 5 | 20 | 5 | 18 | 4 | 11 | 1986-2016 |
| Kapingamarangi | 10 | 29 | 6 | 18 | 4 | 11 | 1962-2016 |
| Chuuk | 9 | 65 | 7 | 65 | 30 | 64 | 1951-2016 |
| Kwajalein | 7 | 64 | 7 | 63 | 59 | 62 | 1952-2016 |
| Pohnpei | 11 | 65 | 8 | 65 | 60 | 64 | 1951-2016 |
| Nukuoro | 13 | 28 | 13 | 23 | 15 | 19 | 1985-2016 |
| Guam | 30 | 59 | 16 | 59 | 47 | 59 | 1957-2016 |
| Pago Pago | 5 | 50 | 26 | 50 | 25 | 49 | 1966-2016 |
| Wotje | 3 | 20 | N/A | 12 | N/A | 8 | 1985-2016 |
| Utirik | 9 | 16 | N/A | 8 | N/A | 2 | 1968-2016 |
|
 |
 |
In early February the government of the Republic of the Marshall Islands declared a State of Emergency due to drought, and in mid-February the government of the Federated States of Micronesia declared a State of Emergency due to drought. In early March, the NOAA National Weather Service office in Guam updated the Drought Information Statement for the Republic of Palau, the Mariana Islands, the Marshall Islands, and parts of the FSM. The Drought Information Statement noted the very dry conditions of the last five months and urged close monitoring of water supplies, implementation of water conservation measures, and concern for grass fires and impacts on crops and other vegetation.
The government of the Republic of the Marshall Islands has received reports from communities outside the urban centers being severely impacted by the dry weather conditions, and warns of potential health, environmental, social, and economic hardship due to persistent dry weather. Impacts have included: household water catchments and other water storage facilities have run out or are extremely low on water; the levels of salinity of water drawn from underground wells have risen to unsafe levels; the communities in the urban centers of Ebeye and Majuro have implemented water management plans; reverse osmosis units are needed in several communities; early impacts on local trees and crops have been observed, including local food staples such as breadfruit are falling prematurely and coconut, pandanus, and banana tree leaves are turning brown; and cases of drought-related diarrhea and conjunctivitis have been reported.
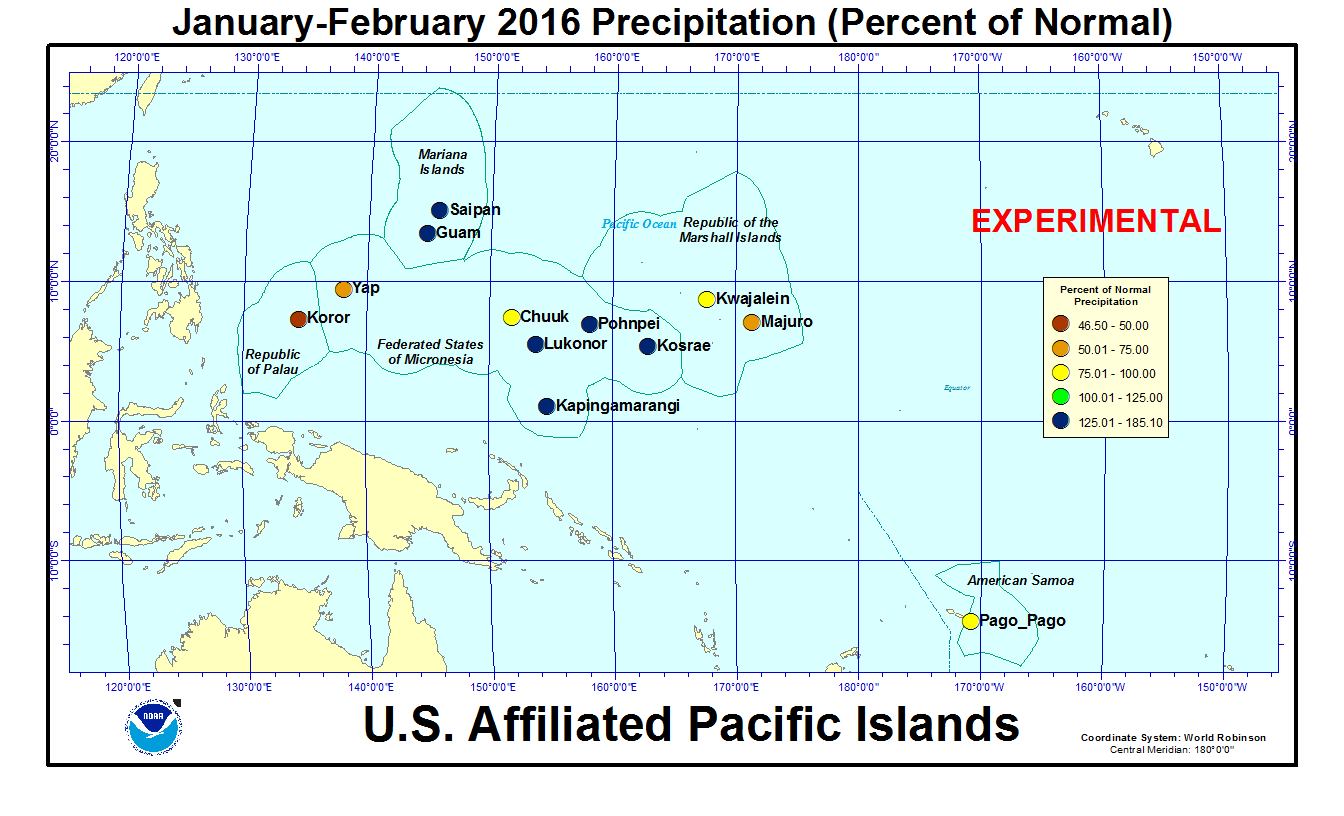
As measured by percent of normal precipitation, Koror, Pago Pago, and Yap have been drier than normal in the short term (February, the year-to-date [January-February], and the last 3 months [December 2015-February 2016]) as well as the long term (last 12 months [March 2015-February 2016]). Saipan was near to above normal at all four time scales. Guam was below normal at the 3-month time scale but wetter than normal at the other three time scales. Chuuk, Kwajalein, and Majuro were drier than normal in the short term but near to wetter than normal in the long-term. Kapingamarangi and Lukonor were wetter than normal for the year to date but drier than normal at the other three time scales. Kosrae was wetter than normal at the 1- and 2-month time scales but drier than normal at the 3- and 12-month time scales. Pohnpei was wetter than normal at the 2- and 12-month time scales but drier than normal at the 1- and 3-month time scales.
| Station Name | Mar 2015 | Apr 2015 | May 2015 | Jun 2015 | Jul 2015 | Aug 2015 | Sep 2015 | Oct 2015 | Nov 2015 | Dec 2015 | Jan 2016 | Feb 2016 | Mar- Feb |
|---|---|---|---|---|---|---|---|---|---|---|---|---|---|
| Chuuk | 209% | 104% | 89% | 172% | 54% | 155% | 188% | 53% | 70% | 82% | 63% | 29% | 103% |
| Guam NAS | 198% | 263% | 291% | 86% | 215% | 146% | 108% | 125% | 81% | 74% | 65% | 120% | 114% |
| Kapingamarangi | 62% | 87% | 173% | 161% | 54% | 162% | 112% | 63% | 89% | 134% | 103% | 65% | 93% |
| Koror | 69% | 74% | 33% | 107% | 27% | 73% | 143% | 53% | 69% | 41% | 26% | 30% | 58% |
| Kosrae | 91% | 92% | 84% | 143% | 108% | 138% | 115% | 63% | 33% | 95% | 60% | 113% | 80% |
| Kwajalein | 994% | 322% | 204% | 117% | 104% | 171% | 95% | 105% | 88% | 59% | 64% | 17% | 141% |
| Lukonor | 99% | 83% | 89% | 136% | 77% | 75% | 149% | 40% | 123% | 56% | 123% | 61% | 80% |
| Majuro | 329% | 162% | 171% | 57% | 87% | 207% | 96% | 83% | 40% | 61% | 14% | 46% | 106% |
| Pago Pago | 64% | 153% | 172% | 170% | 72% | 125% | 18% | 88% | 210% | 183% | 34% | 54% | 98% |
| Pohnpei | 138% | 119% | 219% | 108% | 138% | 199% | 124% | 78% | 67% | 71% | 102% | 49% | 119% |
| Saipan | 315% | 203% | 341% | 115% | 112% | 141% | 92% | 198% | 64% | 154% | 54% | 105% | 137% |
| Yap | 93% | 139% | 235% | 92% | 82% | 148% | 68% | 43% | 37% | 58% | 35% | 34% | 85% |
| Station Name | Mar 2015 | Apr 2015 | May 2015 | Jun 2015 | Jul 2015 | Aug 2015 | Sep 2015 | Oct 2015 | Nov 2015 | Dec 2015 | Jan 2016 | Feb 2016 | Mar- Feb |
|---|---|---|---|---|---|---|---|---|---|---|---|---|---|
| Chuuk | 17.37" | 13.03" | 10.08" | 20.03" | 6.45" | 19.91" | 22.07" | 6.09" | 7.46" | 9.25" | 6.40" | 2.09" | 140.23" |
| Guam NAS | 4.09" | 6.65" | 9.91" | 5.32" | 21.80" | 21.54" | 13.71" | 14.26" | 5.96" | 3.77" | 2.62" | 3.63" | 113.26" |
| Kapingamarangi | 7.05" | 11.82" | 20.84" | 22.14" | 7.71" | 13.14" | 11.08" | 5.13" | 8.28" | 13.20" | 9.40" | 6.04" | 135.83" |
| Koror | 5.11" | 5.42" | 3.96" | 18.66" | 4.98" | 9.90" | 16.88" | 6.24" | 7.86" | 4.59" | 2.64" | 2.53" | 88.77" |
| Kosrae | 14.57" | 16.12" | 14.89" | 20.90" | 16.17" | 19.69" | 16.36" | 6.90" | 4.55" | 15.37" | 9.95" | 14.56" | 170.03" |
| Kwajalein | 23.37" | 16.94" | 13.69" | 8.12" | 10.28" | 16.63" | 10.24" | 11.71" | 9.98" | 3.90" | 2.02" | 0.46" | 127.34" |
| Lukonor | 9.16" | 9.36" | 10.36" | 15.83" | 12.22" | 10.55" | 15.15" | 4.53" | 11.18" | 6.35" | 10.37" | 5.44" | 120.5" |
| Majuro | 21.65" | 15.23" | 17.27" | 6.31" | 9.72" | 24.24" | 10.72" | 10.52" | 5.33" | 6.93" | 1.11" | 3.17" | 132.2" |
| Pago Pago | 6.88" | 14.35" | 16.59" | 9.07" | 3.99" | 6.75" | 1.20" | 8.15" | 21.33" | 23.53" | 4.49" | 6.49" | 122.82" |
| Pohnpei | 18.14" | 21.94" | 43.68" | 16.03" | 21.31" | 28.33" | 15.59" | 11.86" | 9.95" | 11.41" | 13.49" | 4.64" | 216.37" |
| Saipan | 5.95" | 5.34" | 8.11" | 4.15" | 10.00" | 18.51" | 9.26" | 21.00" | 3.61" | 5.94" | 1.36" | 2.72" | 95.95" |
| Yap | 4.22" | 7.80" | 18.41" | 11.07" | 12.39" | 21.99" | 9.21" | 5.29" | 3.31" | 4.93" | 2.23" | 1.77" | 102.62" |
| Station Name | Mar 2015 | Apr 2015 | May 2015 | Jun 2015 | Jul 2015 | Aug 2015 | Sep 2015 | Oct 2015 | Nov 2015 | Dec 2015 | Jan 2016 | Feb 2016 | Mar- Feb |
|---|---|---|---|---|---|---|---|---|---|---|---|---|---|
| Chuuk | 8.32" | 12.47" | 11.30" | 11.66" | 11.98" | 12.86" | 11.71" | 11.51" | 10.61" | 11.25" | 10.10" | 7.25" | 136.77" |
| Guam NAS | 2.07" | 2.53" | 3.40" | 6.18" | 10.14" | 14.74" | 12.66" | 11.44" | 7.38" | 5.11" | 4.01" | 3.03" | 99.09" |
| Kapingamarangi | 11.43" | 13.64" | 12.08" | 13.78" | 14.15" | 8.13" | 9.93" | 8.19" | 9.27" | 9.84" | 9.15" | 9.27" | 145.85" |
| Koror | 7.44" | 7.32" | 11.83" | 17.48" | 18.53" | 13.50" | 11.77" | 11.84" | 11.39" | 11.16" | 10.18" | 8.56" | 152.90" |
| Kosrae | 16.06" | 17.51" | 17.75" | 14.64" | 14.91" | 14.22" | 14.22" | 10.94" | 13.83" | 16.11" | 16.67" | 12.93" | 213.87" |
| Kwajalein | 2.35" | 5.26" | 6.72" | 6.93" | 9.87" | 9.74" | 10.74" | 11.18" | 11.28" | 6.66" | 3.16" | 2.64" | 90.41" |
| Lukonor | 9.26" | 11.31" | 11.69" | 11.65" | 15.93" | 14.04" | 10.15" | 11.32" | 9.08" | 11.27" | 8.41" | 8.93" | 151.36" |
| Majuro | 6.58" | 9.42" | 10.11" | 11.01" | 11.17" | 11.69" | 11.17" | 12.73" | 13.44" | 11.39" | 7.74" | 6.88" | 125.25" |
| Pago Pago | 10.68" | 9.39" | 9.66" | 5.33" | 5.55" | 5.38" | 6.53" | 9.26" | 10.14" | 12.84" | 13.34" | 12.00" | 125.57" |
| Pohnpei | 13.17" | 18.41" | 19.96" | 14.81" | 15.43" | 14.26" | 12.55" | 15.27" | 14.83" | 16.08" | 13.18" | 9.55" | 182.36" |
| Saipan | 1.89" | 2.63" | 2.38" | 3.62" | 8.91" | 13.13" | 10.09" | 10.62" | 5.61" | 3.85" | 2.53" | 2.59" | 70.25" |
| Yap | 4.56" | 5.63" | 7.85" | 12.04" | 15.08" | 14.82" | 13.50" | 12.18" | 8.83" | 8.51" | 6.39" | 5.19" | 120.31" |


[top]
State/Regional/National Moisture Status
A detailed review of drought and moisture conditions is available for all contiguous U.S. states, the nine standard regions, and the nation (contiguous U.S.):
| northeast u. s. | east north central u. s. | central u. s. |
| southeast u. s. | west north central u. s. | south u. s. |
| southwest u. s. | northwest u. s. | west u. s. |
| Contiguous United States |
[top]
Contacts & Questions