|
Contents Of This Report: |


|
Please note that the values presented in this report are based on preliminary data. They will change when the final data are processed, but will not be replaced on these pages.
National Drought Overview
|
|
[top]
Detailed Drought Discussion
Overview
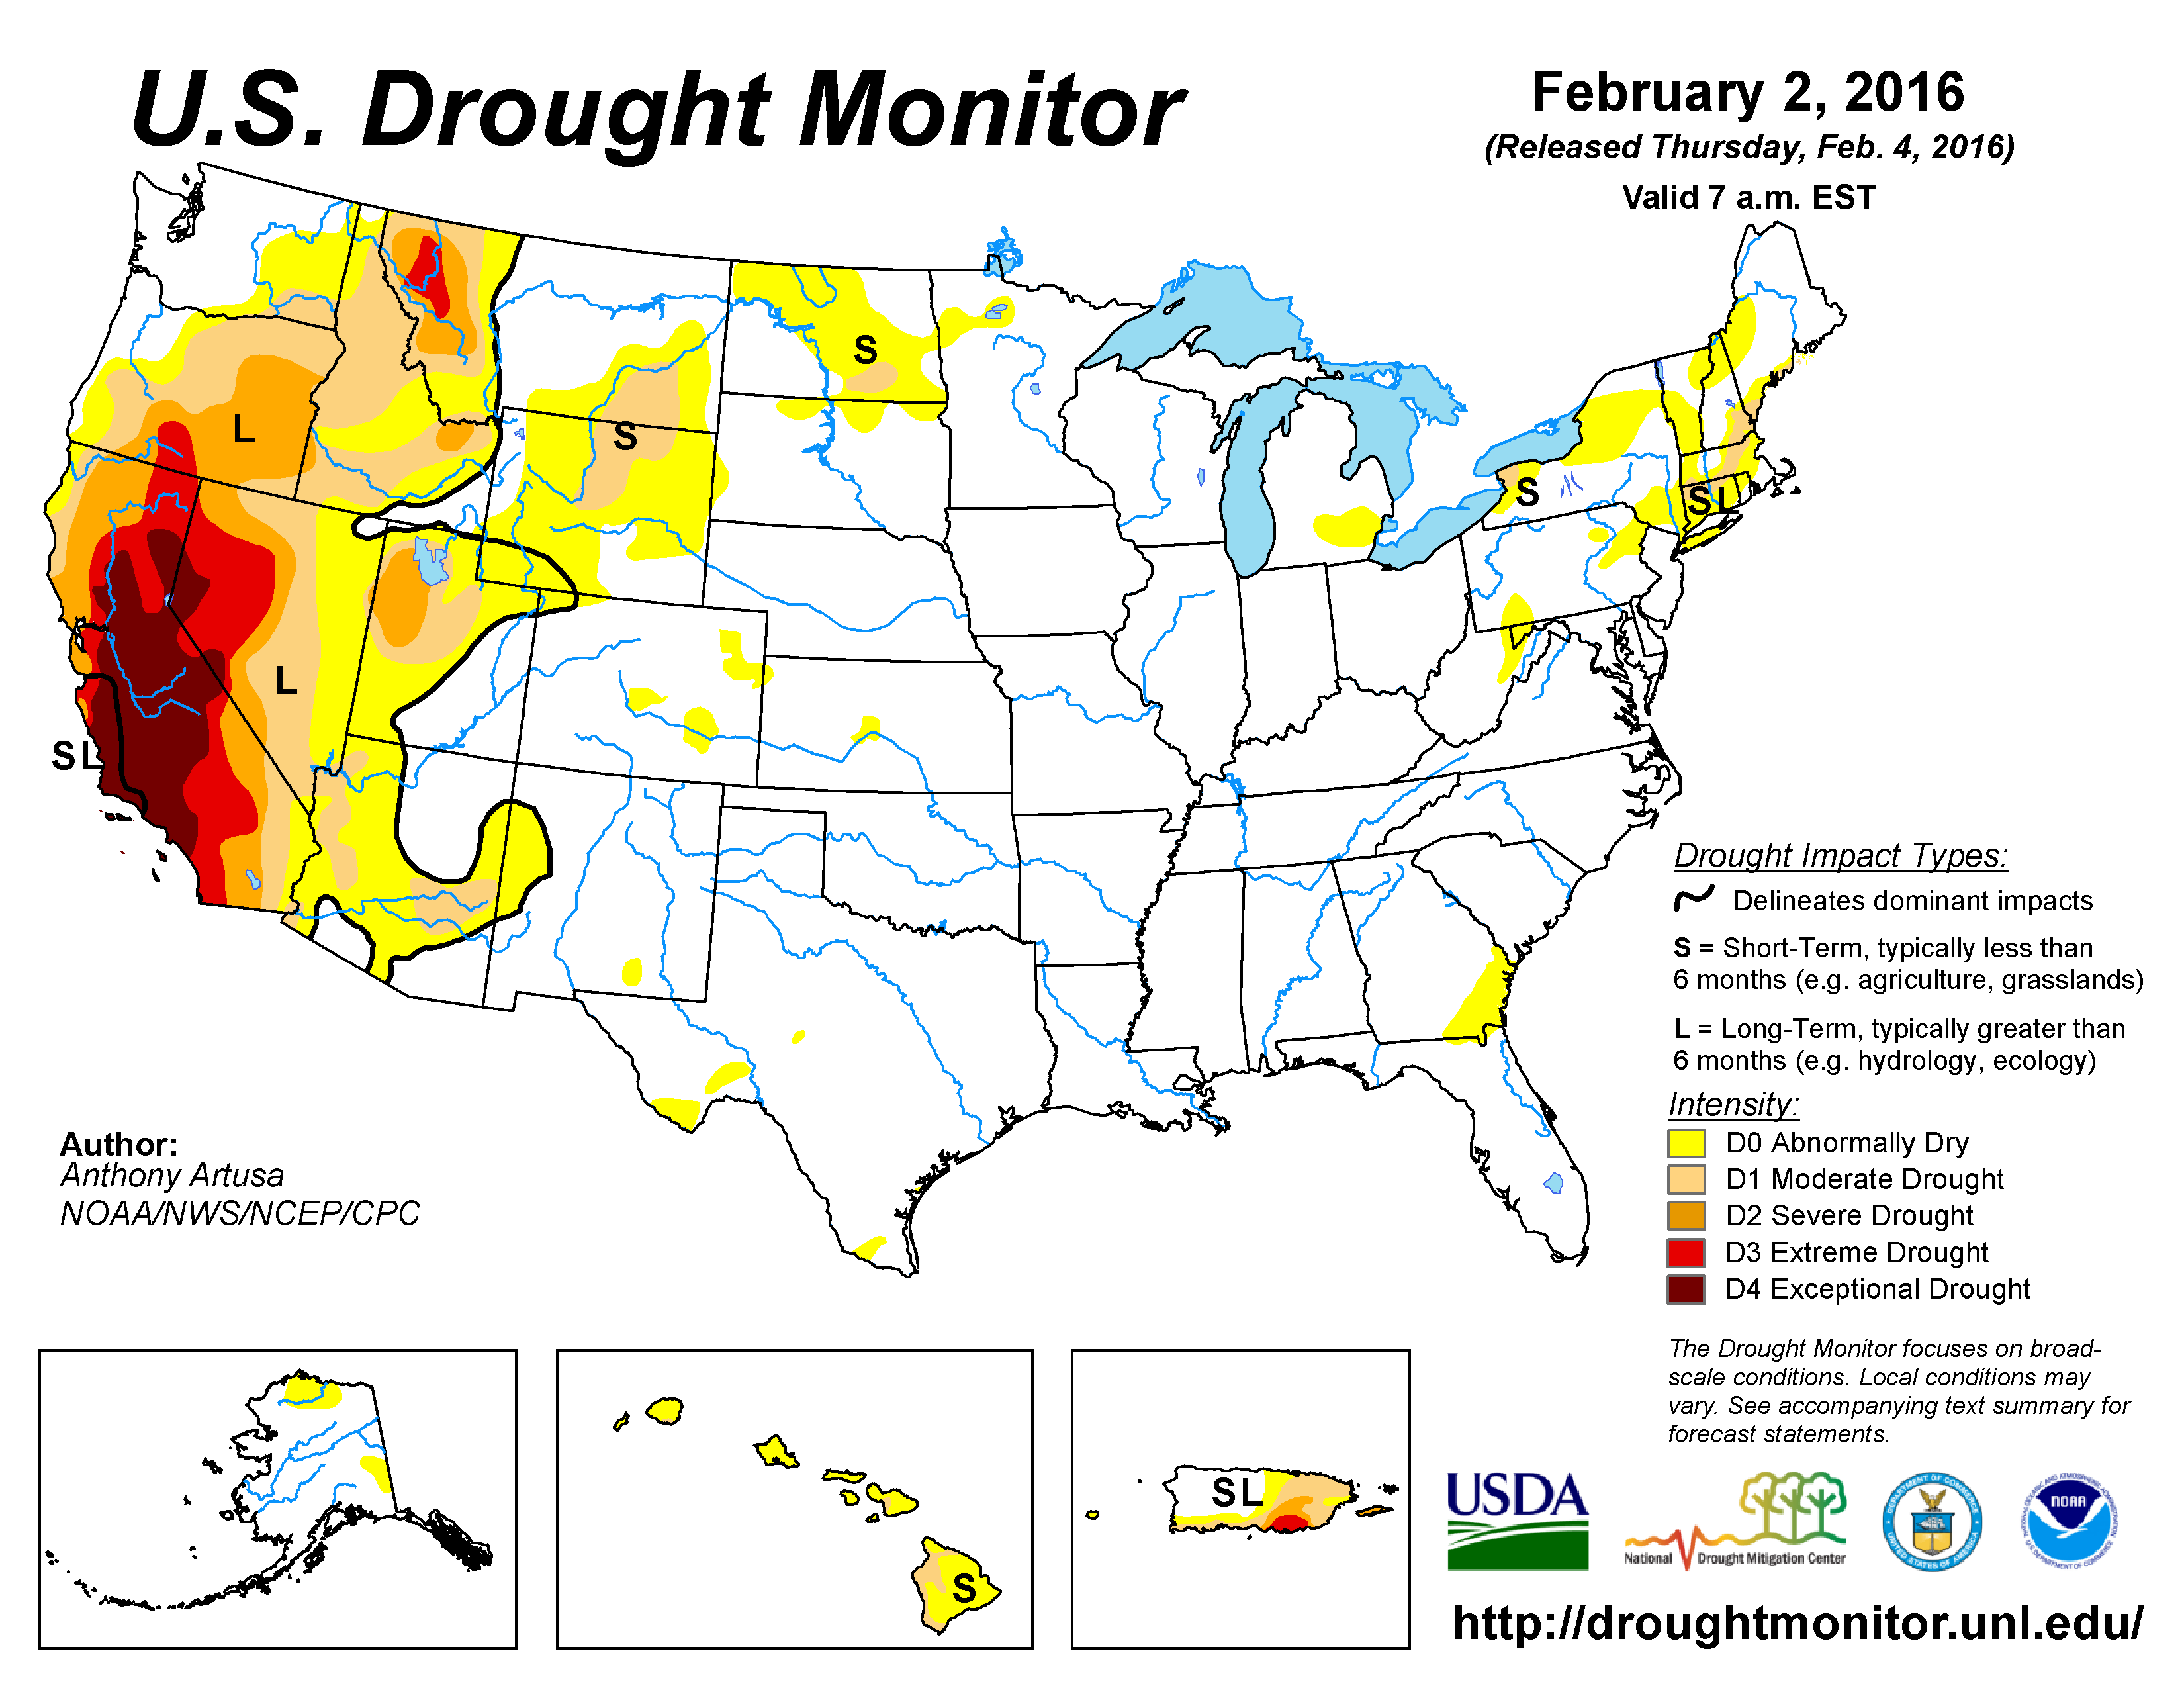
The U.S. Drought Monitor drought map valid February 2, 2016.
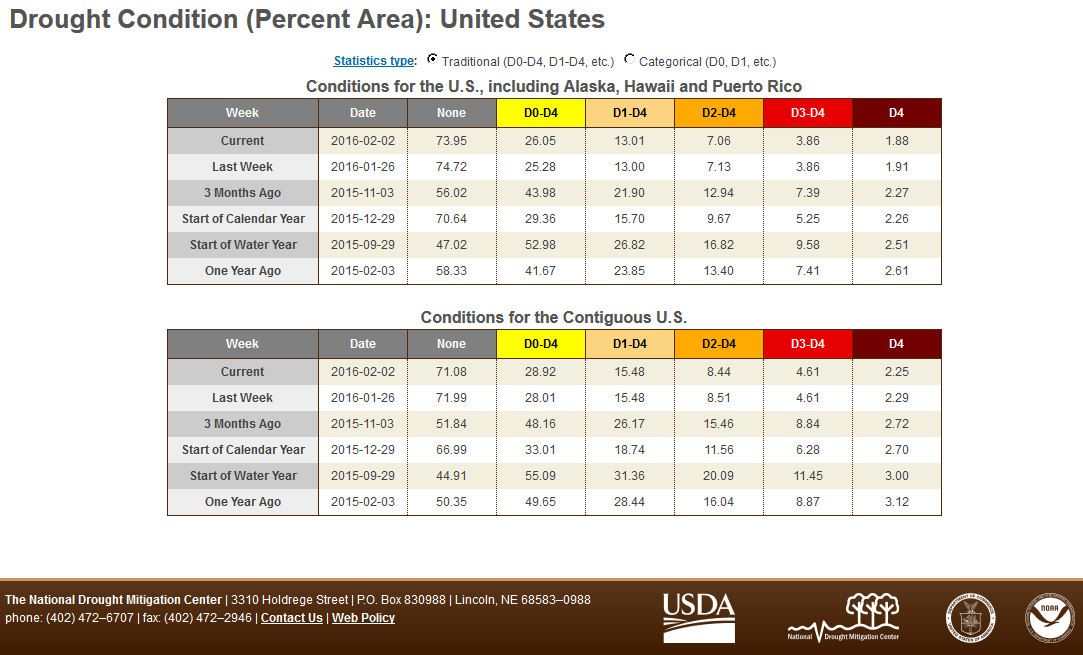
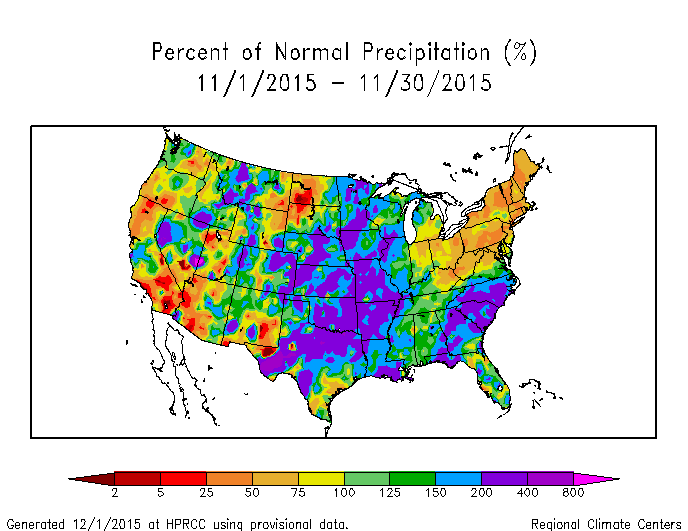
During January 2016, a strong El Niño continued to pump moisture and energy from the tropical Pacific Ocean into the atmosphere, invigorating the upper-level circulation in the mid-latitudes. Numerous weather systems in the jet stream flow brought above-normal precipitation and beneficial mountain snowfall to much of the West, improving drought conditions. While beneficial, the precipitation so far this wet season has not been enough to make up for the deficits accumulated over the last four years and end the drought. By the time the weather systems crossed the Rockies, they were moving in a predominantly westerly to northwesterly flow pattern which funneled cold and dry Canadian air masses into the southern U.S. and frequently blocked Gulf of Mexico moisture. This resulted in a drier-than-normal month from the Plains to Midwest and parts of the East. Conditions were especially dry from Wyoming (with low mountain snowpack) to North Dakota, where drought and abnormal dryness expanded. The precipitation anomaly pattern was mostly drier than normal in Puerto Rico, Alaska, and Hawaii, with drought and/or abnormal dryness expanding in Hawaii. When integrated across the CONUS, January 2016 ranked as the 36th driest January in the 1895-2016 record, with the national drought footprint shrinking to 13.0 percent of the U.S. (15.5 percent of the CONUS). According to the Palmer Drought Index, which goes back to the beginning of the 20th century, about 3.0 percent of the CONUS was in moderate to extreme drought at the end of January, a decrease of about 3.5 percent compared to last month.
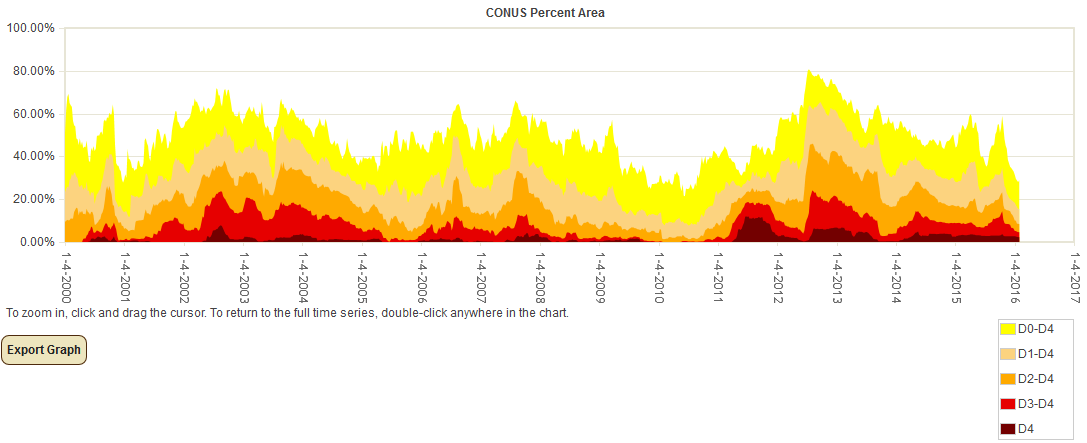
Percent area of the CONUS in moderate to exceptional drought, January 4, 2000 to present, based on the U.S. Drought Monitor.
Palmer Drought Index
The Palmer drought indices measure the balance between moisture demand (evapotranspiration driven by temperature) and moisture supply (precipitation). The Palmer Z Index depicts moisture conditions for the current month, while the Palmer Hydrological Drought Index (PHDI) and Palmer Drought Severity Index (PDSI) depict the current month's cumulative moisture conditions integrated over the last several months. While both the PDSI and PHDI indices show long-term moisture conditions, the PDSI depicts meteorological drought while the PHDI depicts hydrological drought. The PDSI map shows less severe and extensive drought in parts of the West than the PHDI map because the meteorological conditions that produce drought and wet spell conditions are not as long-lasting as the hydrological impacts.
|
 |
Used together, the Palmer Z Index and PHDI maps show that short-term wet conditions occurred over parts of the West, contracting long-term dry conditions in January compared to December. Short-term near-normal to wet conditions resulted in the elimination of the remaining patchy long-term drought in Florida and southeast Georgia. Continued short-term dry conditions slightly expanded the long-term dry conditions in New England and reduced the intensity long-term wet conditions from the Southern Plains to Midwest.
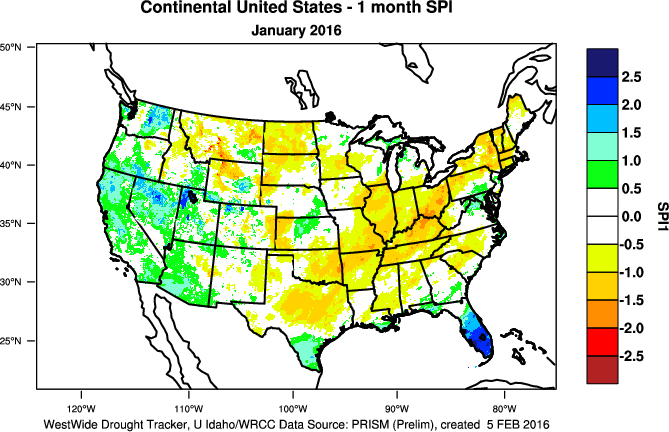
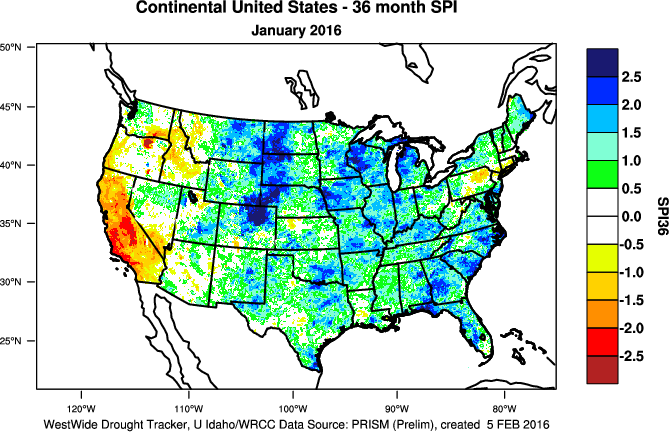
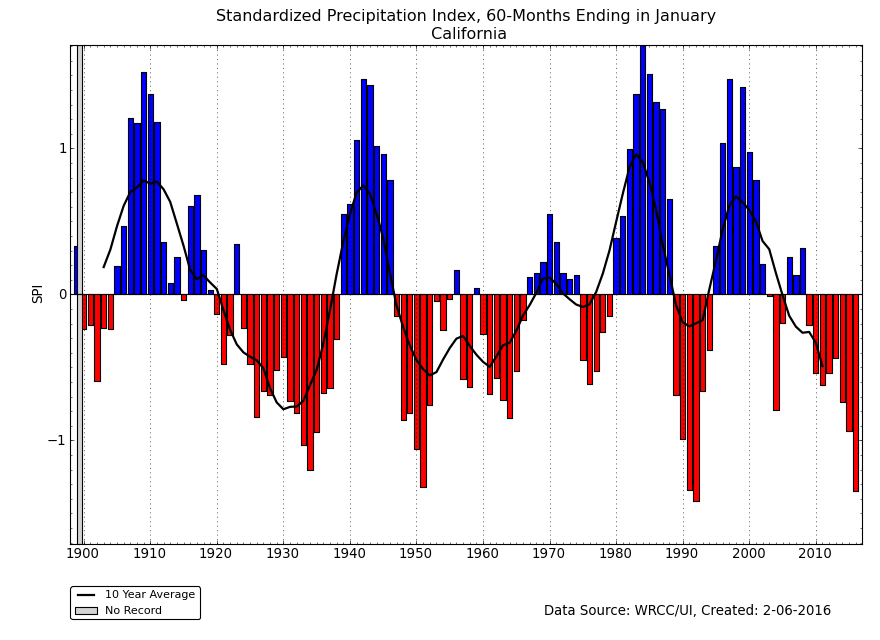
Standardized Precipitation Index
The Standardized Precipitation Index (SPI) measures moisture supply. The SPI maps here show the spatial extent of anomalously wet and dry areas at time scales ranging from 1 month to 24 months.
 |
 |
 |

The SPI maps illustrate how moisture conditions have varied considerably through time and space over the last two years. On the 1-month SPI map, dryness dominates from the Southern Plains to Northeast and across parts of the Northern Plains to Northern Rockies. Wet conditions are evident across much of Florida and the Southwest and parts of the Northwest. But wet conditions dominate many parts of the CONUS at the 2- to 24-month time scales, especially from the Southern Plains to Great Lakes. Dry conditions are evident from Wyoming to North Dakota at 2 to 6 months, in the Northern Rockies at 9 to 12 months, in parts of the Northeast at 2 to 6 months, in parts of California at 12 to 24 months, and in southern New England at all time scales.
 |
 |
 |
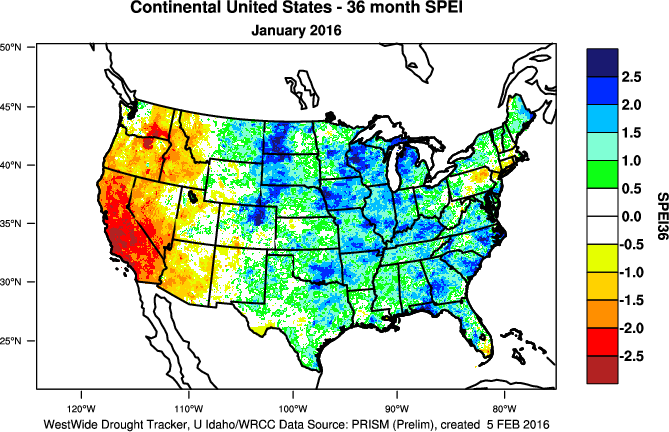
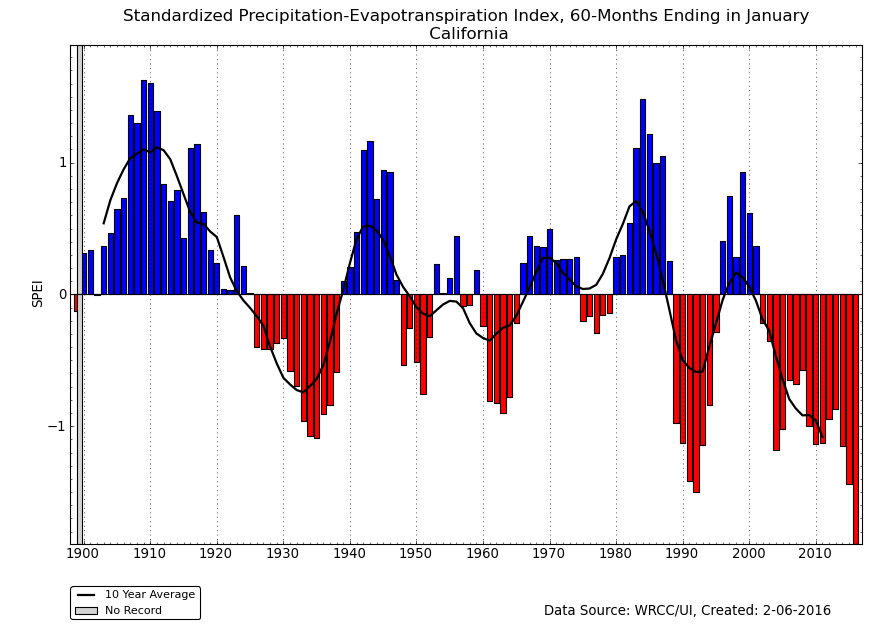
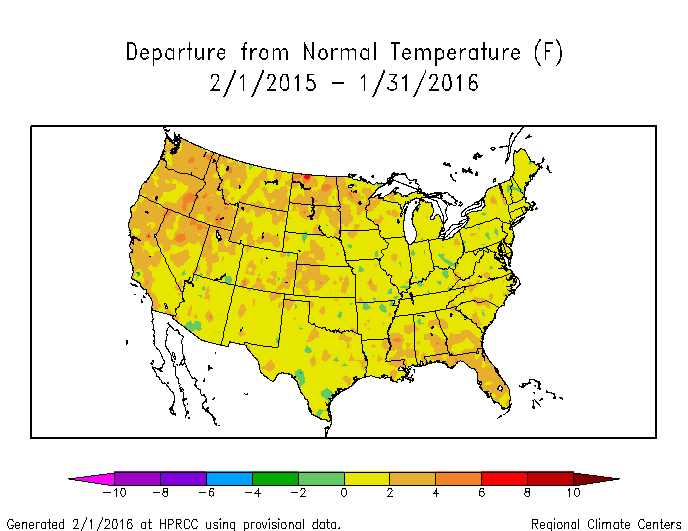
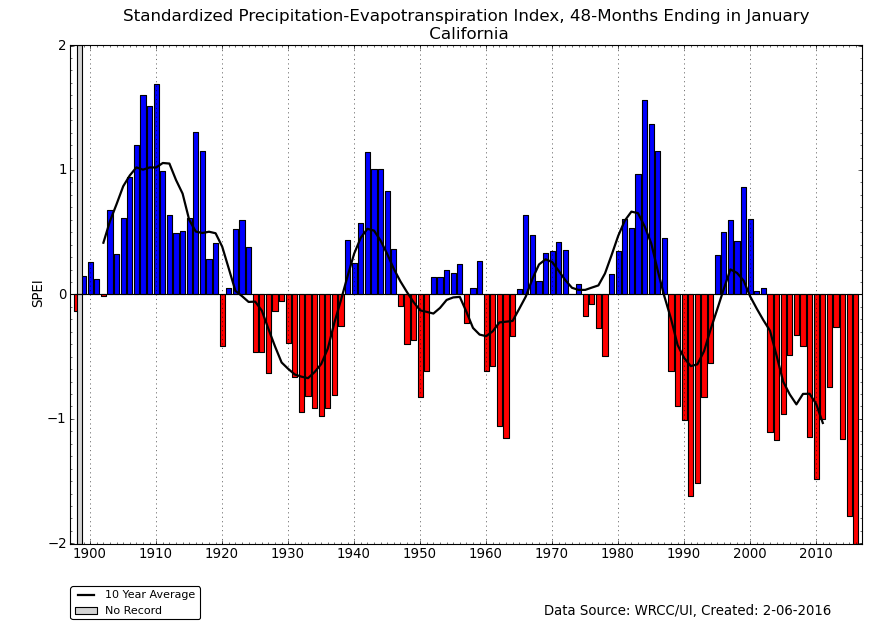
Standardized Precipitation Evapotranspiration Index
The SPI measures water supply (precipitation), while the SPEI (Standardized Precipitation Evapotranspiration Index) measures the combination of water supply (precipitation) and water demand (evapotranspiration as computed from temperature). Warmer temperatures tend to increase evapotranspiration, which generally makes droughts more intense.
 |
 |
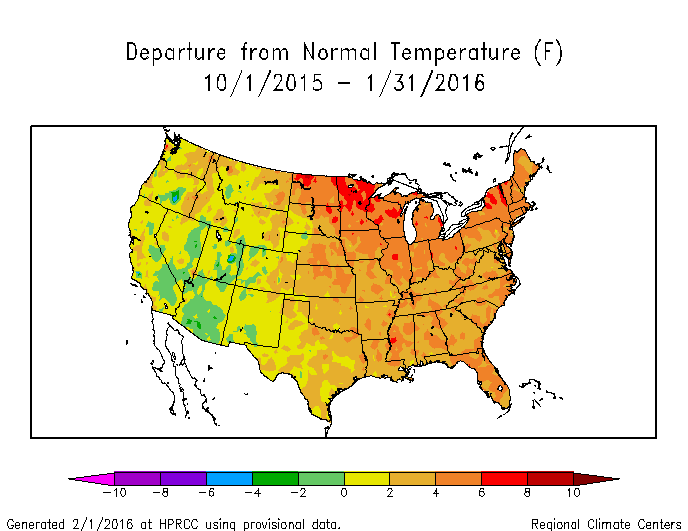
Temperatures were warmer than normal along the northern tier states during January 2016, and near to below normal to the south. With this being the coldest time of year, evapotranspiration is at a minimum, so the January 1-month SPEI and SPI maps are similar in pattern and magnitude. For the year as a whole, much of the country was warmer and wetter than normal, but the warmth in the West exacerbated the dry conditions there, resulting in more severe drought on the 12-month SPEI map there compared to the SPI. The persistent above-normal temperatures in the West have resulted in more severe SPEI values, compared to the SPI, for much of the last six years (SPEI maps for the last 24, 36, 48, 60, 72 months) (SPI maps for the last 24, 36, 48, 60, 72 months). The excessive heat has exacerbated drought conditions.
 |
 |
 |
This is especially the case in California, where the last three February-January 12-month periods ranked as the warmest, second warmest, and third warmest such periods in the 1895-2016 record, and all three were much warmer than all of the years before them. The last three years cap a period of persistent unusual warmth which has lasted over three decades. The precipitation of recent months helped raise California's statewide precipitation rank to 50th driest for February 2015-January 2016. But the persistent dryness over the last nine years still gave the state the second driest SPI for the last 36 and 60 months. When the temperature is factored in, California has had the most severe SPEI for the last 36, 48, 60, and 72 months.
 |
 |
Regional Discussion
 |
 |
CONUS Agricultural & Hydrological Impacts:
Improving drought conditions were reflected in numerous agricultural, hydrological, and other meteorological indicators, both observed and modeled. As of February 2nd, nine percent of the nation's hay, 11 percent of the cattle inventory, seven percent of winter wheat production, and less than one percent of soybean production and corn production were in drought. These are decreases compared to a month ago.
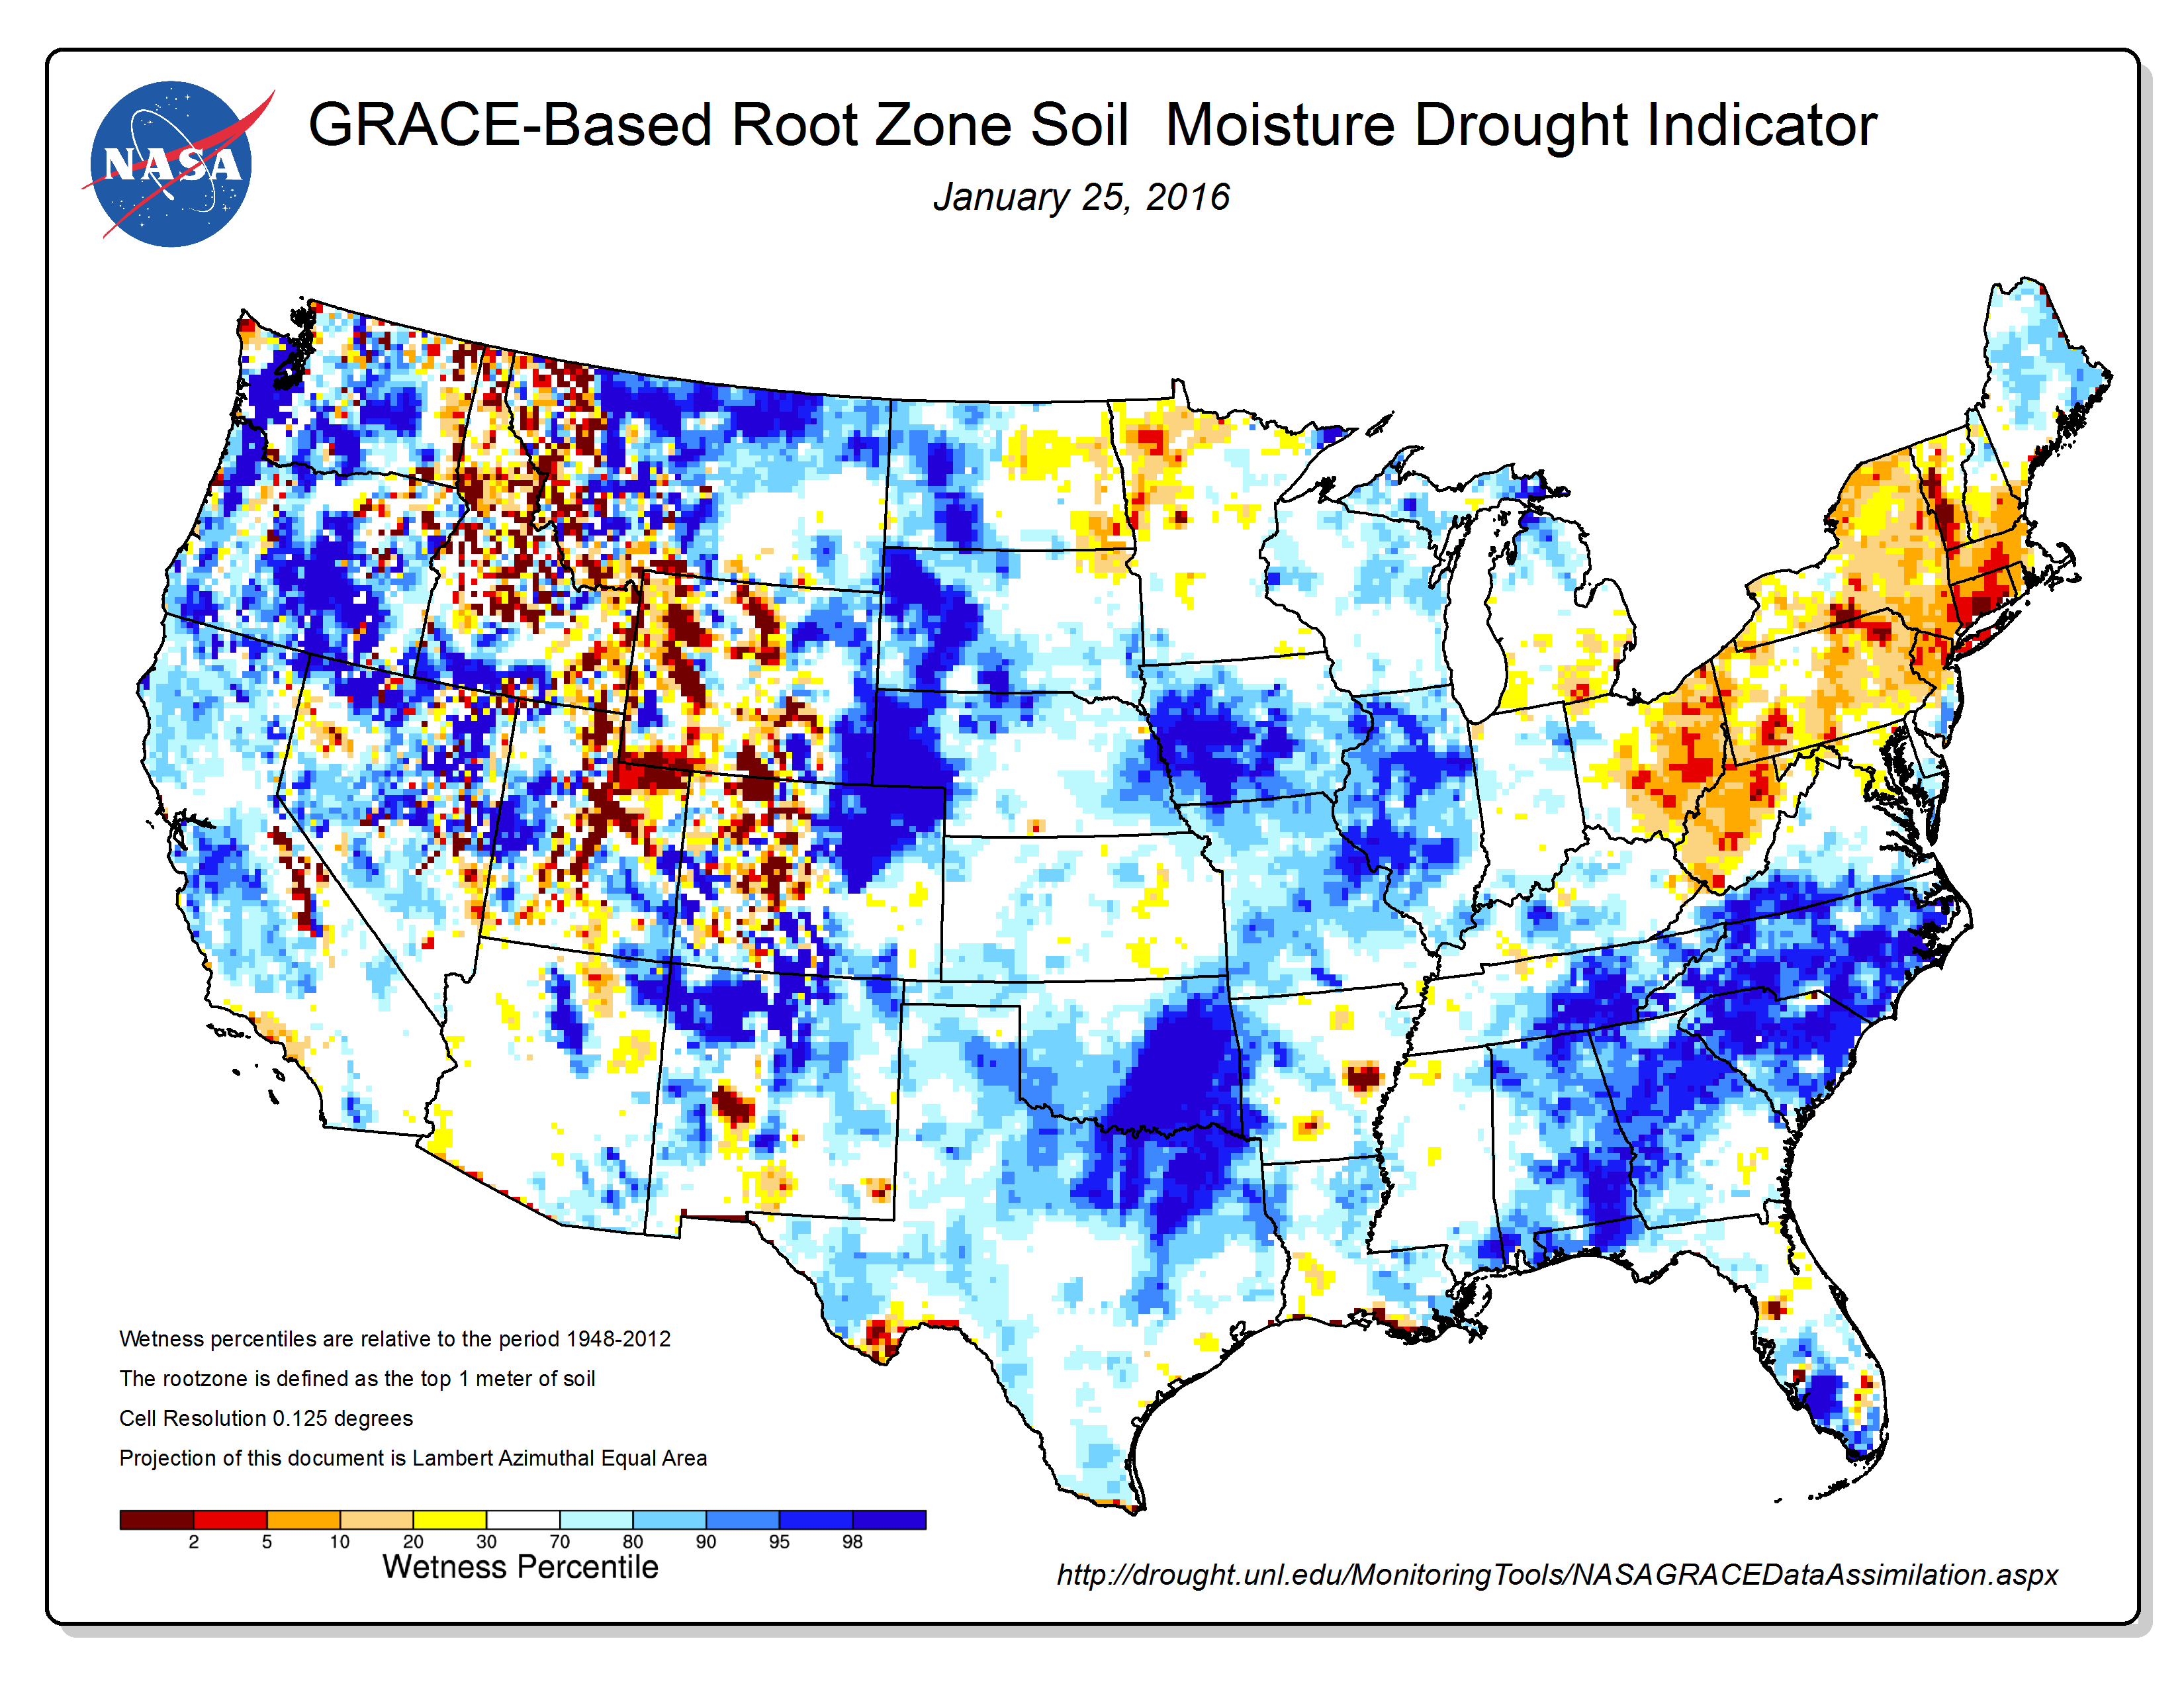
The below-normal precipitation in the Southeast and from the Southern Plains to Midwest resulted in decreasing soil moisture conditions. Soil moisture was still above normal in the Southern Plains and Southeast from previous wet months, but soils were getting dry in Ohio to West Virginia.
Drought conditions at the end of the month, as depicted on the February 2nd USDM map, included the following CONUS core drought and abnormally dry areas:
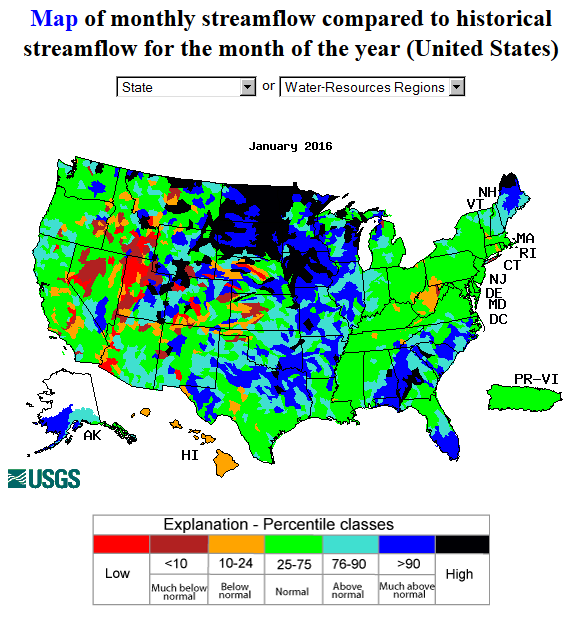
- Moderate (D1) to severe (D2) drought covered a large part of the western U.S., with extreme (D3) to exceptional (D4) drought extending from California and Nevada into the Pacific Northwest and Northern Rockies. —
- The above-normal January precipitation continued to improve short-term conditions in the West — soil moisture, streamflow, and mountain snowpack — but long-term conditions lagged behind. Some reservoir levels improved, but many reservoirs were still low, especially in California; ground water and spring levels were slow to improve; and there were still areas with low streamflow and soil moisture. Based on local reports relayed by the California offices of the NOAA National Weather Service, springs and grasslands were still slow to respond to the rainfall in southern Humboldt and Mendocino Counties; plants showed extensive drought stress in eastern Del Norte County; new wells were drying up in Stanislaus County; and water restrictions and conservation measures continued across San Joaquin Valley and the surrounding mountains.
- Abnormally dry to moderate drought conditions continued in parts of the Northeast. —
- Pockets of abnormally dry to moderate drought conditions lingered and expanded in parts of the Northern Plains. —
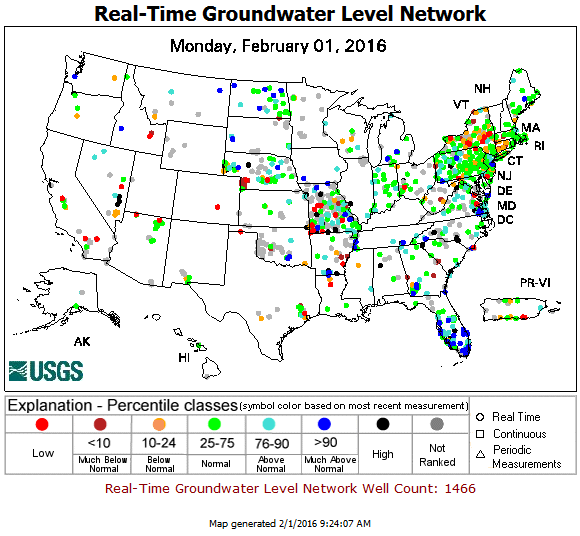
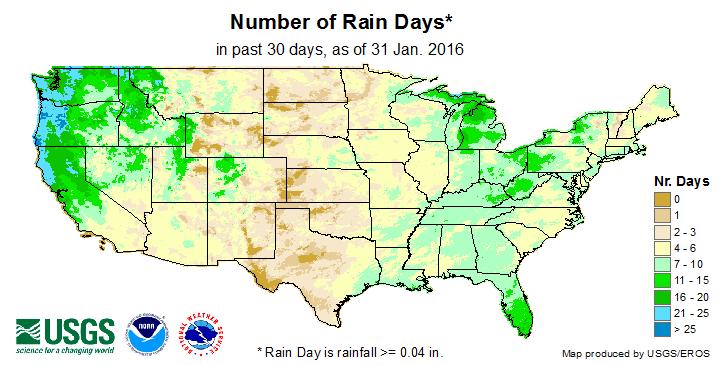
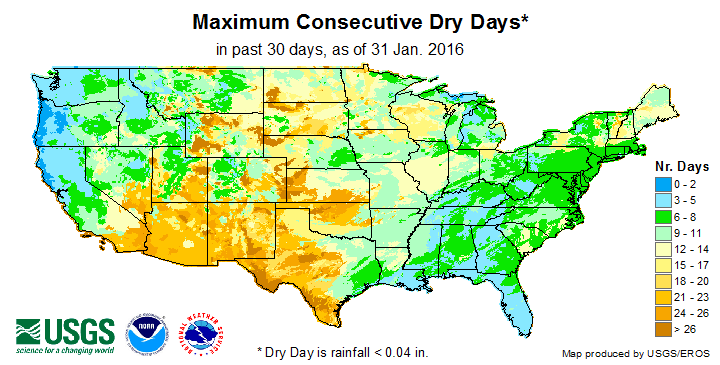
- Dryness from Wyoming to North Dakota was evident in few days with precipitation, long runs of consecutive dry days, ground water, and several soil moisture indicators.
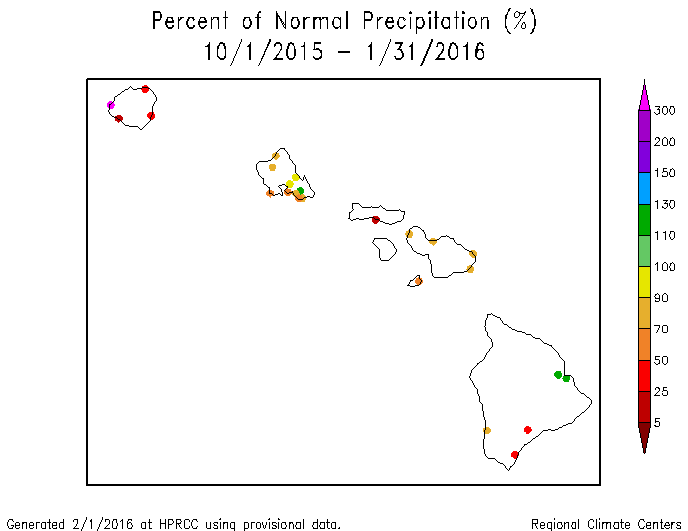
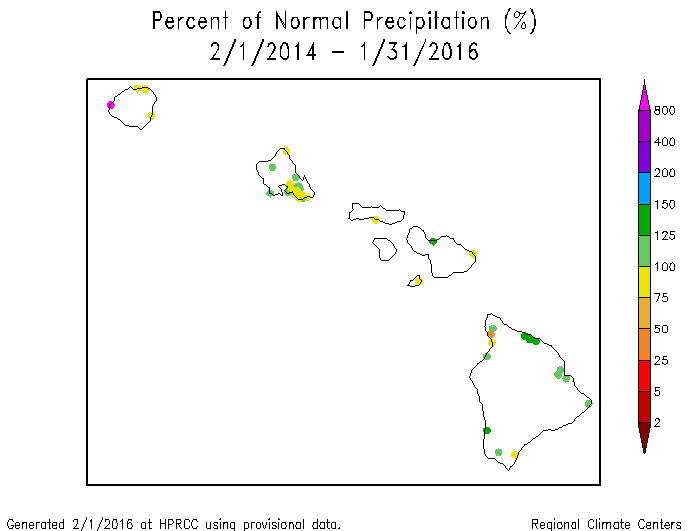
Hawaii: January 2016 was drier than normal across Hawaii. The dryness of the last couple months has resulted in a drier-than-normal pattern for most stations for the last 2, 3, and 4 months. A mixed precipitation anomaly pattern is evident at the longer time scales (last 6, 12, 24, and 36 months). Abnormal dryness had expanded to cover all of the state, with drought covering about 19 percent, on the February 2nd USDM map.
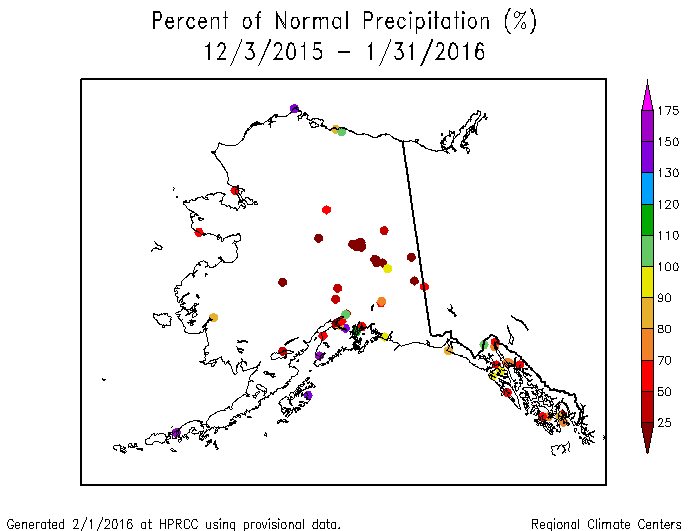
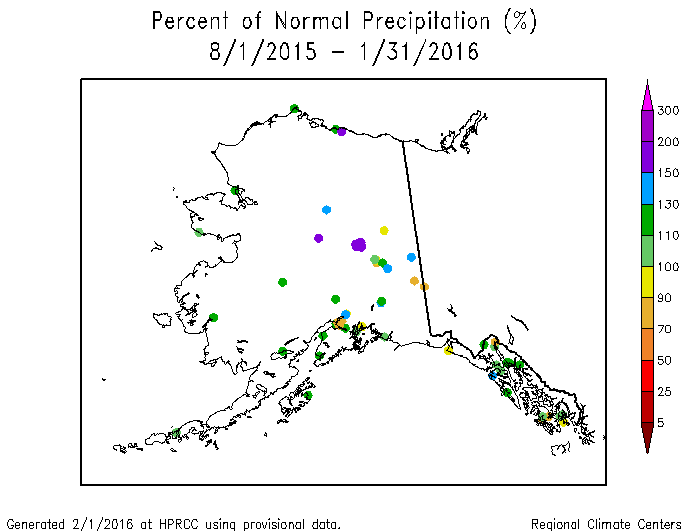
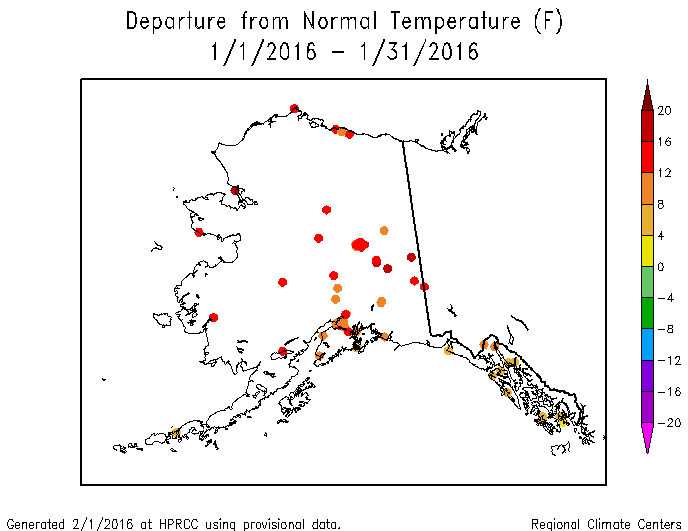
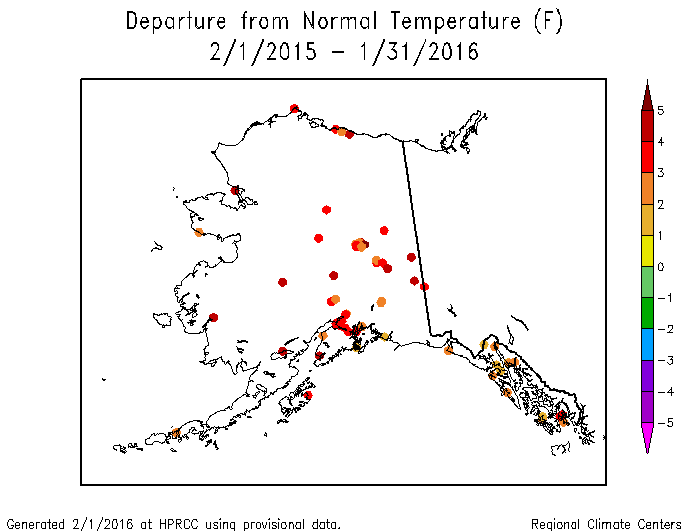
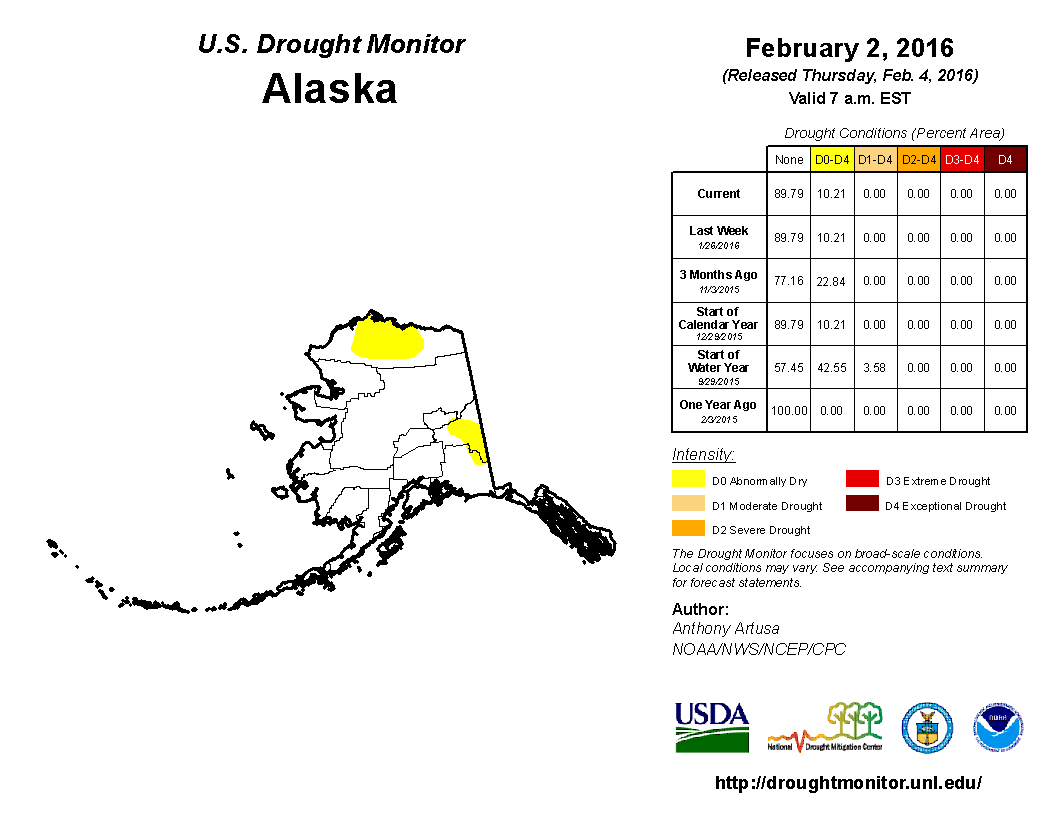
Alaska: A drier-than-normal precipitation pattern dominated Alaska during December and January, which is in contrast to the wetter pattern of the previous months (station maps for January and the last 2, 3, 4, 6, 12 months) (climate division maps for January and the last 3, 6, 12 months). A mixed precipitation anomaly pattern is evident at longer time scales (last 24 and 36 months). Warmer-than-normal temperatures have dominated for most of the last 12 months on both the climate division (last 1, 3, 6, 12 months) and station (last 1, 2, 3, 4, 12 months) analyses. Snowpack water content was varied from basin to basin. Abnormal dryness continued across 10.2 percent of the state on the February 2nd USDM map.
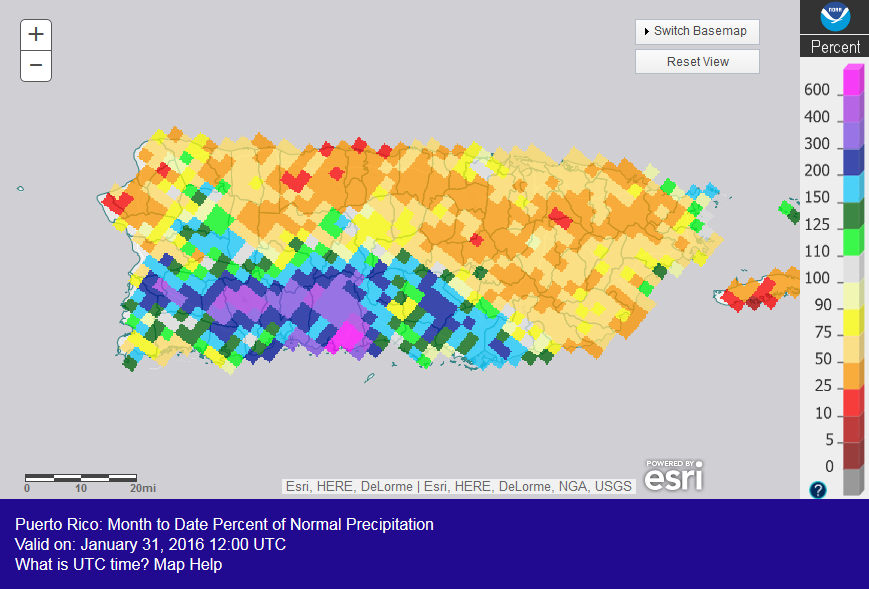
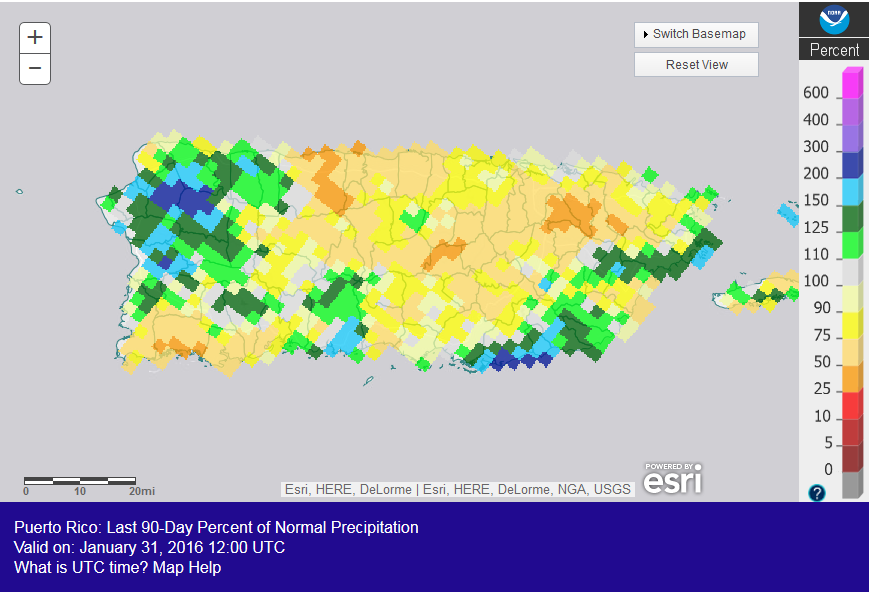
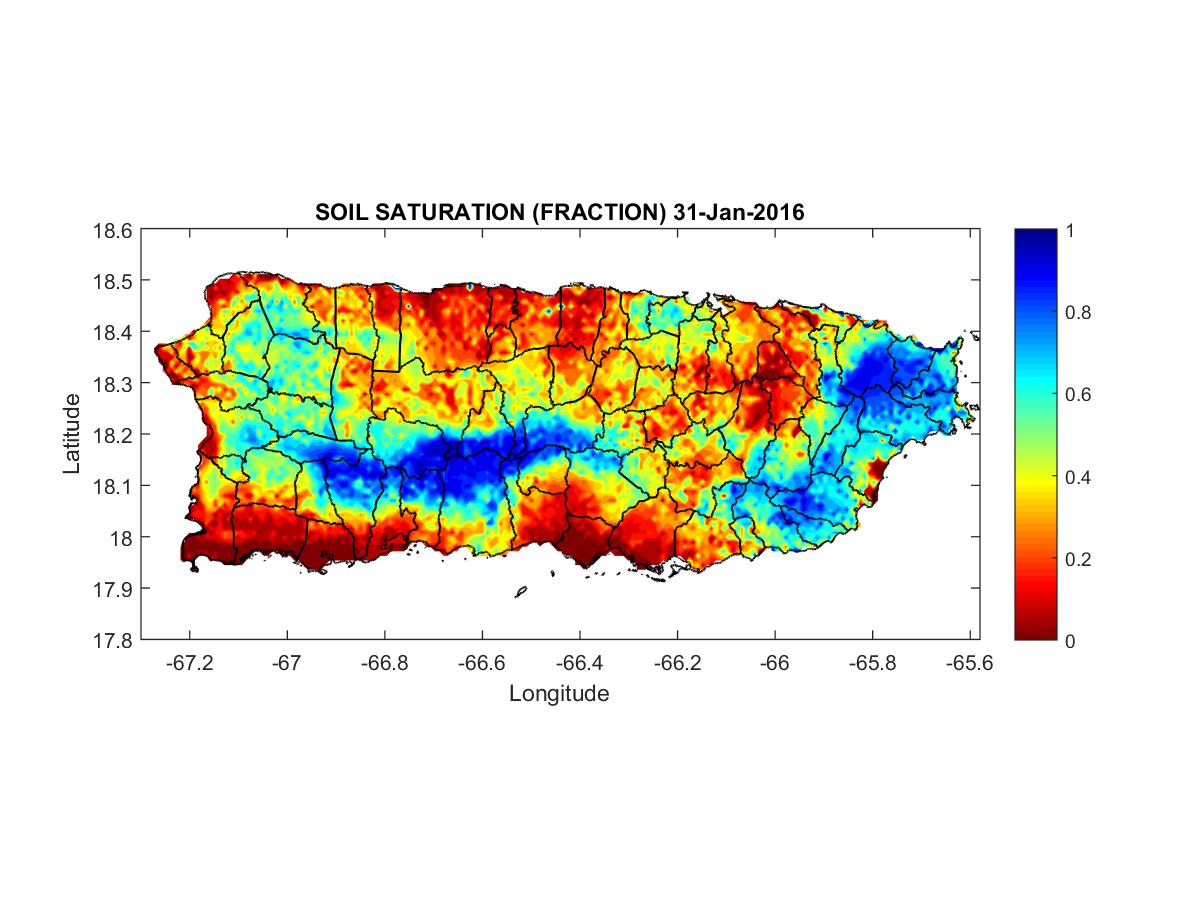
Puerto Rico: Most of Puerto Rico was drier than normal during January, except for the southwestern portion. Dryness dominated at most time scales (last 2, 3, 4, 6 months), except for wetter-than-normal conditions in the west at the longer time scales. Soils were dry across much of the coastal area. On the February 2nd USDM map, abnormal dryness and drought held constant at about 59.0 percent of Puerto Rico, with moderate to extreme drought constant at 41.7 percent of the island.
CONUS State Precipitation Ranks:
 |

|

Connecticut statewide precipitation, February-January, 1895-2016.
January 2016 was drier than normal from the Great Plains to the Northeast, with 28 states ranking in the driest third of the 1895-2016 record. Only one state — Ohio — ranked in the top ten category at ninth driest.
With wet conditions dominating in December and earlier months, most states had precipitation ranks in the near-normal to wetter-than-normal range for November-January, August-January, and February-January. But parts of the Northeast have been consistently drier than normal during these time periods. One state ranked in the top ten driest category — Connecticut — with the ninth driest August-January and third driest February-January.
|

|

Percent area of the Western U.S. in moderate to extreme drought, January 1900 to present, based on the Palmer Drought Index.
January was wetter than normal across most of the West. With December also wetter than normal across much of the West and November and October wetter than normal in many parts of the West, the last two to four months show a surplus of precipitation. Much of this water year-to-date (October 1-present) precipitation has fallen in the form of snow which has brought the mountain snowpack to above-normal levels in many areas. The precipitation has been enough to improve drought conditions, based on the Palmer Drought Index, but deficits built up over the last several years will take much more precipitation to ease, as reflected in the USDM. According to the USDM, 38.5 percent of the West was experiencing moderate to exceptional drought at the end of January, which is less than the previous month. The Palmer Drought Index percent area statistic for the West was 8.0 percent, which is about half of the amount from the previous month.
 |
 |
January 2016 was drier- and warmer-than-normal in the Primary Hard Red Winter Wheat agricultural belt, ranking as the 38th driest and 33rd warmest January in the 1895-2016 record, regionwide. October marks the beginning of the growing season. The region was generally wetter- and warmer-than-normal for the growing season-to-date, with October 2015-January 2016 ranking as the third wettest and sixth warmest October-January in the 1895-2016 record, regionwide.
NOAA Regional Climate Centers:
A more detailed drought discussion, provided by the NOAA Regional Climate Centers and others, can be found below.
West
As described by the High Plains Regional Climate Center, a wide range of climate conditions occurred across the High Plains region during January. Much of North Dakota had below normal precipitation in January, as did South Dakota, northern Wyoming, eastern Colorado, western and central Nebraska, and western and southern Kansas. Wetter conditions prevailed in parts of Wyoming and Colorado, as well as an area from northern Kansas northward through southeastern South Dakota. Jamestown, North Dakota had its driest January on record, recording only a trace of precipitation the entire month (period of record 1949-2016). Worland, Wyoming was also rather dry, as January 2016 came in as the 6th driest January on record with only 0.03 inch (1 mm) of precipitation (period of record 1961-2016). Worland is in the Bighorn Mountains area of northern Wyoming that has been experiencing below normal precipitation since the fall, resulting in a below normal snowpack and the development of drought conditions.
The snowpack story for January is very similar to December. Snowpack continued to do well in Colorado, as the Rockies experienced above normal precipitation. Snow water equivalent was still above 100 percent of median for most of the state as of the end of January, with the exception of a few SNOTEL sites in the northern part of the state. As for Wyoming, snowpack improved in the western and southern parts of the state, but it is still below normal in the Bighorn Mountains in northern Wyoming, a region that is now in drought. Because it is early in the season, it is important to keep in mind that these conditions can change quite dramatically over the course of the season.
Just like last month, drought conditions both improved and degraded across parts of the High Plains region in January, according to the USDM. The biggest improvement came in North Dakota, where moderate drought (D1) and abnormal dryness (D0) were reduced in the south-central part of the state. The region in D0-D1 improved from about 39 percent to just over 25 percent from the beginning to the end of the month. This area received some snowfall in mid-January, helping to alleviate drought and dry conditions there. The D1 that was introduced in northern Wyoming in December expanded southward in January to include parts of central Wyoming. The area in drought in the state was nearly 13 percent as of the end of the month. Precipitation has been below normal in this region since the summer. The area in drought includes the Bighorn Mountains, where the snowpack season got off to a slow start and has yet to recover. D0 also expanded into areas west of the region in drought so that just over three-quarters of Wyoming was experiencing D0 or D1 conditions as of the end of January. The rest of the region remained relatively unchanged in January where drought is concerned. Because this is the driest time of the year and soils are frozen, drought conditions do not normally change rapidly. Impacts from drought or dryness are also typically minimal this time of year due to factors such as little agricultural activity.
As explained by the Southern Regional Climate Center, January precipitation in Southern region did not vary much from state to state in terms of anomalies, except for in central Texas and central Oklahoma, where precipitation totals were generally below twenty-five percent of normal. January average temperatures were generally near normal across the region. Although all six states in the Southern region experienced a drier than normal month, the region remains drought-free. Below average temperatures could account for this as they tend to reduce the water demand on soils.
As summarized by the Midwest Regional Climate Center, January temperatures in the Midwest averaged slightly above normal and precipitation was generally below normal though there were pockets of above normal precipitation located mostly in the northern half of the region. The dry conditions in January helped draw down rivers still flooded from the plentiful rains of December. Despite the dry month, the Midwest remained free of drought during the month. Only a small percentage of the region was classified as abnormally dry.
As noted by the Southeast Regional Climate Center, temperatures were slightly below average across the Southeast region, and precipitation was highly variable. The driest locations were found across east-central Georgia, central portions of the Carolinas, and southwestern Virginia, where monthly precipitation totals were between 50 and 25 percent of normal. Precipitation was also well below normal across much of Puerto Rico and the U.S. Virgin Islands, with the exception of southwestern portions of Puerto Rico. Christiansted, USVI (1952-2016) observed its second driest January on record with only 0.50 inch (12.7 mm) of precipitation. Drought conditions (D1 and greater) were not observed across the Southeast region (excluding Puerto Rico) during January. The extent of moderate-to-extreme (D1 through D3) drought conditions across portions of eastern and southern Puerto Rico remained at 42 percent during the month.
As explained by the Northeast Regional Climate Center, the Northeast received 2.25 inches (57.15 mm) of precipitation in January, which was 73 percent of normal. All states were drier than normal, with four ranking this January among their top 20 driest. The region was 1.7 degrees F (0.9 degrees C) warmer than normal in January. Nine of the twelve states saw above-normal temperatures, with four ranking this January among their top 20 warmest. The USDM from January 7 showed 28 percent of the Northeast was abnormally dry, while another 7 percent was experiencing moderate drought. The January 22 to 24 snowstorm helped ease dry conditions in some areas. By month's end, 23 percent of the region was abnormally dry and 3 percent was experiencing moderate drought.
As summarized by the Western Regional Climate Center, several storms affected the West this month, with above normal precipitation in many areas, and constant or added mountain snowpack. Temperatures were slightly below normal in the south and near to slightly above normal along the coast and northern tier.
Snowpack increased or held steady for western mountains this month. The Sierra Nevada saw beneficial snowfall and ended January at 113% of normal snow water equivalent (SWE). This was the first time since 2011 that above normal snowpack was observed there at the end of January. Near to slightly above normal SWE was reported in the Cascades. SWE across Great Basin ranges was generally 150% of normal at month's end. Much of the Rocky Mountains saw SWE values near normal. The month helped to reduce drought conditions in much of the West. The USDM showed large areas of improvement in the eastern Great Basin, eastern Washington and Oregon, and northern Arizona.
A few areas of the West saw drier than normal conditions this month. In eastern New Mexico, Tucumcari received no measurable precipitation this month (normal is 0.46 in/12 mm). This occurred 12 other times in the station's 76-year record. In northwestern Wyoming, Buffalo Bill Dam reported 0.05 in (1 mm), 15% of normal. Persistent drier than normal conditions along the Wyoming-Montana border have moved the area into abnormally dry/moderate drought on the USDM.
Temperatures were above normal throughout the state of Alaska this month. In the coastal southwest, temperatures at King Salmon averaged to 32.4 F (0.2 C), 16.2 F (9 C) above normal and tied for 4th warmest since records began in 1917. Further inland, McGrath had its 6th warmest January in a 76-year record at 8.5 F (-13 C), 14.9 F (8.3 C) above normal. Precipitation was generally below normal for the state this month, though some areas on the southern and northern coasts saw above normal totals. Fairbanks recorded only 0.01 in (less than 1 mm) for the month, 2% of normal and tied with 1966 for driest January since records began in 1929. Consistent with a strong El Niño episode, Hawaii saw below normal precipitation statewide this month. Most reporting stations observed less than 25% of normal precipitation. Honolulu recorded 0.03 in (less than 1 mm) of rainfall for the second driest January in a 77-year record. Temperatures were near to slightly above normal for much of the state, though Hilo observed its second warmest January on record at 74.1 F (23 C), 2.7 F (1.5 C) above normal.
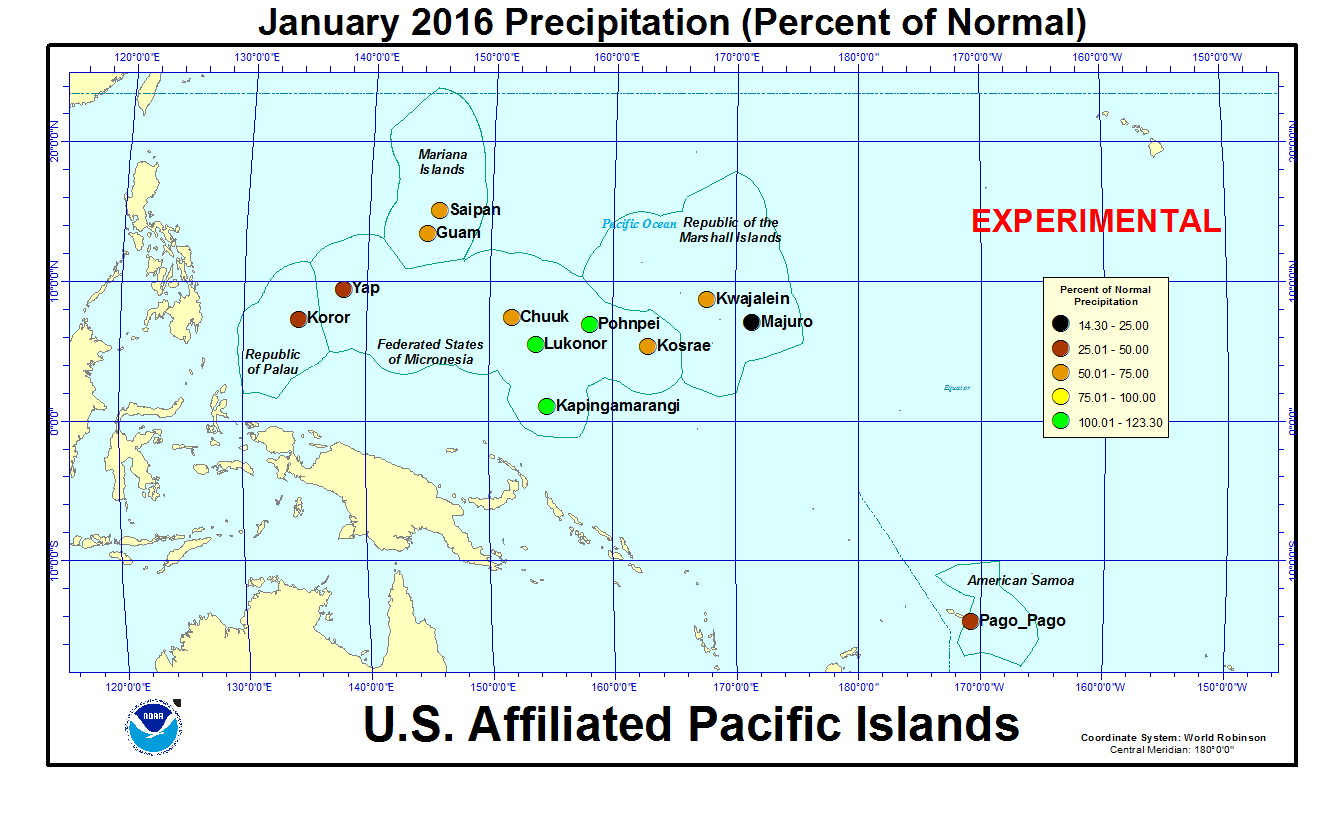
Pacific Islands: According to reports from National Weather Service offices, the Pacific ENSO Applications Climate Center (PEAC), and partners, conditions varied across the Pacific Islands.
In the U.S. Affiliated Pacific Islands (maps — Micronesia, Marshall Islands, basinwide), January 2016 was wetter than normal at only Kapingamarangi, Lukonor, and Pohnpei, and drier than normal at the rest of the primary stations.
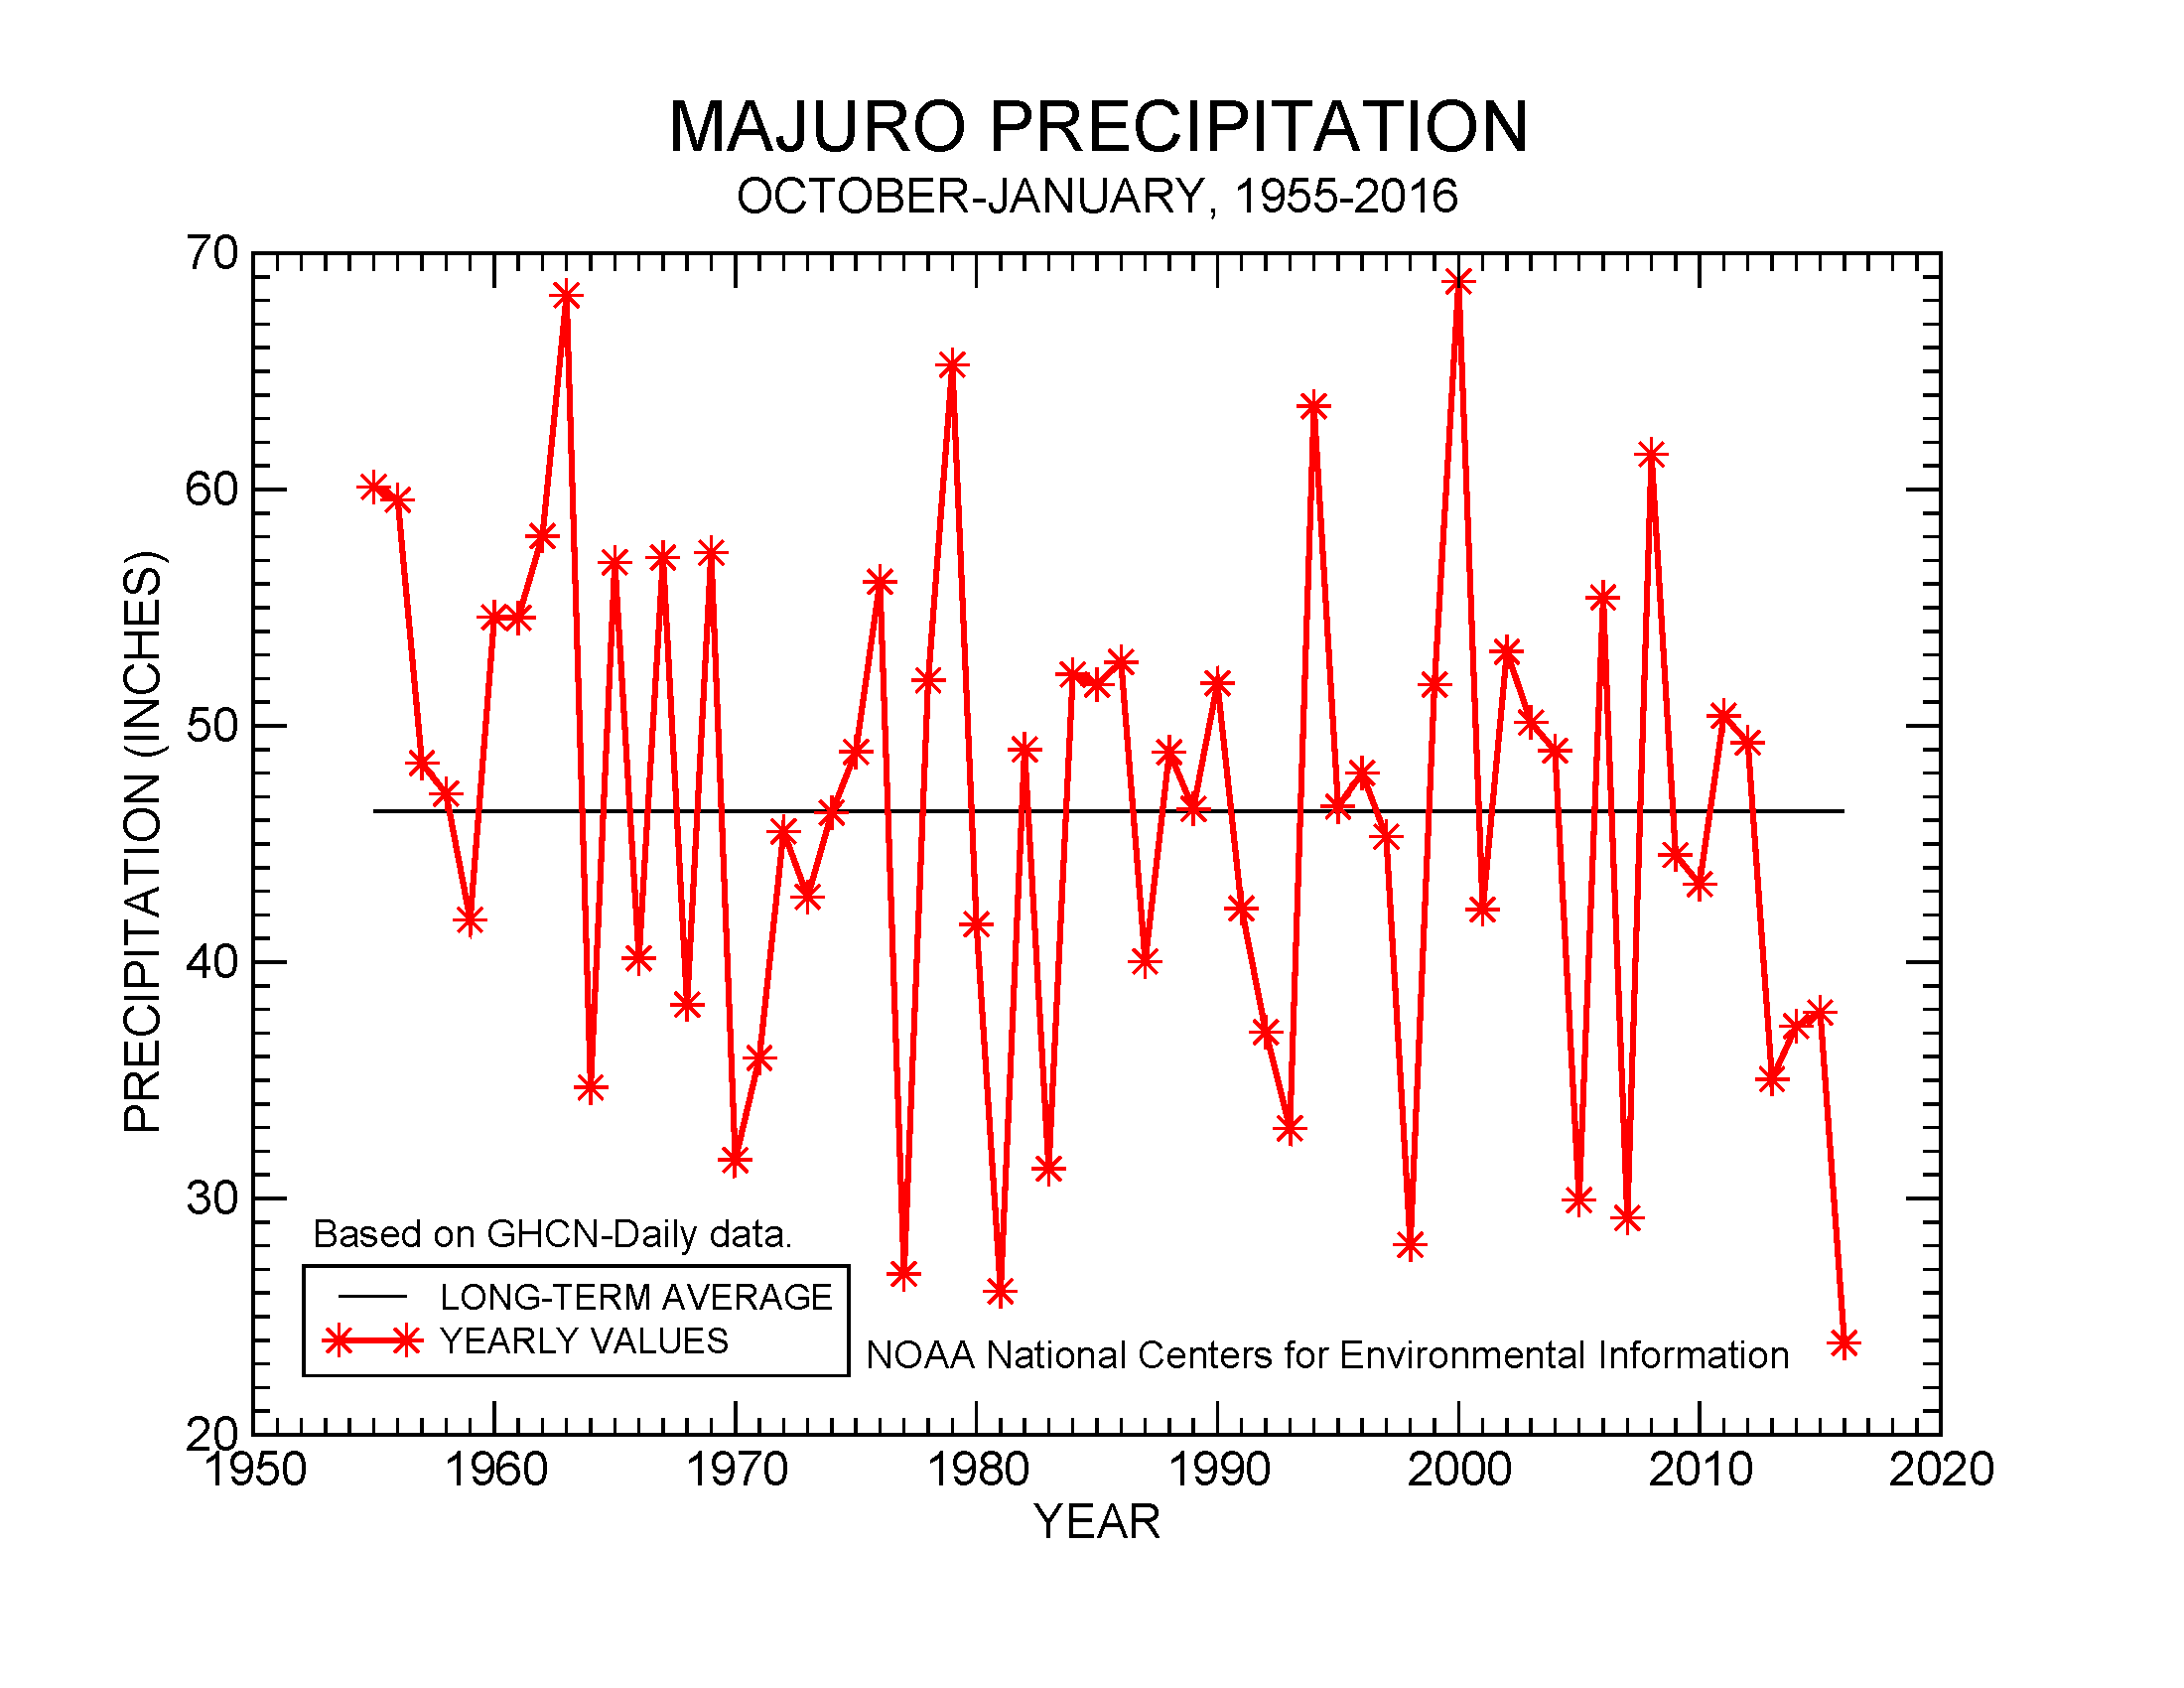
Rainfall amounts were below the minimum thresholds (4 or 8 inches) required to meet most monthly water needs at stations across the region. These included Guam, Rota, and Saipan in the Mariana Islands; Koror in the Republic of Palau; Dugor, Fananu, Gilman, Luweech, Maap, North Fanif, Rumung, Tamil, Ulithi, Woleai, and Yap in the Federated States of Micronesia (FSM); Ailinglapalap, Kwajalein, Majuro, Jaluit, Mili, Utirik, and Wotje in the Republic of the Marshall Islands; and Pago Pago in American Samoa. Only the stations in the southeastern FSM states of Pohnpei and Kosrae — including Kapingamarangi, Kosrae, Lukonor, Nukuoro, Pingelap, and Pohnpei — had more than 8 inches of rain. Koror had 2.64 inches of rain in January, with 10 of the last 13 months drier than 8 inches. In the FSM, Yap reported 2.23 inches of rain in January, with the last four months very dry. The stations on the islands around Yap have also been much drier than 8 inches for each of the last four months. Gilman and Ulithi have reported less than 8 inches for the last five months, and Woleai for the last six months. Ulithi reported 1.29 inches of rain for January, and Woleai only 0.34 inch. In the Marshall Islands, Ailinglapalap has had less than 8 inches of precipitation for 9 of the last 13 months, Jaluit for 10 of the last 12 months, and Mili for 10 of the last 15 months. Mili received 2.22 inches of rain in January, Kwajalein 2.03 inches, Majuro 1.11 inches, Utirik 0.39 inch, and Wotje only a trace of rain. The 4- and 8-inch thresholds are important because, if monthly precipitation falls below the threshold, then drought becomes a concern. Below-normal rainfall is expected to continue for many of these stations as the strong El Niño persists.
An analysis of historical data for the USAPI stations in the Global Historical Climatology Network-Daily (GHCN-D) dataset indicated that several stations had record or near-record dryness during January and the last four months. Some stations have a long period of record and their dataset is fairly complete, while other stations have a shorter period of record and the dataset has some missing data. The last four months have been the driest October-January on record for Koror and Yap out of 65 years of data, and driest for Majuro out of 62 years of data. Woleai had the driest January (out of 34 years of data) and driest October-January (out of 29 years of data). Ulithi had the driest January (out of 24 years of data) and third driest October-January (out of 23 years of data). Jaluit and Mili also had the driest October-January on record, but they had fewer years of data (about a dozen years).
Rank of 1 = driest.
| Station | January 2016 Rank |
January No. of Years |
October 2015-January 2016 Rank |
October-January No. of Years |
Period of Record |
| Woleai | 1 | 34 | 1 | 29 | 1968-2016 |
| Koror | 2 | 65 | 1 | 65 | 1951-2016 |
| Mili | 2 | 18 | 1 | 12 | 1985-2016 |
| Jaluit | 3 | 19 | 1 | 13 | 1985-2016 |
| Yap | 4 | 65 | 1 | 65 | 1951-2016 |
| Majuro | 5 | 62 | 1 | 62 | 1954-2016 |
| Kosrae | 10 | 44 | 2 | 33 | 1954-2016 |
| Pingelap | 14 | 27 | 2 | 21 | 1985-2016 |
| Ulithi | 1 | 24 | 3 | 23 | 1989-2016 |
| Ailinglapalap | 13 | 22 | 3 | 14 | 1985-2016 |
| Lukonor | 13 | 21 | 4 | 18 | 1986-2016 |
| Saipan | 4 | 28 | 5 | 25 | 1988-2016 |
| Kapingamarangi | 13 | 26 | 8 | 18 | 1962-2016 |
| Chuuk | 20 | 65 | 8 | 65 | 1951-2016 |
| Kwajalein | 20 | 64 | 10 | 63 | 1952-2016 |
| Pohnpei | 41 | 65 | 10 | 65 | 1951-2016 |
| Guam | 13 | 59 | 14 | 59 | 1957-2016 |
| Nukuoro | 10 | 28 | 15 | 24 | 1985-2016 |
| Pago Pago | 1 | 50 | 34 | 50 | 1966-2016 |
| Wotje | 1 | 21 | N/A | 13 | 1985-2016 |
| Utirik | 2 | 18 | N/A | 8 | 1985-2016 |
 |
 |
|
In early February 2016, the NOAA National Weather Service office in Guam updated the Drought Information Statement for the Republic of Palau, Yap State in the FSM, and the Marshall Islands to include the Marianas Islands and Chuuk State in the FSM. The Drought Information Statement noted the very dry conditions of the last four months and urged close monitoring of water supplies, implementation of water conservation measures, and concern for grass fires and impacts on crops and other vegetation. Also in early February the government of the Republic of the Marshall Islands declared a State of Emergency due to drought. Thirteen atolls have formally requested assistance from the National Government starting January 14 to address water shortage challenges; household water catchments and other water storage facilities have run out of water; and drought effects are beginning to be seen on agriculture.
As measured by percent of normal precipitation, Koror, Kosrae, and Yap have been drier than normal in the short term (January and the last 3 months [November 2015-January 2016]) as well as the long term (last 12 months [February 2015-January 2016]). Kapingamarangi was near normal at all three time scales. Chuuk, Guam, Kwajalein, Majuro, and Saipan have been drier than normal in the short term but near to wetter than normal in the long term. Lukonor was wetter than normal in January but drier than normal at the other two time scales. Pago Pago was drier than normal in January but near to wetter than normal at the other two time scales. Pohnpei was drier than normal for the last 3 months but near to wetter than normal at the other two time scales.
| Station Name | Feb 2015 | Mar 2015 | Apr 2015 | May 2015 | Jun 2015 | Jul 2015 | Aug 2015 | Sep 2015 | Oct 2015 | Nov 2015 | Dec 2015 | Jan 2016 | Feb- Jan |
|---|---|---|---|---|---|---|---|---|---|---|---|---|---|
| Chuuk | 134% | 209% | 104% | 89% | 172% | 54% | 155% | 188% | 53% | 70% | 82% | 63% | 108% |
| Guam NAS | 6% | 198% | 263% | 291% | 86% | 215% | 146% | 108% | 125% | 81% | 74% | 65% | 111% |
| Kapingamarangi | 131% | 62% | 87% | 173% | 161% | 54% | 162% | 112% | 63% | 89% | 134% | 103% | 97% |
| Koror | 83% | 69% | 74% | 33% | 107% | 27% | 73% | 143% | 53% | 69% | 41% | 26% | 61% |
| Kosrae | 114% | 91% | 92% | 84% | 143% | 108% | 138% | 115% | 63% | 33% | 95% | 60% | 80% |
| Kwajalein | 149% | 994% | 322% | 204% | 117% | 104% | 171% | 95% | 105% | 88% | 59% | 64% | 145% |
| Lukonor | 97% | 99% | 83% | 89% | 136% | 77% | 75% | 149% | 40% | 123% | 56% | 123% | 82% |
| Majuro | 63% | 329% | 162% | 171% | 57% | 87% | 207% | 96% | 83% | 40% | 61% | 14% | 106% |
| Pago Pago | 102% | 64% | 153% | 172% | 170% | 72% | 125% | 18% | 88% | 210% | 183% | 34% | 102% |
| Pohnpei | 100% | 138% | 119% | 219% | 108% | 138% | 199% | 124% | 78% | 67% | 71% | 102% | 121% |
| Saipan | 14% | 315% | 203% | 341% | 115% | 112% | 141% | 92% | 198% | 64% | 154% | 54% | 133% |
| Yap | 89% | 93% | 139% | 235% | 92% | 82% | 148% | 68% | 43% | 37% | 58% | 35% | 88% |
| Station Name | Feb 2015 | Mar 2015 | Apr 2015 | May 2015 | Jun 2015 | Jul 2015 | Aug 2015 | Sep 2015 | Oct 2015 | Nov 2015 | Dec 2015 | Jan 2016 | Feb- Jan |
|---|---|---|---|---|---|---|---|---|---|---|---|---|---|
| Chuuk | 9.68" | 17.37" | 13.03" | 10.08" | 20.03" | 6.45" | 19.91" | 22.07" | 6.09" | 7.46" | 9.25" | 6.40" | 147.82" |
| Guam NAS | 0.18" | 4.09" | 6.65" | 9.91" | 5.32" | 21.80" | 21.54" | 13.71" | 14.26" | 5.96" | 3.77" | 2.62" | 109.81" |
| Kapingamarangi | 12.19" | 7.05" | 11.82" | 20.84" | 22.14" | 7.71" | 13.14" | 11.08" | 5.13" | 8.28" | 13.20" | 9.40" | 141.98" |
| Koror | 7.07" | 5.11" | 5.42" | 3.96" | 18.66" | 4.98" | 9.90" | 16.88" | 6.24" | 7.86" | 4.59" | 2.64" | 93.31" |
| Kosrae | 14.73" | 14.57" | 16.12" | 14.89" | 20.90" | 16.17" | 19.69" | 16.36" | 6.90" | 4.55" | 15.37" | 9.95" | 170.2" |
| Kwajalein | 3.94" | 23.37" | 16.94" | 13.69" | 8.12" | 10.28" | 16.63" | 10.24" | 11.71" | 9.98" | 3.90" | 2.02" | 130.82" |
| Lukonor | 8.70" | 9.16" | 9.36" | 10.36" | 15.83" | 12.22" | 10.55" | 15.15" | 4.53" | 11.18" | 6.35" | 10.37" | 123.76" |
| Majuro | 4.32" | 21.65" | 15.23" | 17.27" | 6.31" | 9.72" | 24.24" | 10.72" | 10.52" | 5.33" | 6.93" | 1.11" | 133.35" |
| Pago Pago | 12.22" | 6.88" | 14.35" | 16.59" | 9.07" | 3.99" | 6.75" | 1.20" | 8.15" | 21.33" | 23.53" | 4.49" | 128.55" |
| Pohnpei | 9.58" | 18.14" | 21.94" | 43.68" | 16.03" | 21.31" | 28.33" | 15.59" | 11.86" | 9.95" | 11.41" | 13.49" | 221.31" |
| Saipan | 0.35" | 5.95" | 5.34" | 8.11" | 4.15" | 10.00" | 18.51" | 9.26" | 21.00" | 3.61" | 5.94" | 1.36" | 93.58" |
| Yap | 4.60" | 4.22" | 7.80" | 18.41" | 11.07" | 12.39" | 21.99" | 9.21" | 5.29" | 3.31" | 4.93" | 2.23" | 105.45" |
| Station Name | Feb 2015 | Mar 2015 | Apr 2015 | May 2015 | Jun 2015 | Jul 2015 | Aug 2015 | Sep 2015 | Oct 2015 | Nov 2015 | Dec 2015 | Jan 2016 | Feb- Jan |
|---|---|---|---|---|---|---|---|---|---|---|---|---|---|
| Chuuk | 7.25" | 8.32" | 12.47" | 11.30" | 11.66" | 11.98" | 12.86" | 11.71" | 11.51" | 10.61" | 11.25" | 10.10" | 136.77" |
| Guam NAS | 3.03" | 2.07" | 2.53" | 3.40" | 6.18" | 10.14" | 14.74" | 12.66" | 11.44" | 7.38" | 5.11" | 4.01" | 99.09" |
| Kapingamarangi | 9.27" | 11.43" | 13.64" | 12.08" | 13.78" | 14.15" | 8.13" | 9.93" | 8.19" | 9.27" | 9.84" | 9.15" | 145.85" |
| Koror | 8.56" | 7.44" | 7.32" | 11.83" | 17.48" | 18.53" | 13.50" | 11.77" | 11.84" | 11.39" | 11.16" | 10.18" | 152.90" |
| Kosrae | 12.93" | 16.06" | 17.51" | 17.75" | 14.64" | 14.91" | 14.22" | 14.22" | 10.94" | 13.83" | 16.11" | 16.67" | 213.87" |
| Kwajalein | 2.64" | 2.35" | 5.26" | 6.72" | 6.93" | 9.87" | 9.74" | 10.74" | 11.18" | 11.28" | 6.66" | 3.16" | 90.41" |
| Lukonor | 8.93" | 9.26" | 11.31" | 11.69" | 11.65" | 15.93" | 14.04" | 10.15" | 11.32" | 9.08" | 11.27" | 8.41" | 151.36" |
| Majuro | 6.88" | 6.58" | 9.42" | 10.11" | 11.01" | 11.17" | 11.69" | 11.17" | 12.73" | 13.44" | 11.39" | 7.74" | 125.25" |
| Pago Pago | 12.00" | 10.68" | 9.39" | 9.66" | 5.33" | 5.55" | 5.38" | 6.53" | 9.26" | 10.14" | 12.84" | 13.34" | 125.57" |
| Pohnpei | 9.55" | 13.17" | 18.41" | 19.96" | 14.81" | 15.43" | 14.26" | 12.55" | 15.27" | 14.83" | 16.08" | 13.18" | 182.36" |
| Saipan | 2.59" | 1.89" | 2.63" | 2.38" | 3.62" | 8.91" | 13.13" | 10.09" | 10.62" | 5.61" | 3.85" | 2.53" | 70.25" |
| Yap | 5.19" | 4.56" | 5.63" | 7.85" | 12.04" | 15.08" | 14.82" | 13.50" | 12.18" | 8.83" | 8.51" | 6.39" | 120.31" |


[top]
State/Regional/National Moisture Status
A detailed review of drought and moisture conditions is available for all contiguous U.S. states, the nine standard regions, and the nation (contiguous U.S.):
| northeast u. s. | east north central u. s. | central u. s. |
| southeast u. s. | west north central u. s. | south u. s. |
| southwest u. s. | northwest u. s. | west u. s. |
| Contiguous United States |
[top]
Contacts & Questions