|
Contents Of This Report: |
|
Please note that the values presented in this report are based on preliminary data. They will change when the final data are processed, but will not be replaced on these pages.
National Drought Overview
|
|
[top]
Detailed Drought Discussion
Overview
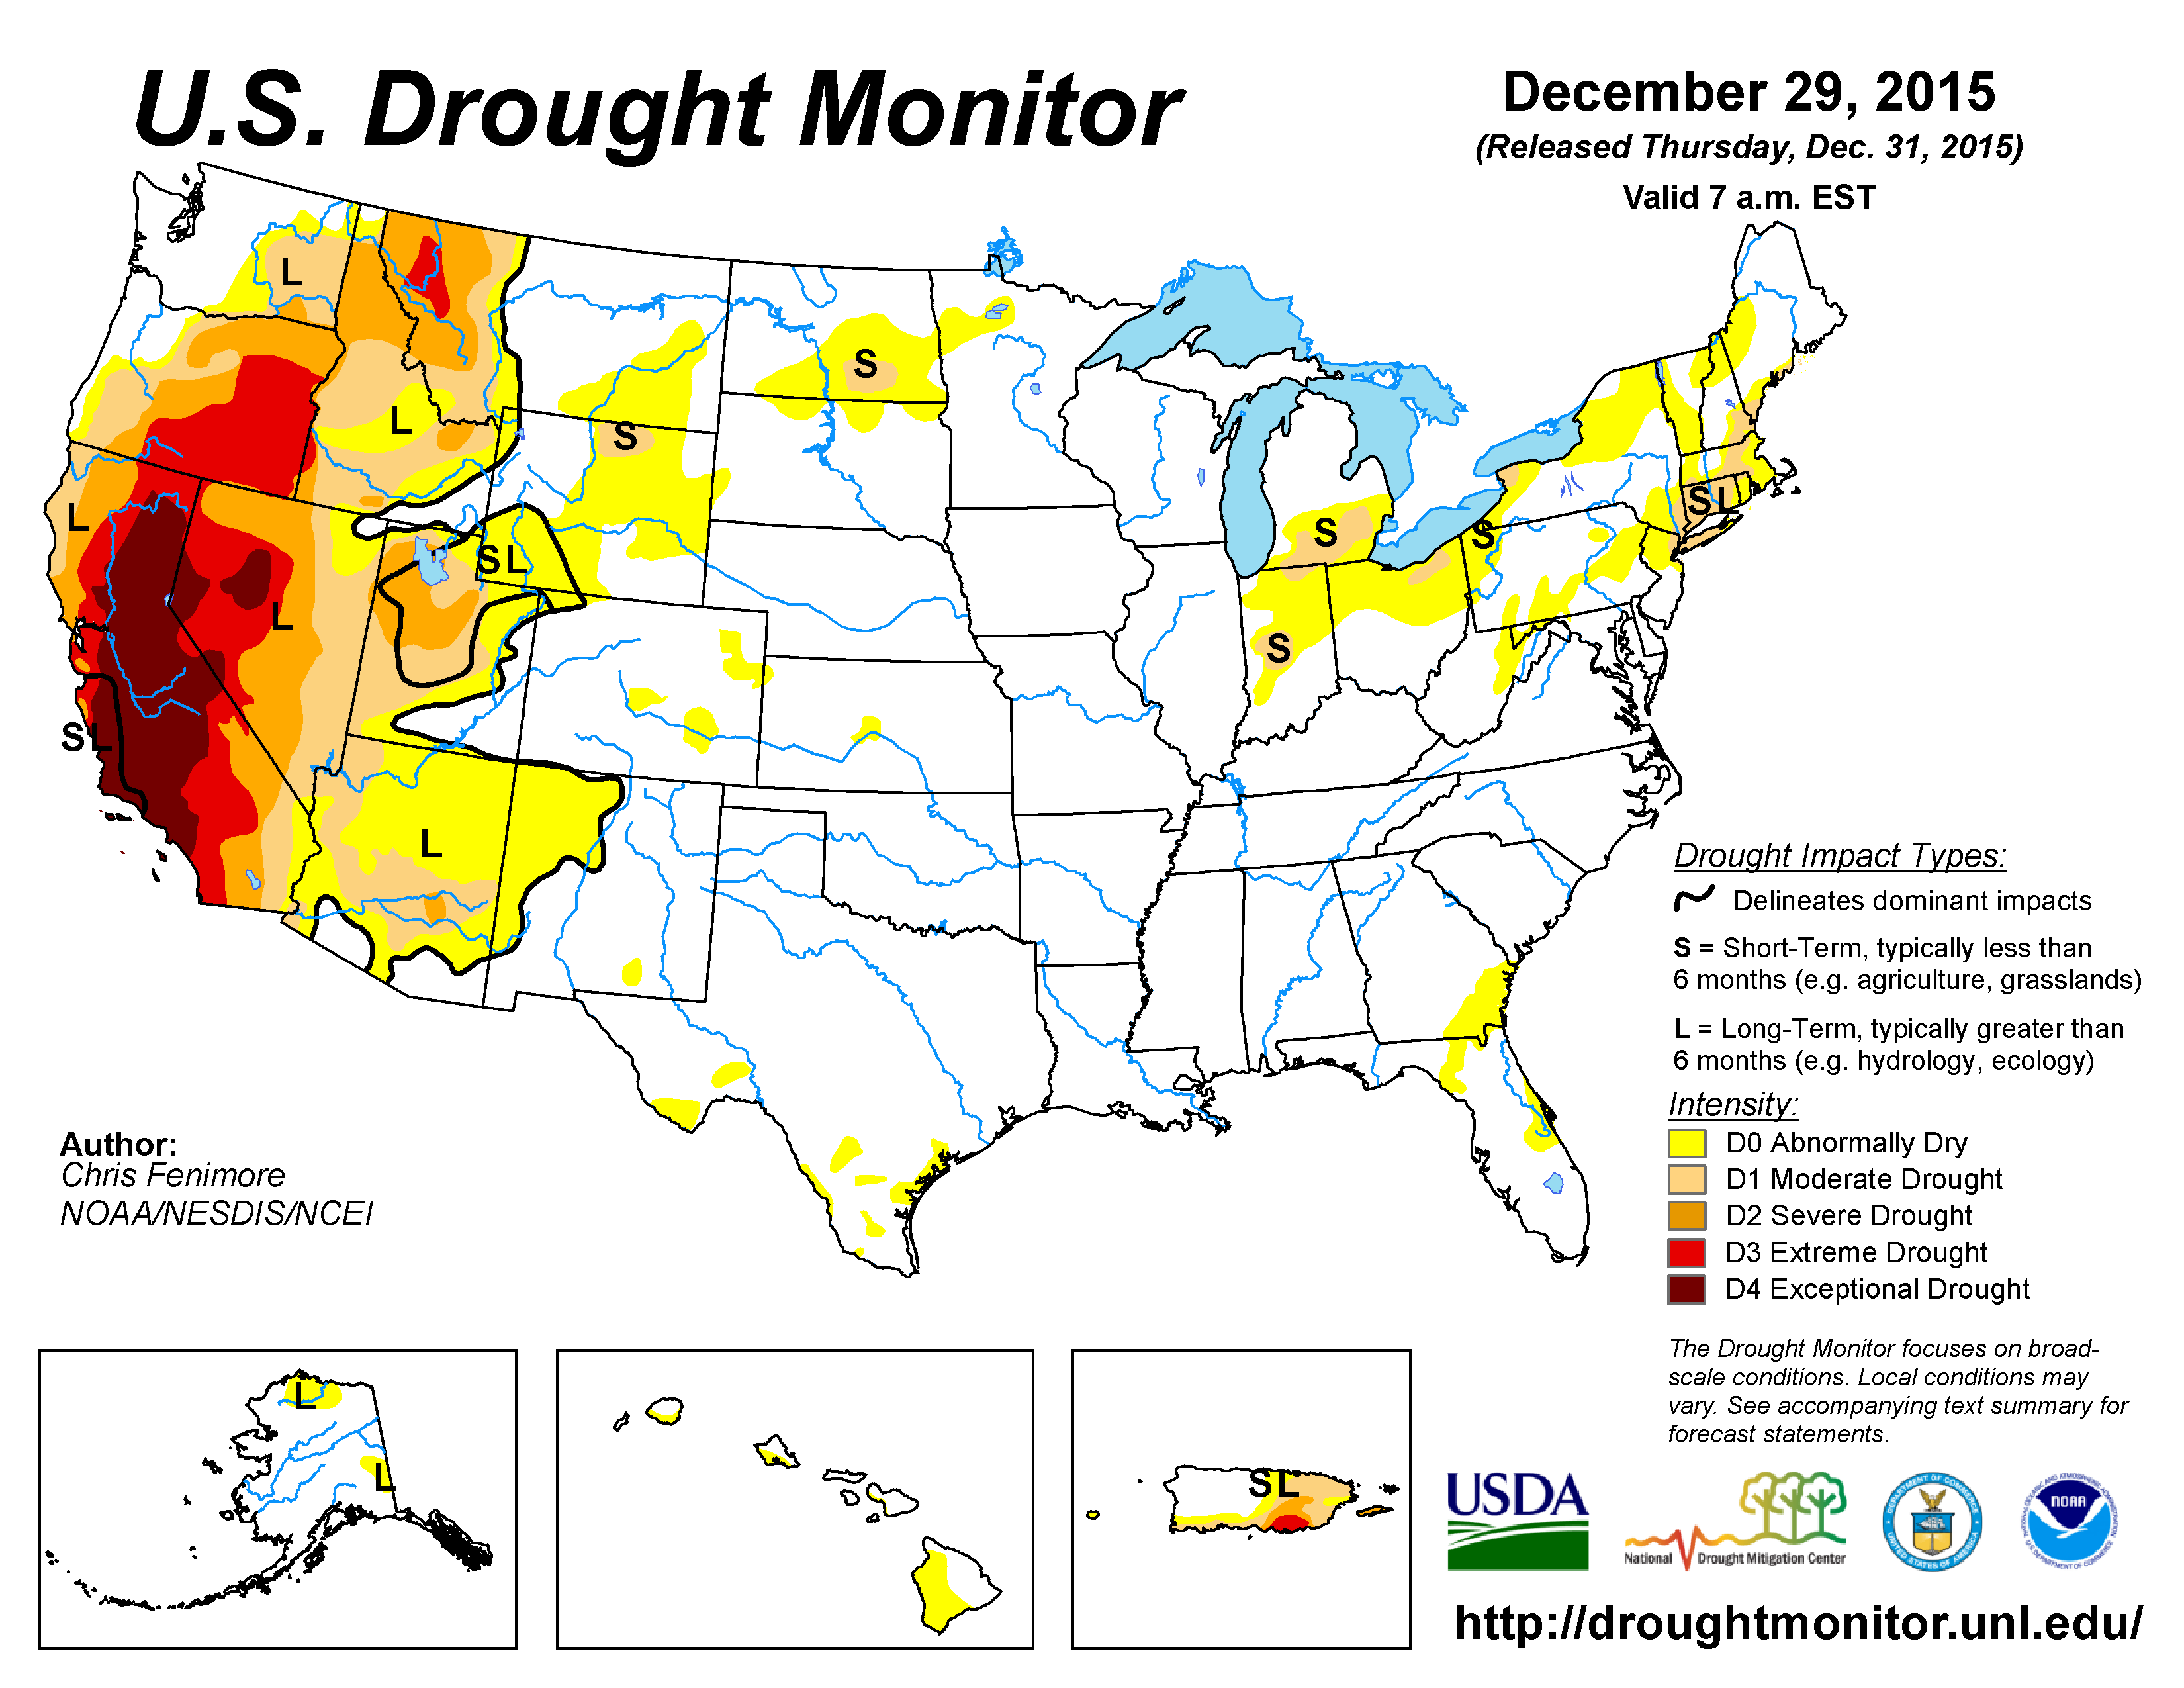
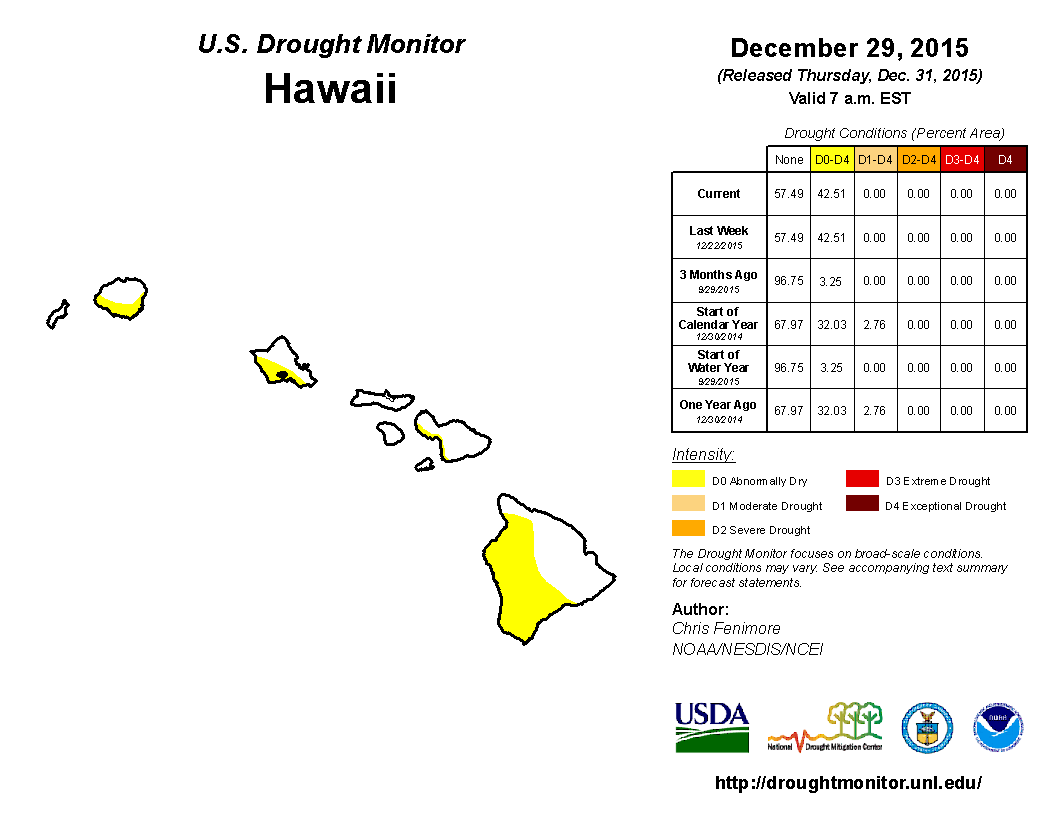
The U.S. Drought Monitor drought map valid December 29, 2015.
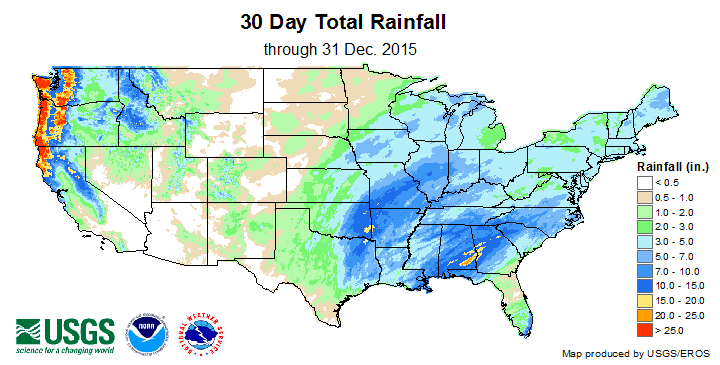
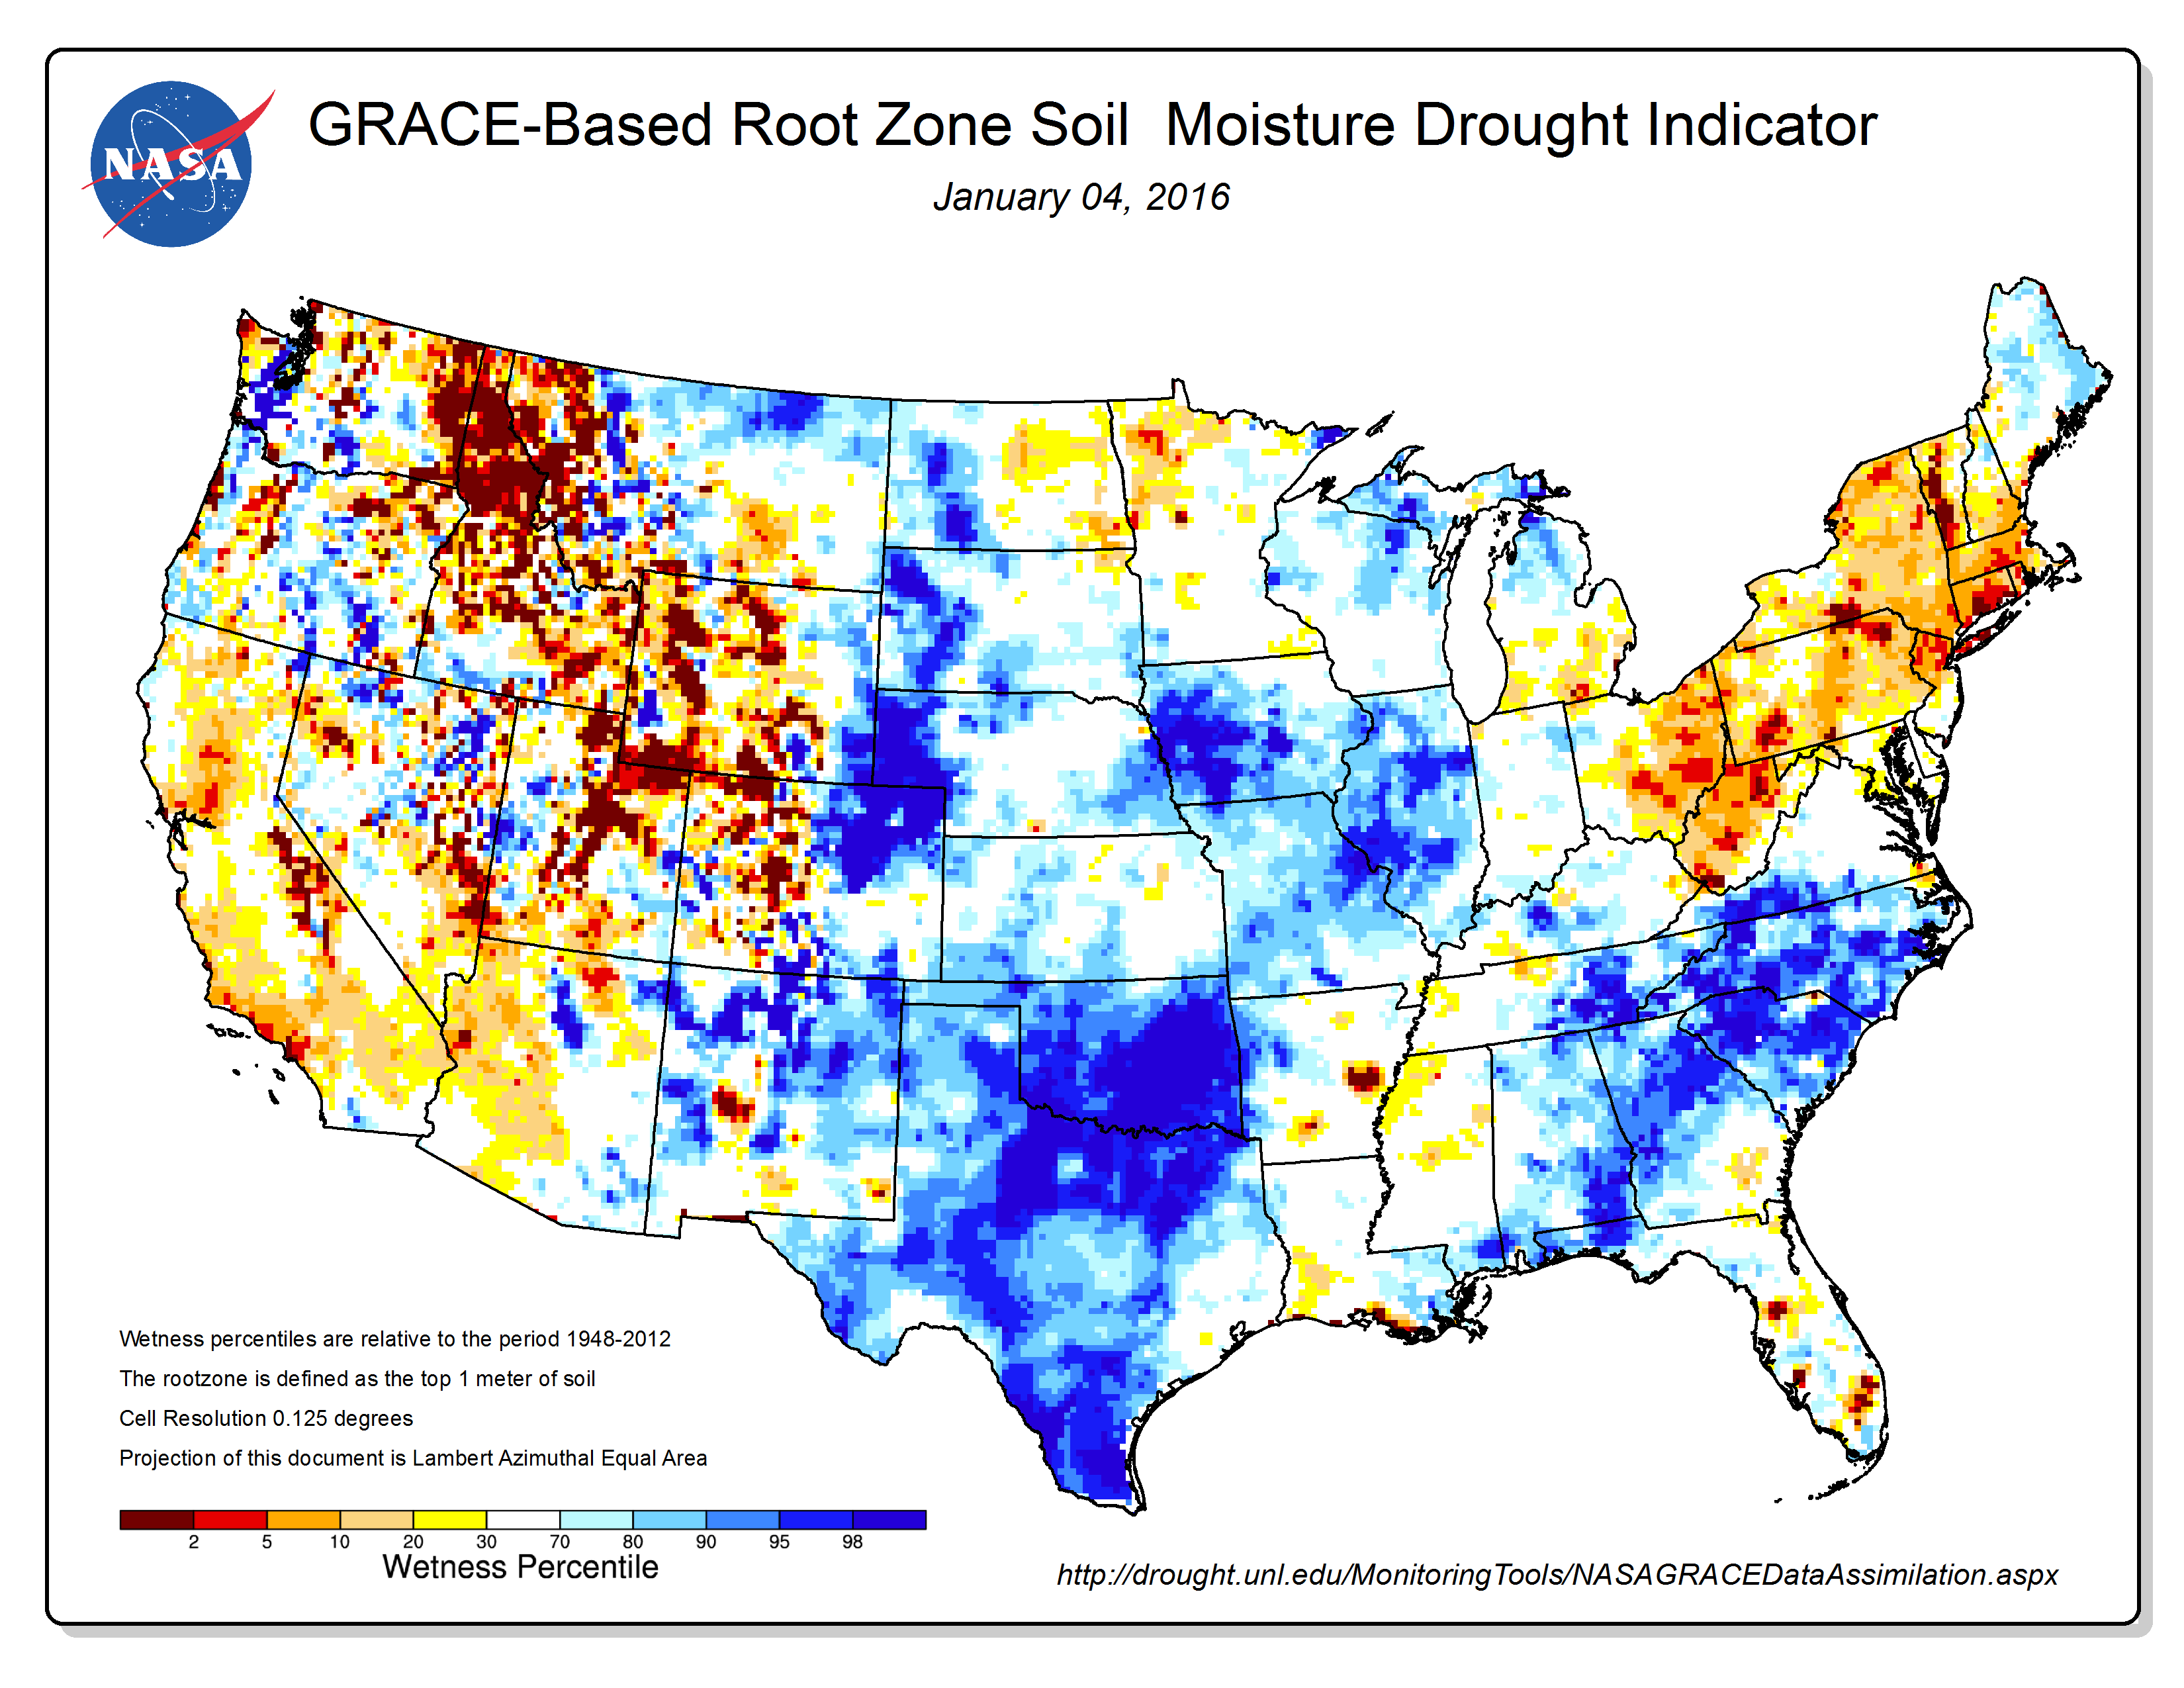
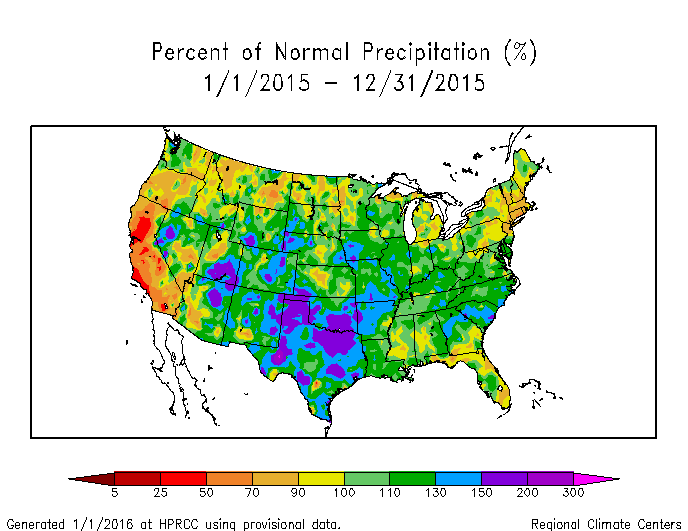
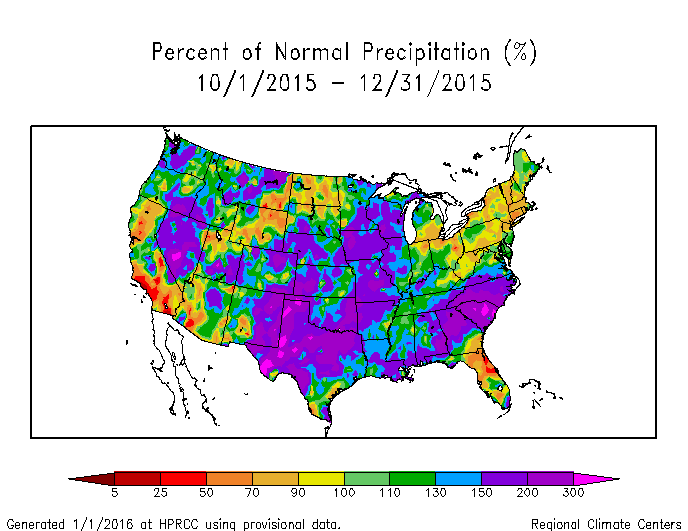
During December 2015, a strong El Niño pumped moisture and energy from the tropical Pacific Ocean into the atmosphere, invigorating the upper-level circulation in the mid-latitudes. Numerous weather systems in the jet stream flow brought above-normal precipitation to much of the CONUS, improving drought conditions in the Pacific Northwest, Plains, and Upper Midwest. Precipitation in northern to central California brought short-term relief, but was not enough to dent four years of drought. December was drier than normal across parts of the Southwest, southern Texas, Southeast, Central High Plains, and Northern High Plains. Drought and/or abnormal dryness expanded in the Big Horn region of northern Wyoming, where short- and long-term dryness has developed, and in parts of the Lower Great Lakes and Northeast. The precipitation anomaly pattern was mostly drier than normal in Puerto Rico, Alaska, and Hawaii, with drought and/or abnormal dryness expanding in parts of Hawaii and Puerto Rico. When integrated across the CONUS, December 2015 ranked as the wettest December in the 1895-2015 record, with the national drought footprint shrinking to 15.7 percent of the U.S. (18.7 percent of the CONUS). According to the Palmer Drought Index, which goes back to the beginning of the 20th century, about 6.8 percent of the CONUS was in moderate to extreme drought at the end of December, a decrease of about 5.2 percent compared to last month and the first time the national percentage has dropped below 10 percent since mid-2010.
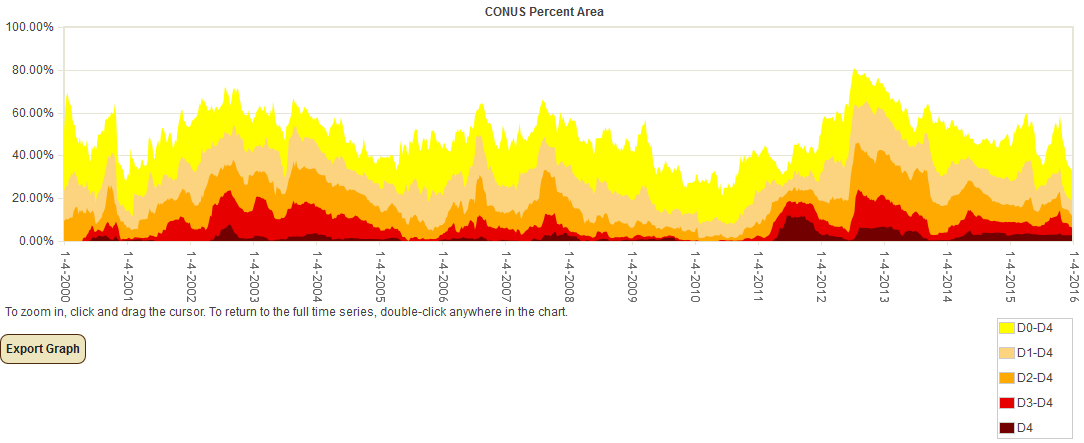
Percent area of the CONUS in moderate to exceptional drought, January 4, 2000 to present, based on the U.S. Drought Monitor.
Palmer Drought Index
The Palmer drought indices measure the balance between moisture demand (evapotranspiration driven by temperature) and moisture supply (precipitation). The Palmer Z Index depicts moisture conditions for the current month, while the Palmer Hydrological Drought Index (PHDI) and Palmer Drought Severity Index (PDSI) depict the current month's cumulative moisture conditions integrated over the last several months. While both the PDSI and PHDI indices show long-term moisture conditions, the PDSI depicts meteorological drought while the PHDI depicts hydrological drought. The PDSI map shows less severe and extensive drought in parts of the West than the PHDI map because the meteorological conditions that produce drought and wet spell conditions are not as long-lasting as the hydrological impacts.
|
 |
Used together, the Palmer Z Index and PHDI maps show that short-term dry conditions occurred over parts of the Southwest, southern Texas, and Southeast, resulting in developing long-term dry conditions over parts of Florida and southern Georgia in December compared to November. Short-term wet conditions resulted in the elimination of the remaining patchy long-term drought in the northern Great Lakes and reduction of long-term drought in much of the West, especially the Pacific Northwest. Short-term wet conditions in the central and southeastern parts of the CONUS intensified the long-term wet conditions.
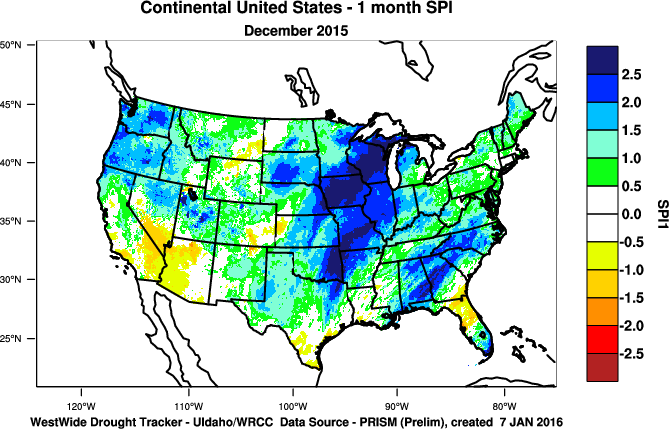
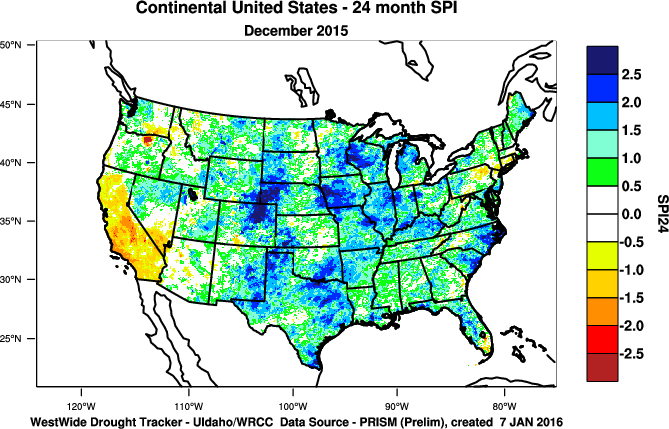
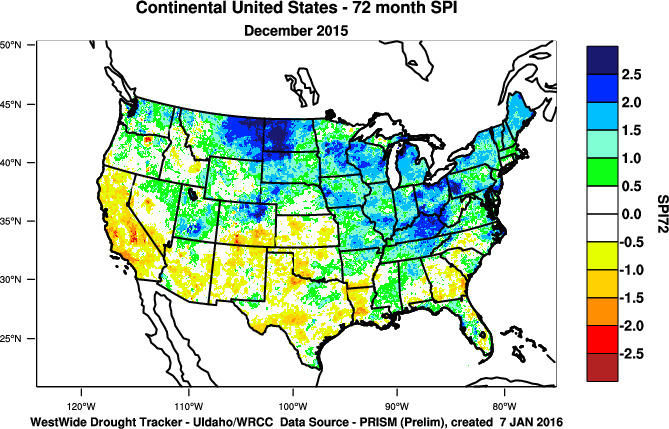
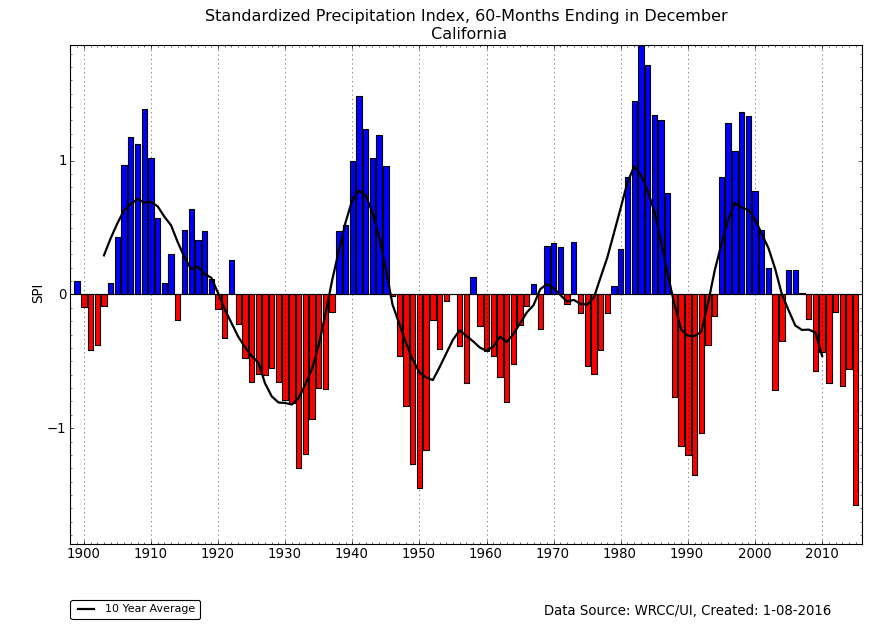
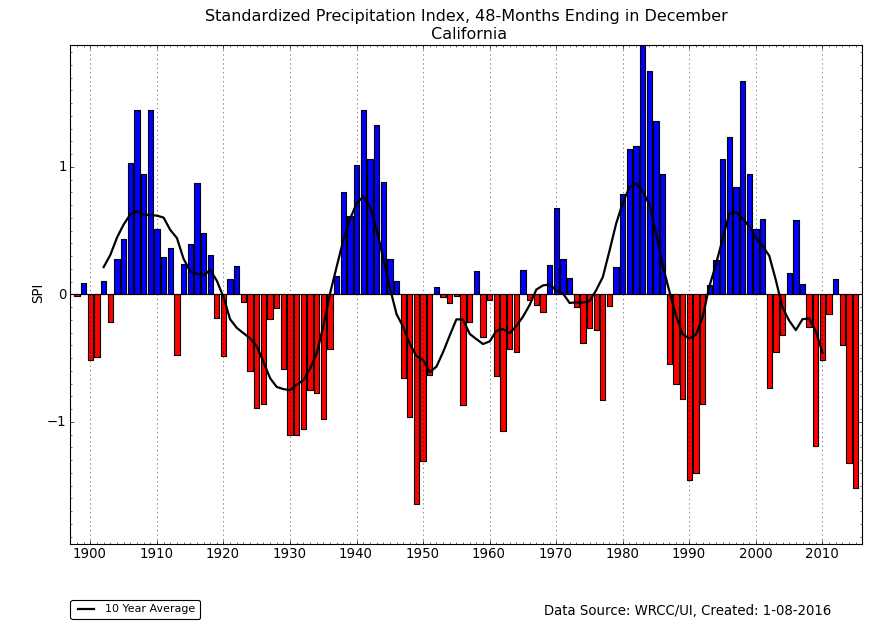
Standardized Precipitation Index
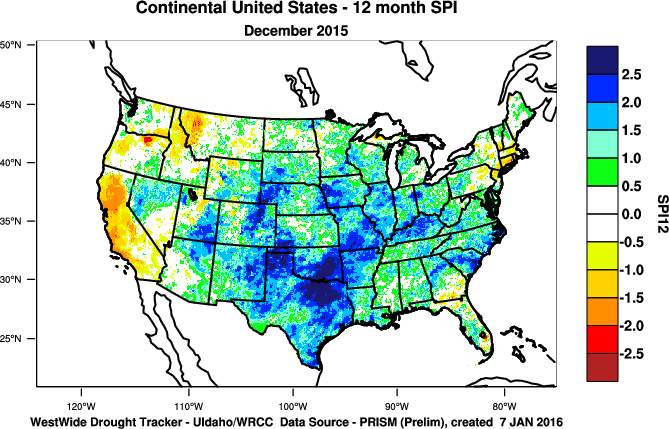
The Standardized Precipitation Index (SPI) measures moisture supply. The SPI maps here show the spatial extent of anomalously wet and dry areas at time scales ranging from 1 month to 24 months.
 |
 |
 |
The SPI maps illustrate how moisture conditions have varied considerably through time and space over the last two years. Dryness in parts of the Southwest, southern Texas, and Florida is evident on the 1-month SPI map, but wetness dominates. Hints of dryness continue in Florida at 3 months and in the Southwest at the 2- through 9-month time scales, with significant dryness across California evident at 12 to 24 months. The wet conditions in the Pacific Northwest and Northern Rockies of the last couple months were not enough to completely eliminate the dryness, which is still noticeable at 9 and 12 months. Parts of the northern Plains, from the Big Horns of Wyoming to North Dakota, show up dry at the 2- to 6-month time scales. Parts of southern New England and the Northeast show up dry consistently from the 2- to 24-month time scales. Otherwise, wet conditions largely dominate the maps.
 |
 |
 |
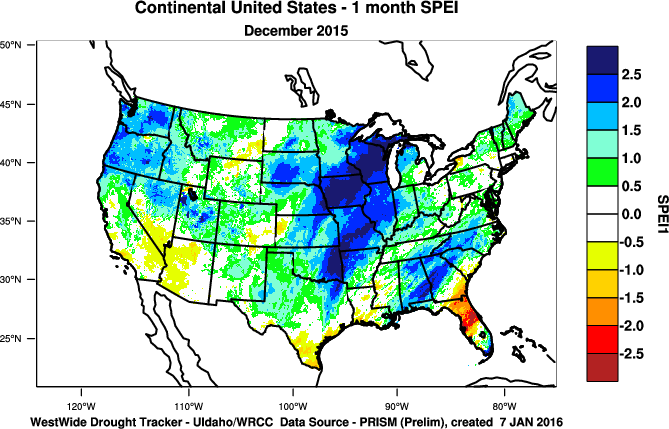
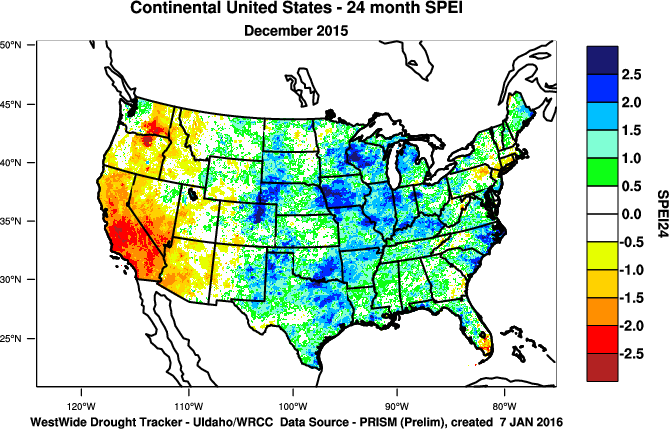
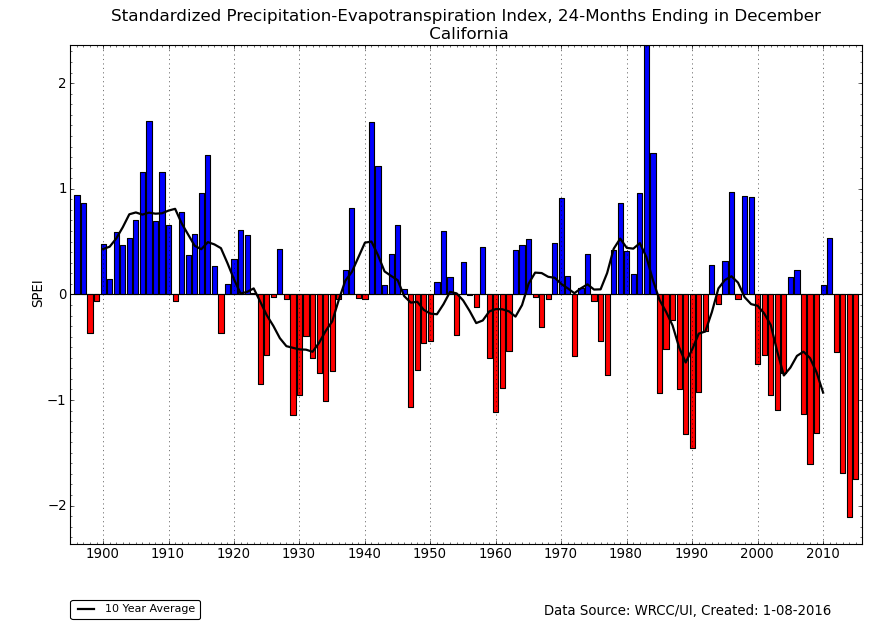
Standardized Precipitation Evapotranspiration Index
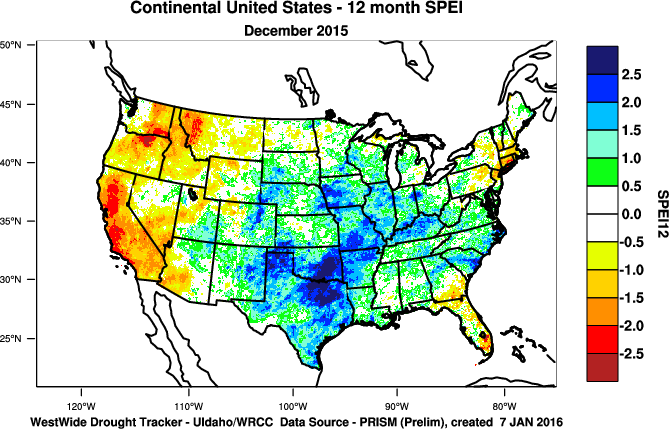
The SPI measures water supply (precipitation), while the SPEI (Standardized Precipitation Evapotranspiration Index) measures the combination of water supply (precipitation) and water demand (evapotranspiration as computed from temperature). Warmer temperatures tend to increase evapotranspiration, which generally makes droughts more intense.
 |
 |
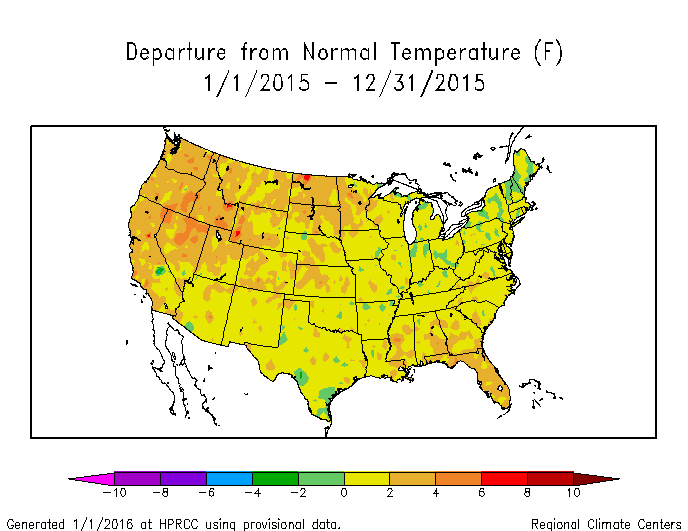
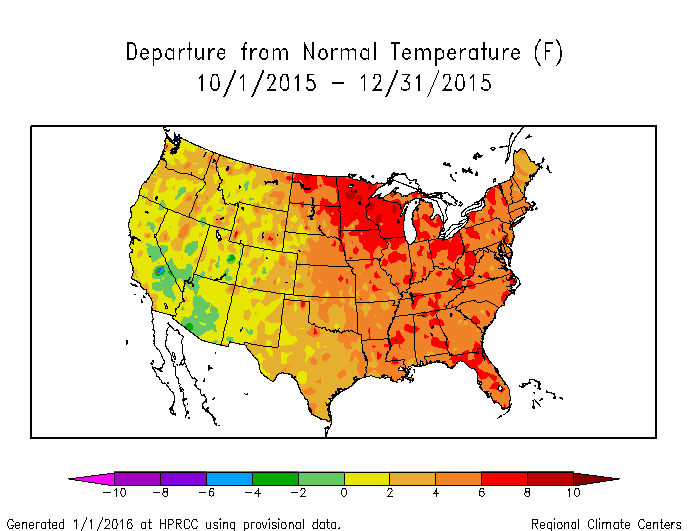
During December 2015, temperatures were much above normal across the CONUS east of the Rockies, and near normal across the West. In fact, 29 states had a record warm December. If December had been dry, as in parts of Florida, the warmer-than-normal temperatures would amplify the dry conditions, as seen when comparing the 1-month SPEI to the SPI. The near-normal temperatures in the Southwest resulted in the SPEI having similar values to the SPI there. But December 2015 was wetter than normal across much of the CONUS, and this resulted in similar 1-month SPEI and SPI values in most areas.
For the year as a whole, much of the country was wetter than normal but parts of the West, especially California, were drier than normal. The unusually warmer-than-normal annual temperatures in the West (California had the second warmest year on record) amplified the drought conditions as seen in the 12-month SPEI compared to the SPI.
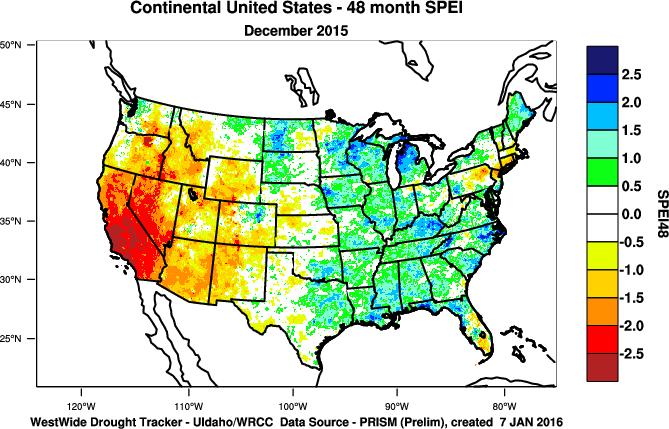
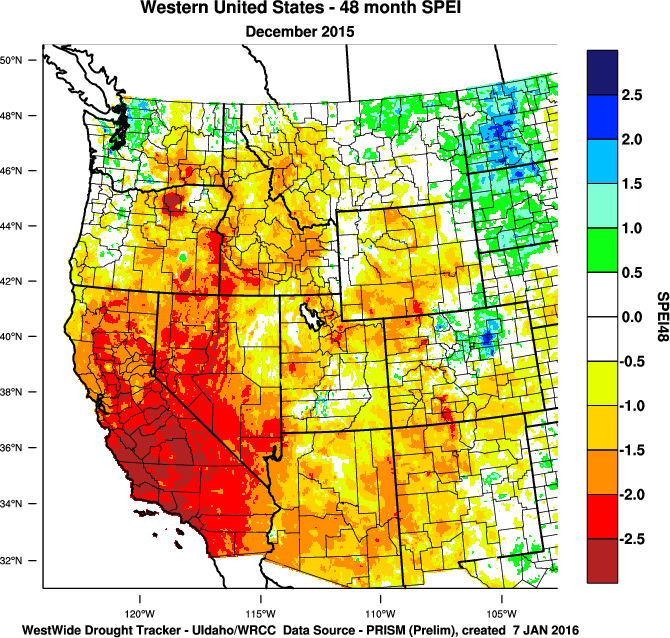
48-month SPEI for current month.
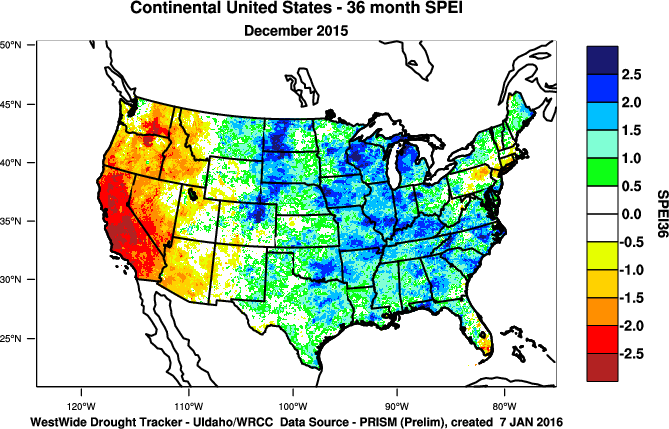
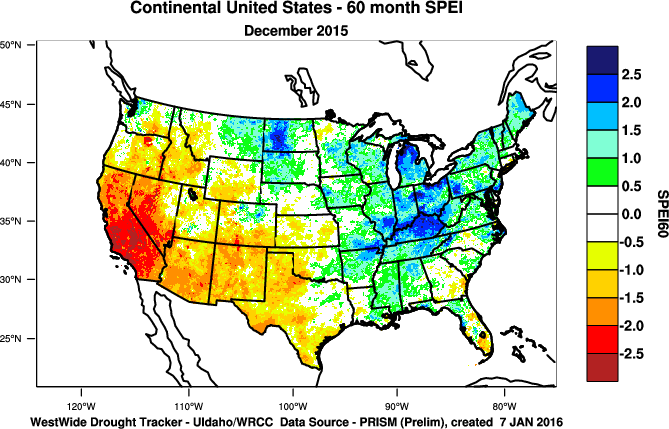
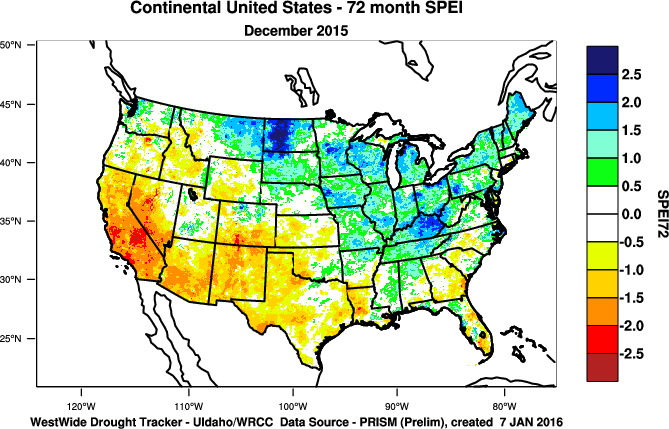
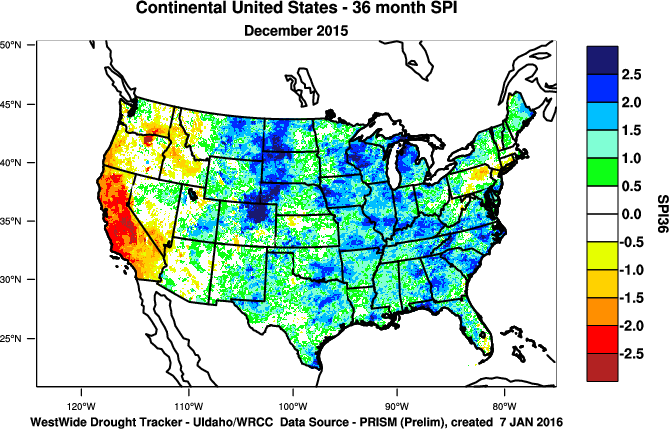
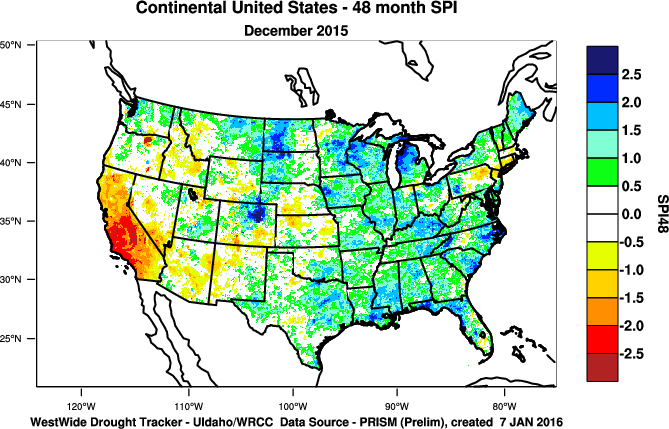
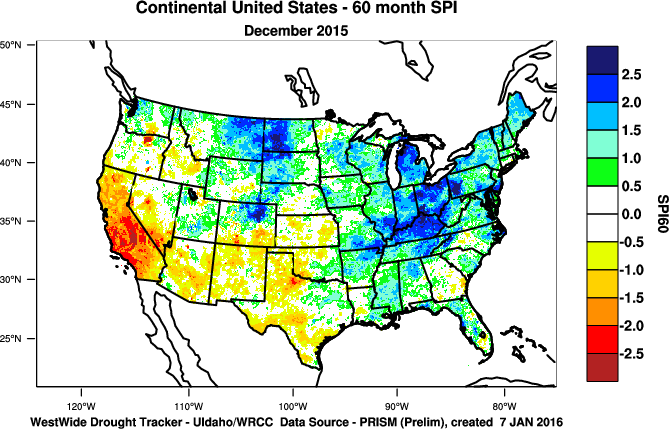
The persistent above-normal temperatures in the West have resulted in more severe SPEI values, compared to the SPI, for much of the last six years (SPEI maps for the last 12, 24, 36, 48, 60, 72 months) (SPI maps for the last 12, 24, 36, 48, 60, 72 months). The excessive heat has exacerbated drought conditions.
This is especially the case in California, where the last two years ranked as the warmest and second warmest such periods in the 1895-2015 record, and both were much warmer than all of the years before them. The last four years have been much warmer than average, and the last two years cap a period of persistent unusual warmth which has lasted over three decades. The precipitation of recent months helped raise California's statewide precipitation rank to 13th driest for 2015. But the persistent dryness over the last nine years still gave the state the driest SPI for the last 36 and 60 months, and second driest SPI for the last 48 months. When the temperature is factored in, California has had the most severe SPEI for the last 36, 48, 60, and 72 months, and second most severe SPEI for the last 12 and 24 months.
 |
 |
Regional Discussion
 |
 |
CONUS Agricultural & Hydrological Impacts:
Improving drought conditions were reflected in numerous agricultural, hydrological, and other meteorological indicators, both observed and modeled. As of January 5th, 10 percent of the nation's hay, 12 percent of the cattle inventory and winter wheat production, and less than one percent of soybean production and corn production were in drought. These are all decreases compared to a month ago.
Drought conditions at the end of the month, as depicted on the December 29th USDM map, included the following CONUS core drought and abnormally dry areas:
- Moderate (D1) to severe (D2) drought covered a large part of the western U.S., with extreme (D3) to exceptional (D4) drought extending from California and Nevada into the Pacific Northwest and Northern Rockies. —
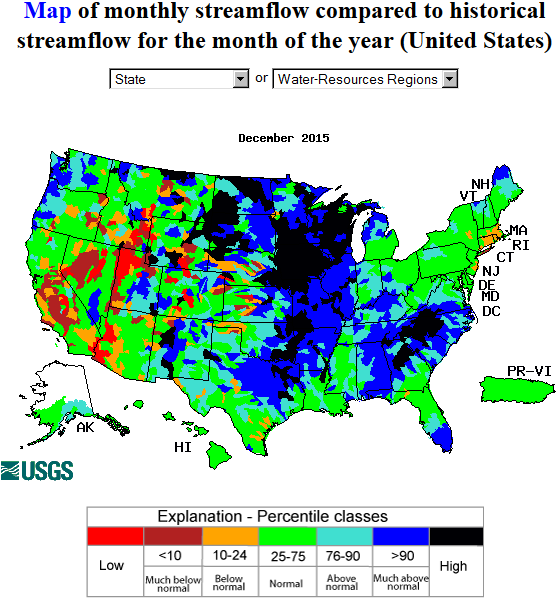
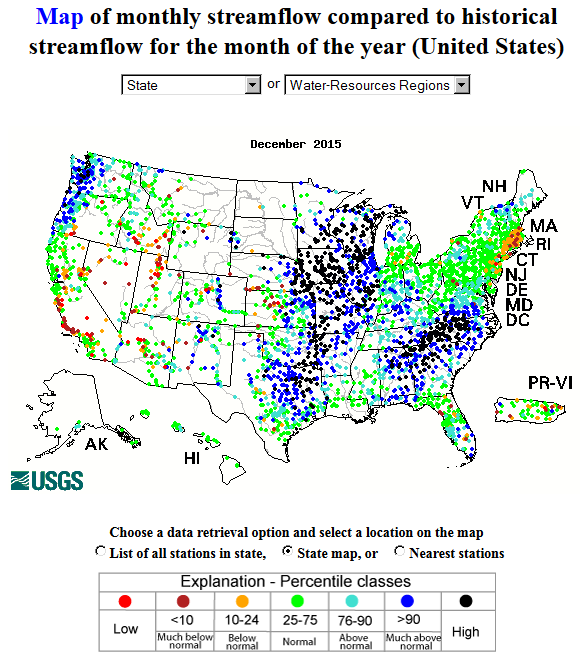
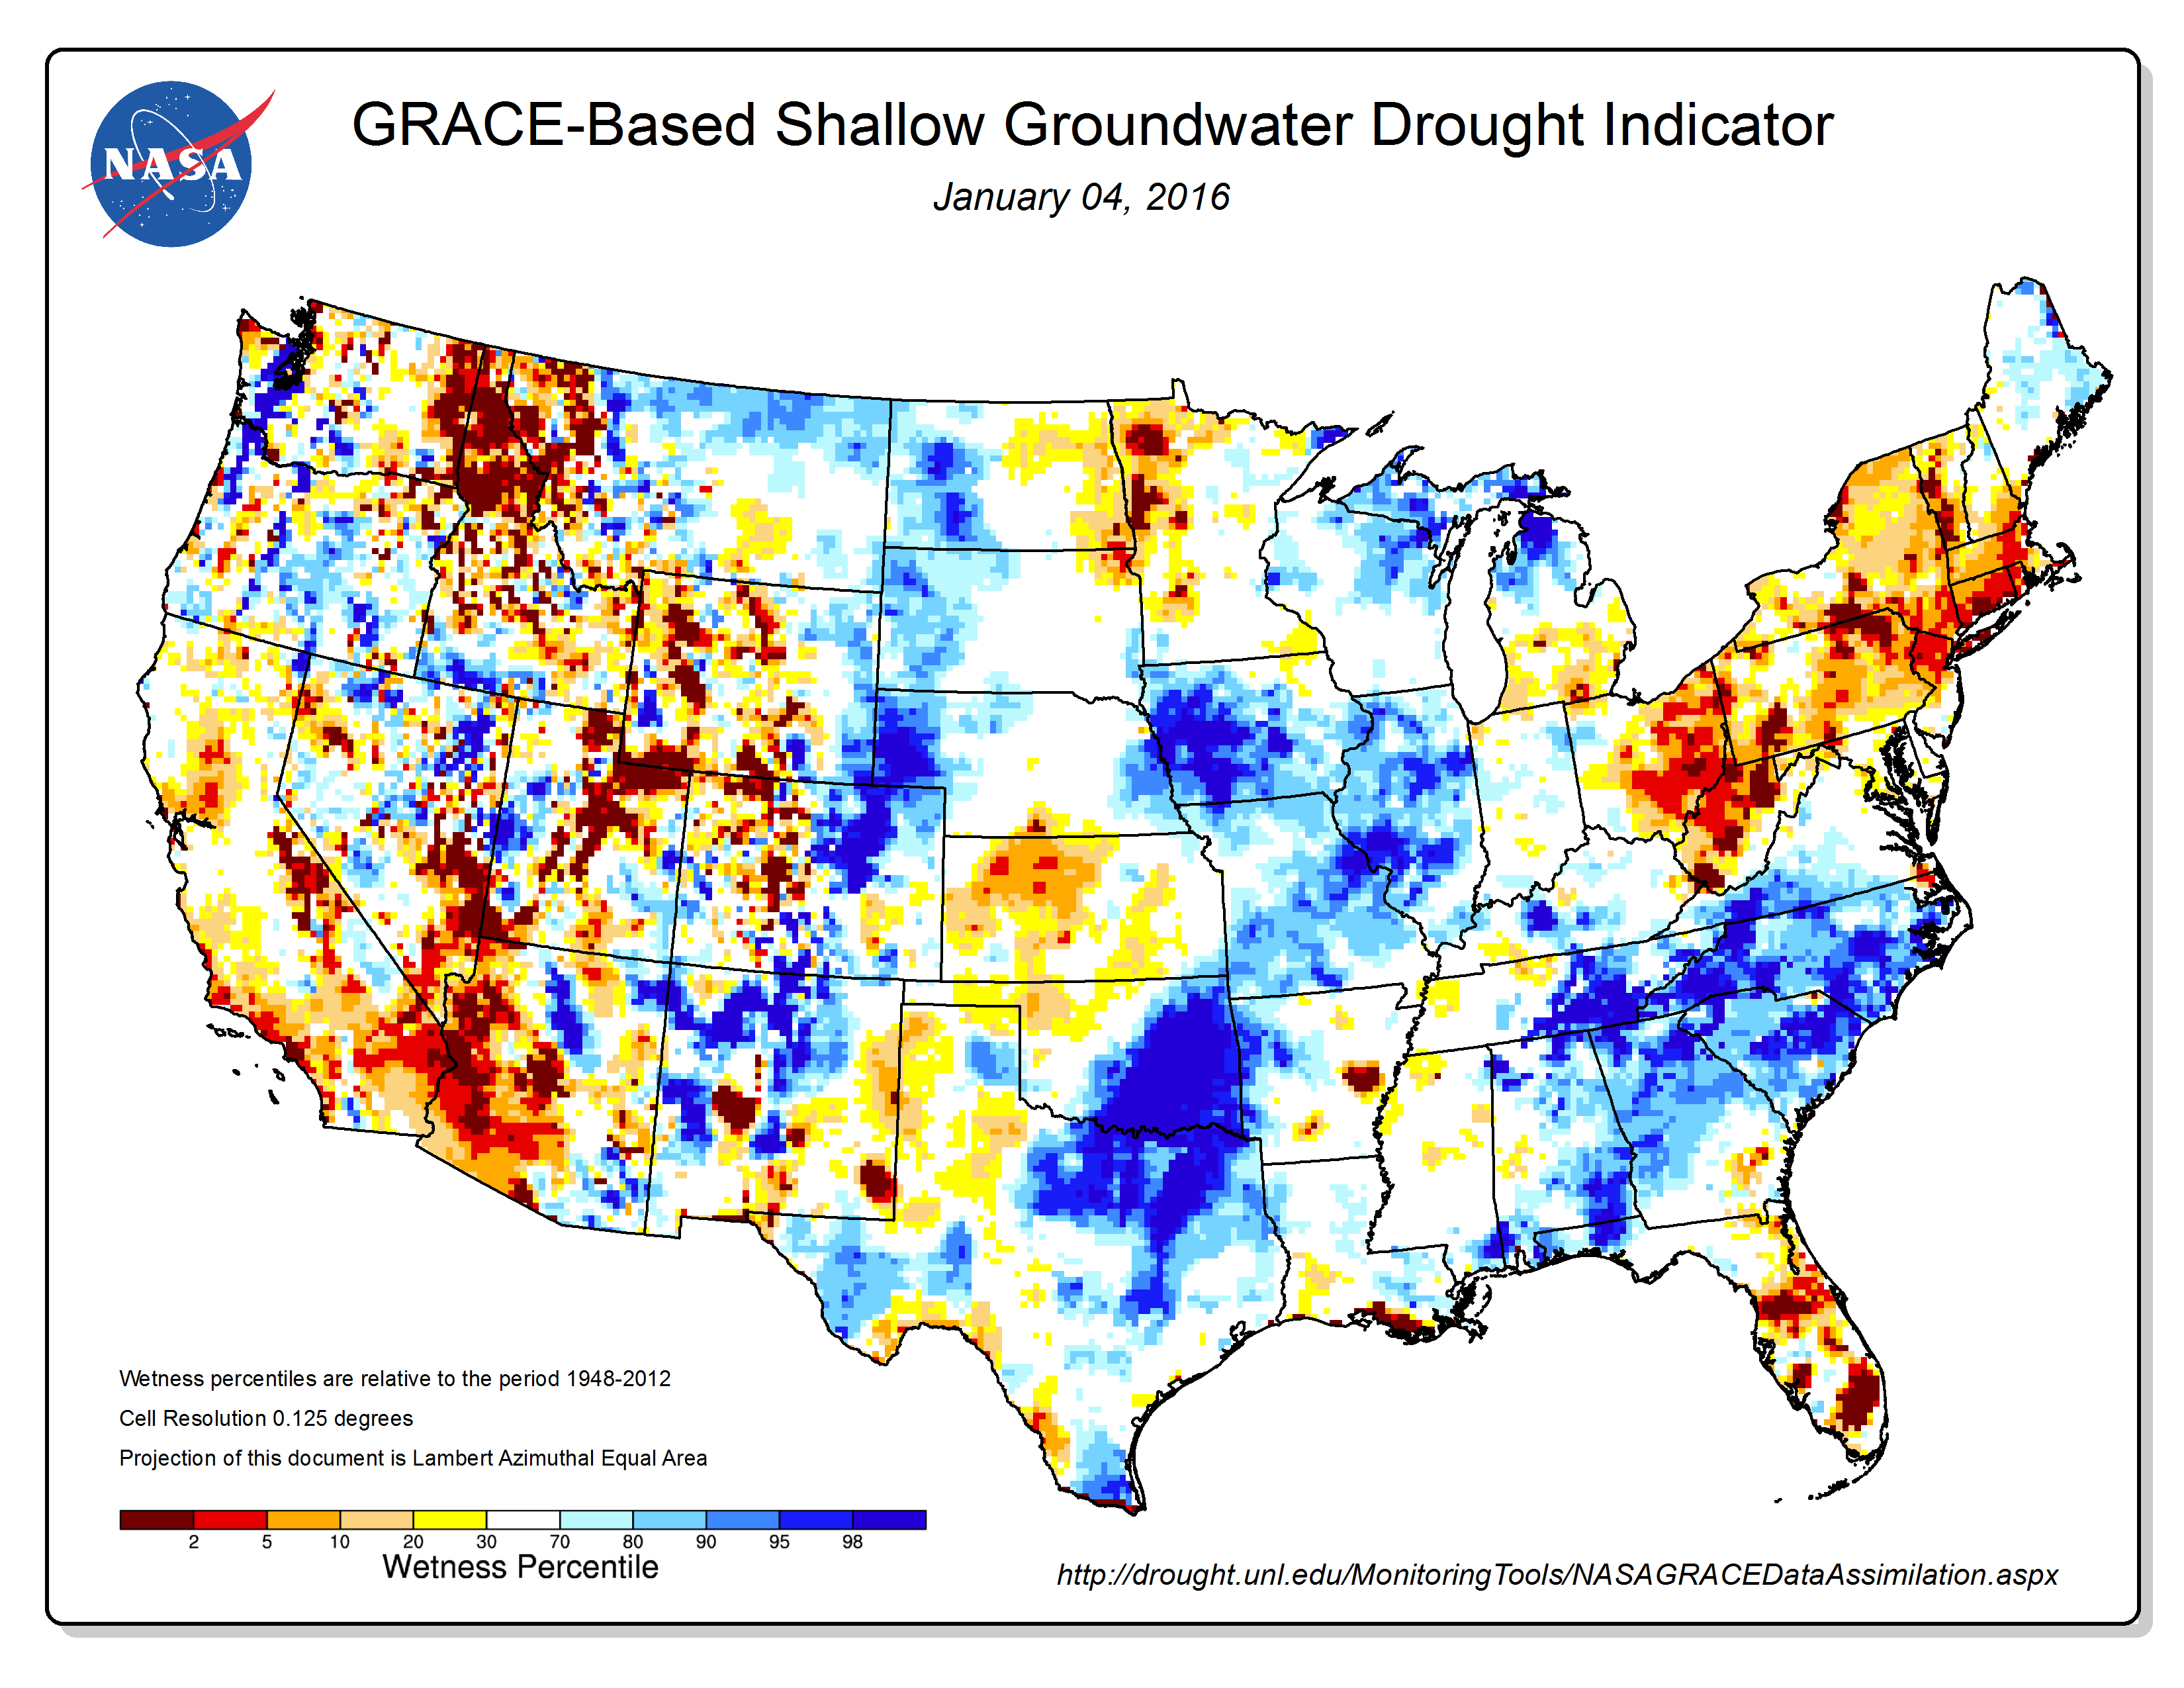
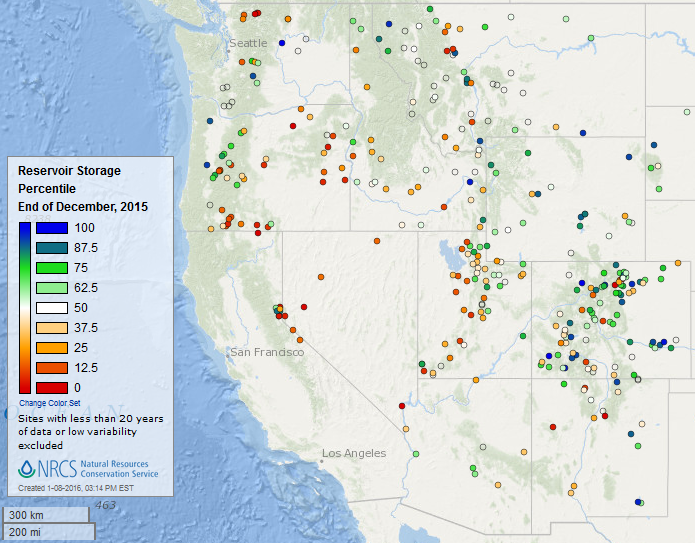
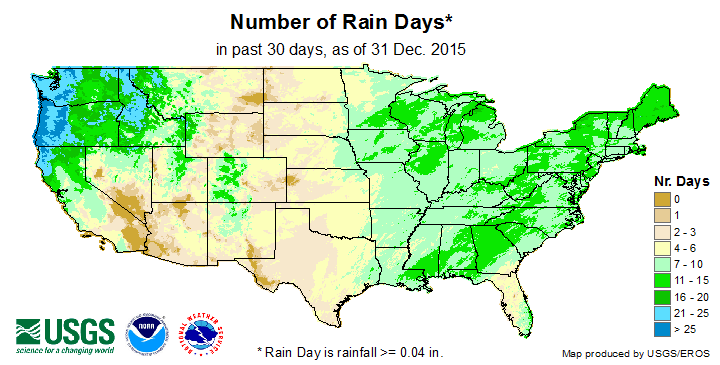
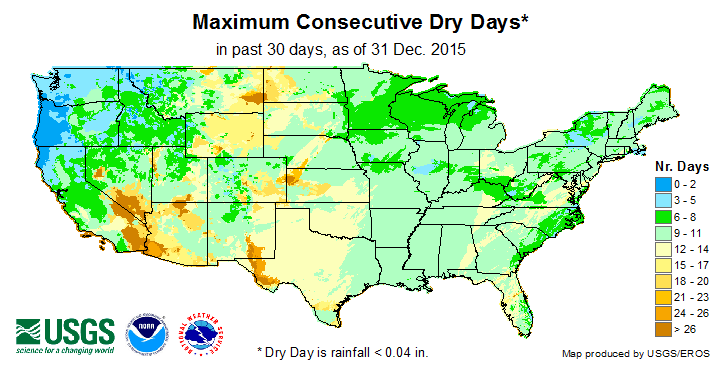
- Even though the heavy December precipitation improved soil moisture and streamflow in the Pacific Northwest, and the mountain snowpack improved across much of the West, low streamflow and soil moisture still remained in places, groundwater continued below normal, and some reservoirs were still below average, especially in California. Dryness in the Southwest and the Big Horn area of Wyoming was evident in few days with precipitation, long runs of consecutive dry days, and low soil moisture indicators, and (for the Southwest) in streamflow and groundwater indicators. Mountain snowpack in the Big Horns was very low.
- Pockets of abnormally dry to moderate drought conditions lingered in parts of the Midwest and Northern Plains. —
- Dryness in the Northern Plains was evident in few days with precipitation, long runs of consecutive dry days indicators. Parts of the Northern Plains and Midwest had low soil moisture and groundwater indicators.
- Abnormally dry to moderate drought conditions continued in parts of the Northeast. —
- Low soil moisture, groundwater, and streamflow levels were evident in parts of the Northeast.
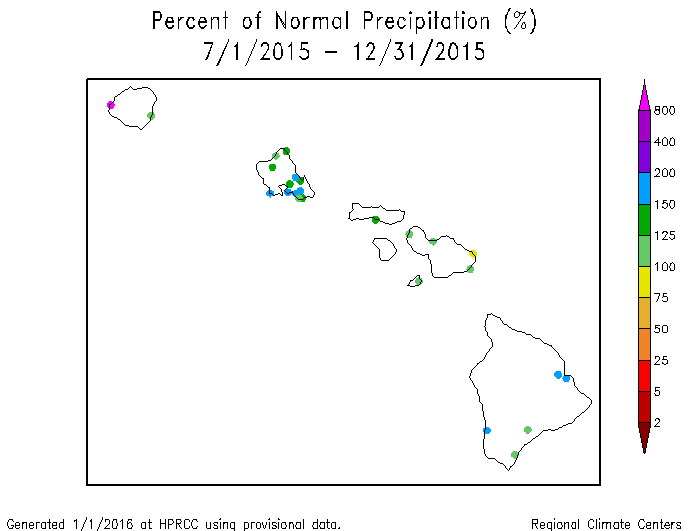
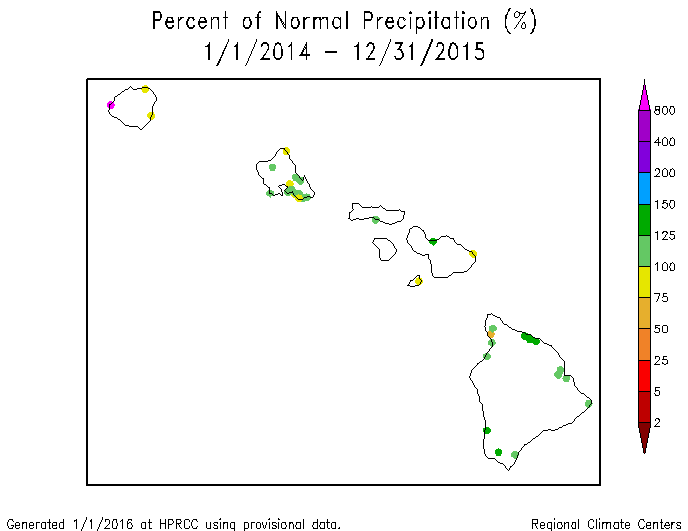
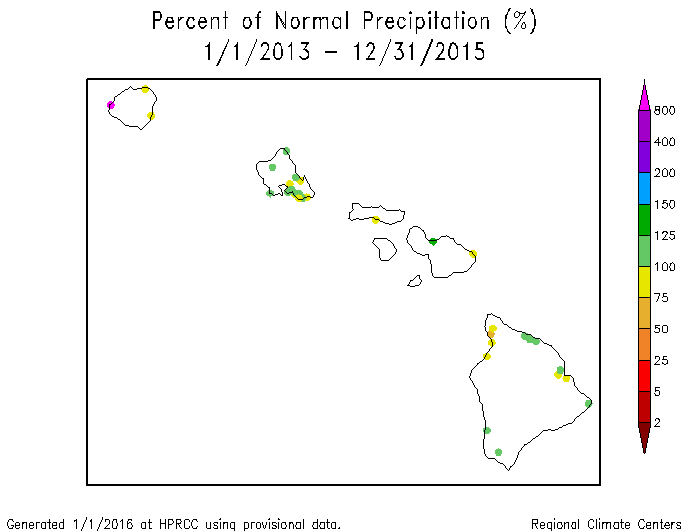
Hawaii: December 2015 was drier than normal at most of the stations across Hawaii. This is in contrast to wet conditions during the previous couple months, resulting in a mixed precipitation anomaly pattern at the 2- and 3-month time scales. A wetter-than-normal anomaly pattern dominated at the 6- and 9-month time scales, with a mixed pattern resurfacing at the longer time scales (last 12, 24, and 36 months). There was no drought on the December 29th USDM map, but about 43 percent of the state was classified as abnormally dry.
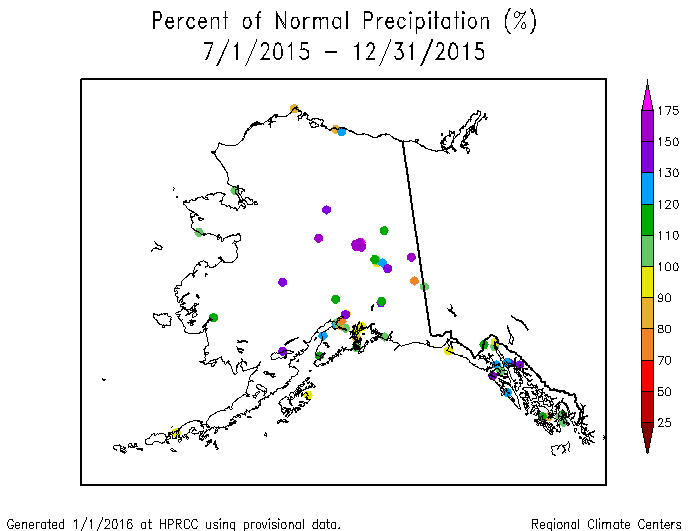
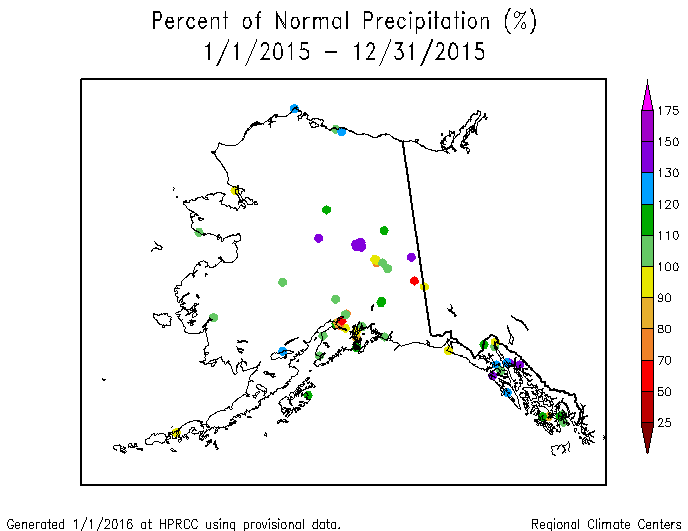
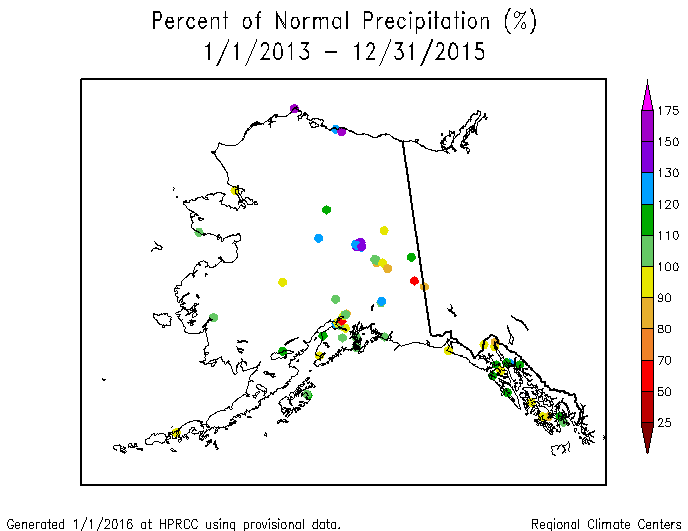
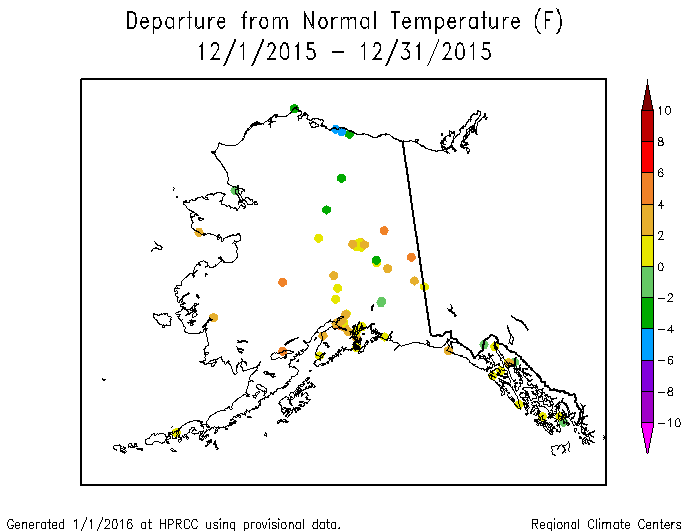
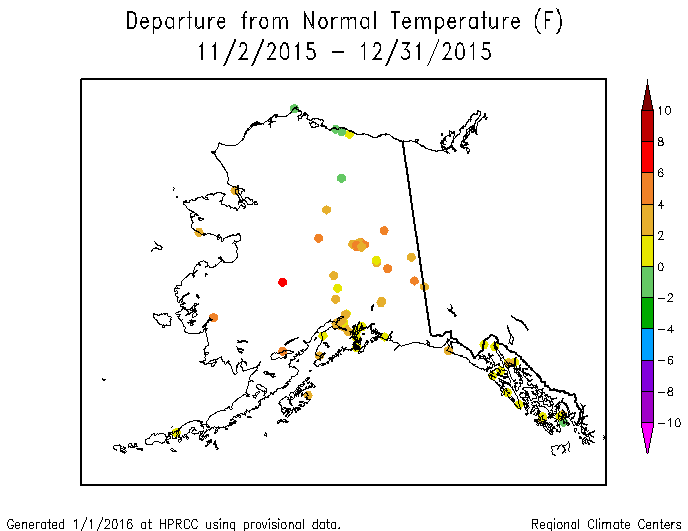
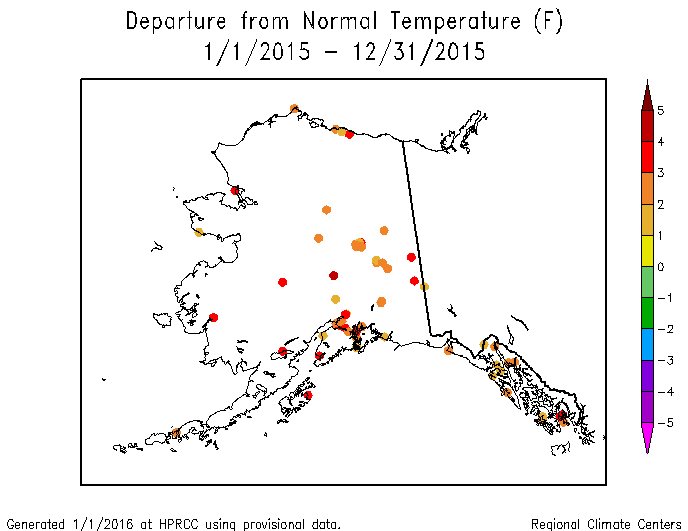
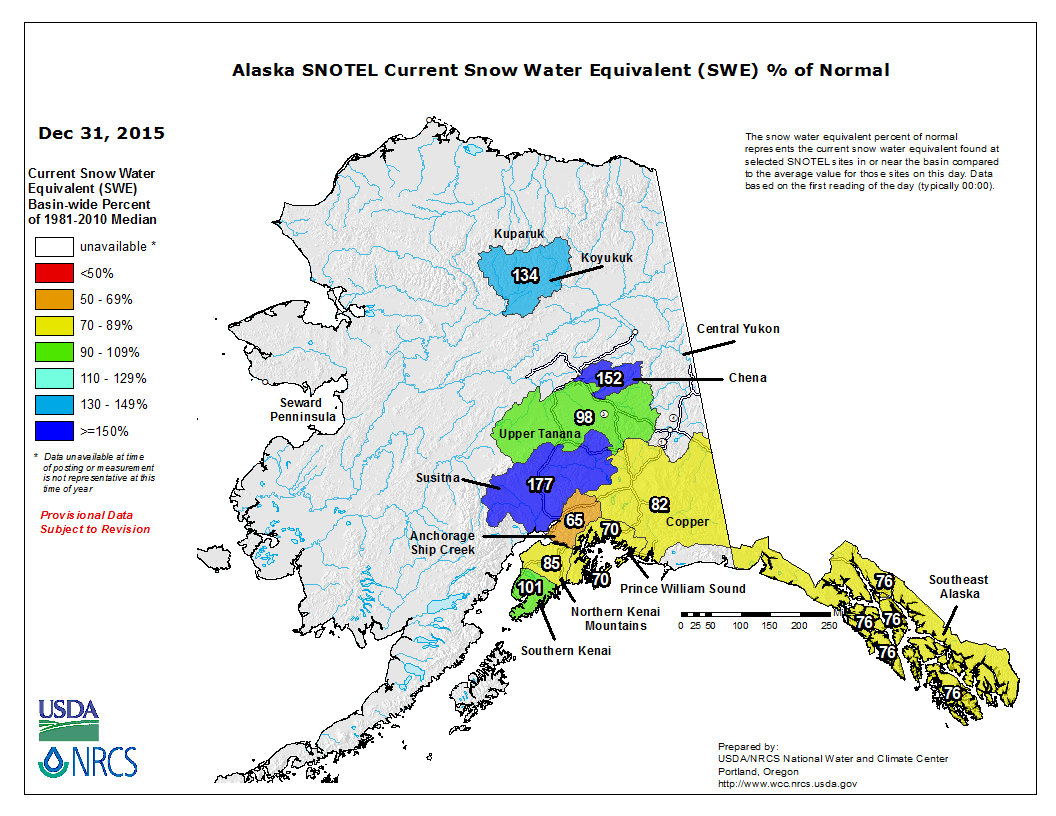
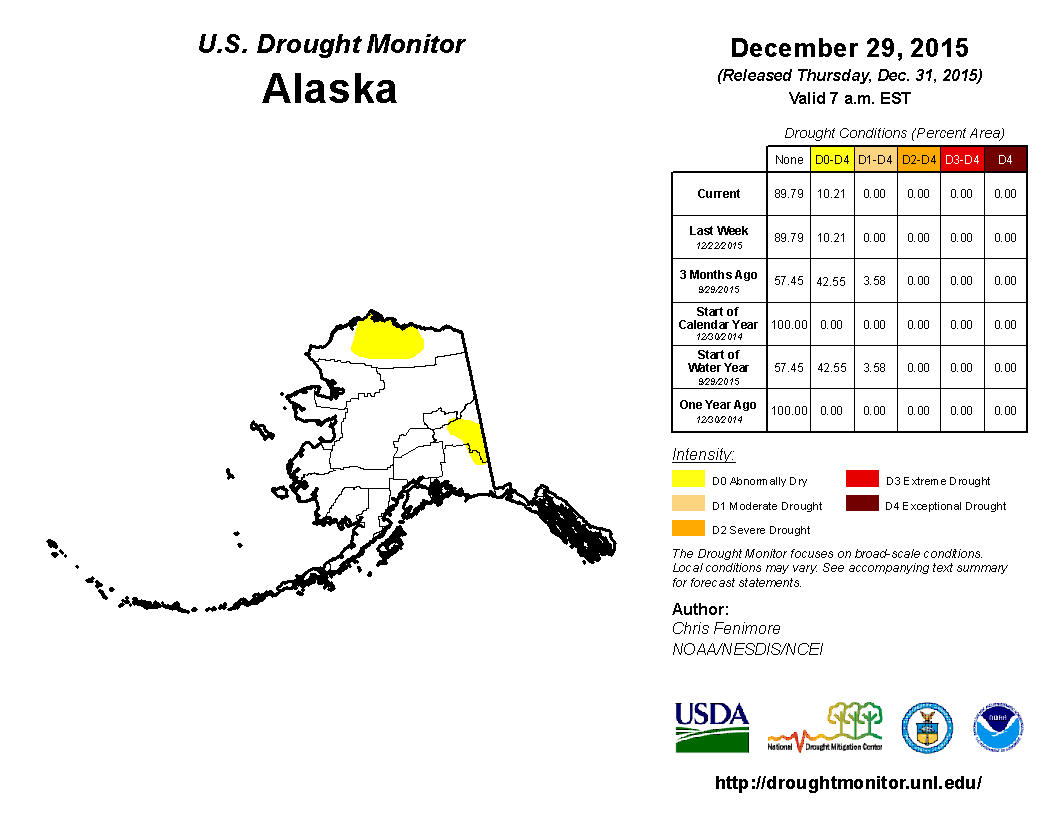
Alaska: A drier-than-normal precipitation pattern dominated Alaska during December, which is in contrast to the wetter pattern of the previous months (station maps for December and the last 2, 3, 6, 9, 12 months) (climate division maps for December and the last 3, 6, 12 months). A mixed precipitation anomaly pattern is evident at longer time scales (last 24 and 36 months). Northern Alaska was cooler than normal in December, but the southern and western portions were warmer than normal. A warmer-than-normal pattern dominates at longer time scales on both the climate division (last 3, 6, 12 months) and station (last 2, 3, 12 months) analyses. Snowpack water content was above normal at the northern and interior locations and below normal in the southern locations. Abnormal dryness continued across 10.2 percent of the state on the December 29th USDM map.
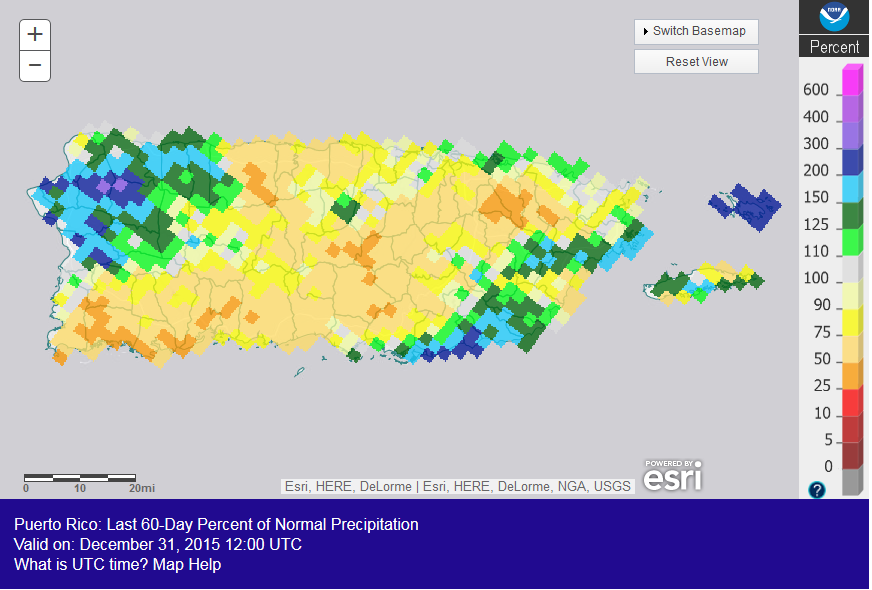
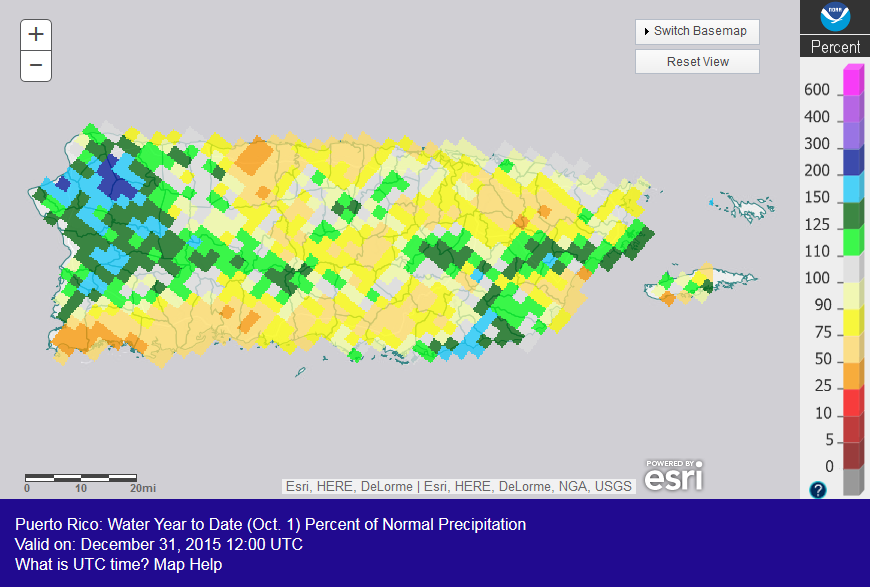
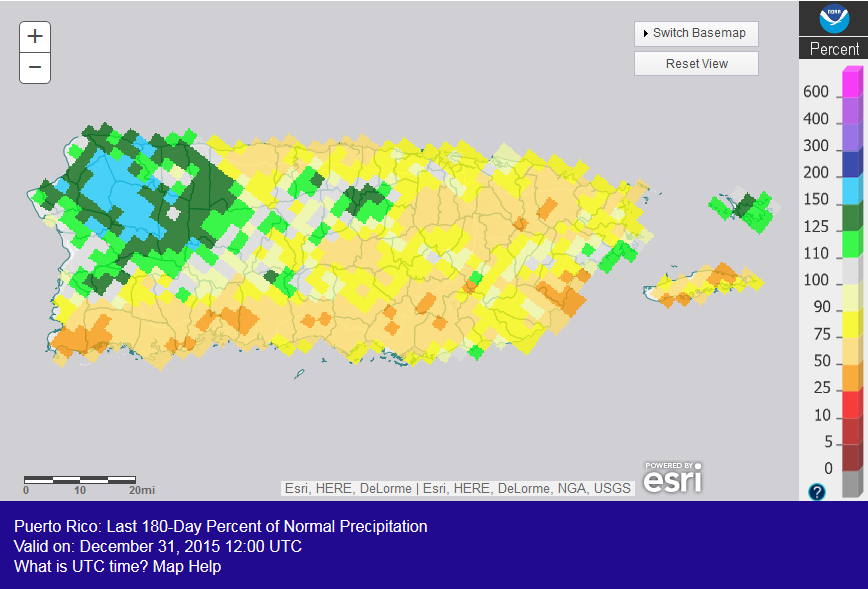
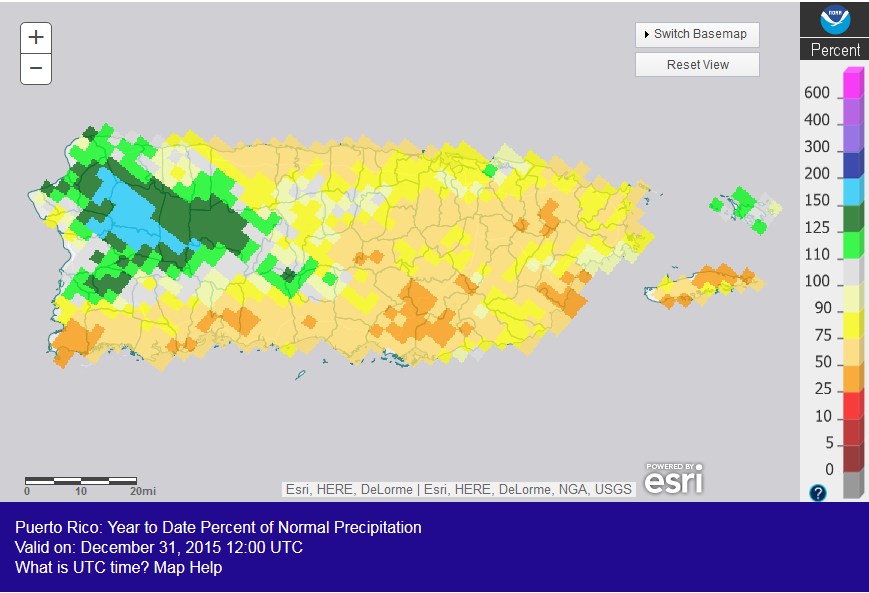
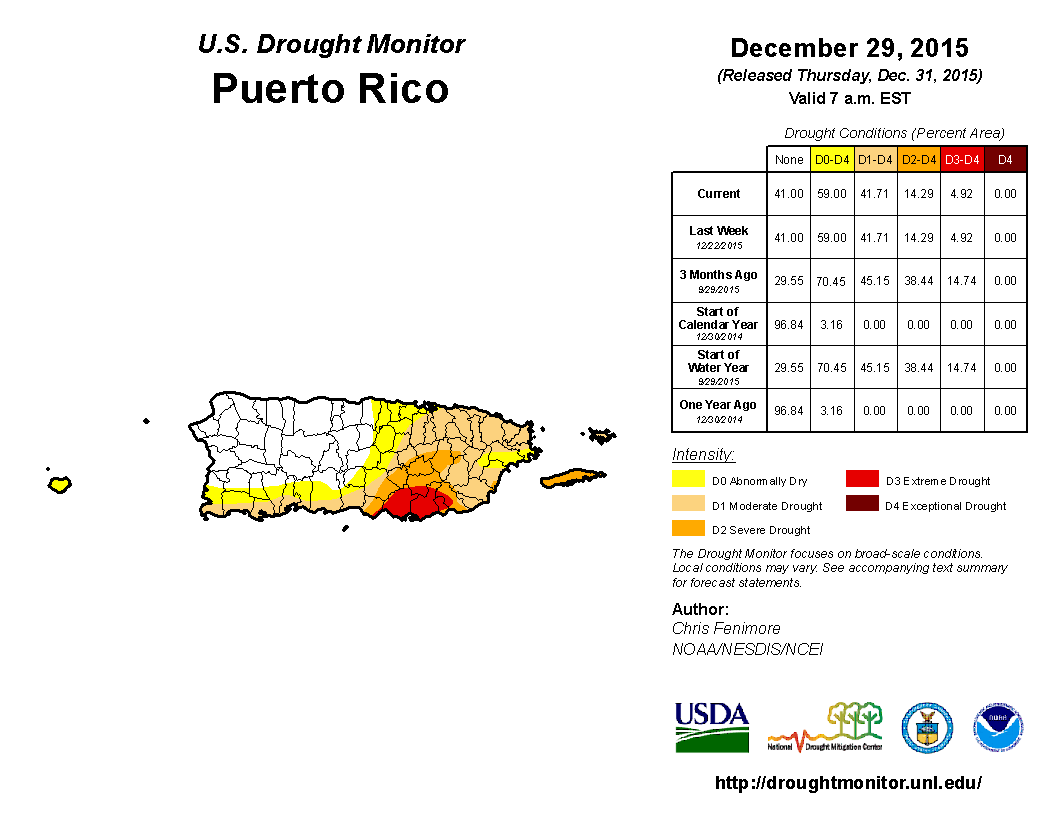
Puerto Rico: Most of Puerto Rico was drier than normal during December. The northwest and southeast corners of the Commonwealth were near to wetter than normal at the 2- to 3-month time scales, but dryness dominated all but the northwest parts at longer time scales (last 6 to 12 months). On the December 29th USDM map, abnormal dryness and drought held constant at about 59.0 percent of Puerto Rico, but moderate to extreme drought expanded slightly to 41.7 percent of the island.
CONUS State Precipitation Ranks:
 |
|
With wet conditions dominating in December and other months this year, most states had precipitation ranks in the near-normal to wetter-than-normal range (December, October-December, July-December state ranks). For the last twelve months, however, five states ranked in the driest third of the historical record, including Connecticut (which had the fourth driest January-December) and California (13th driest). The last four years have been drier than average in Connecticut.
|
|
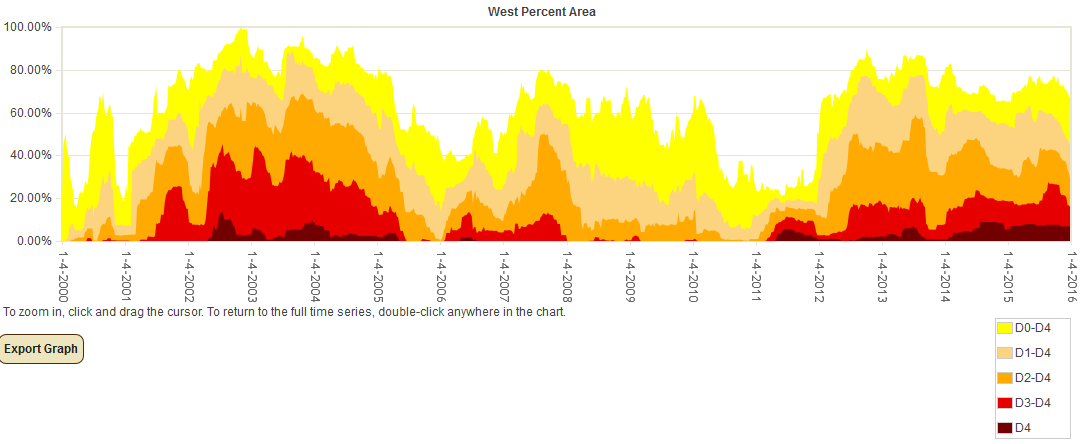
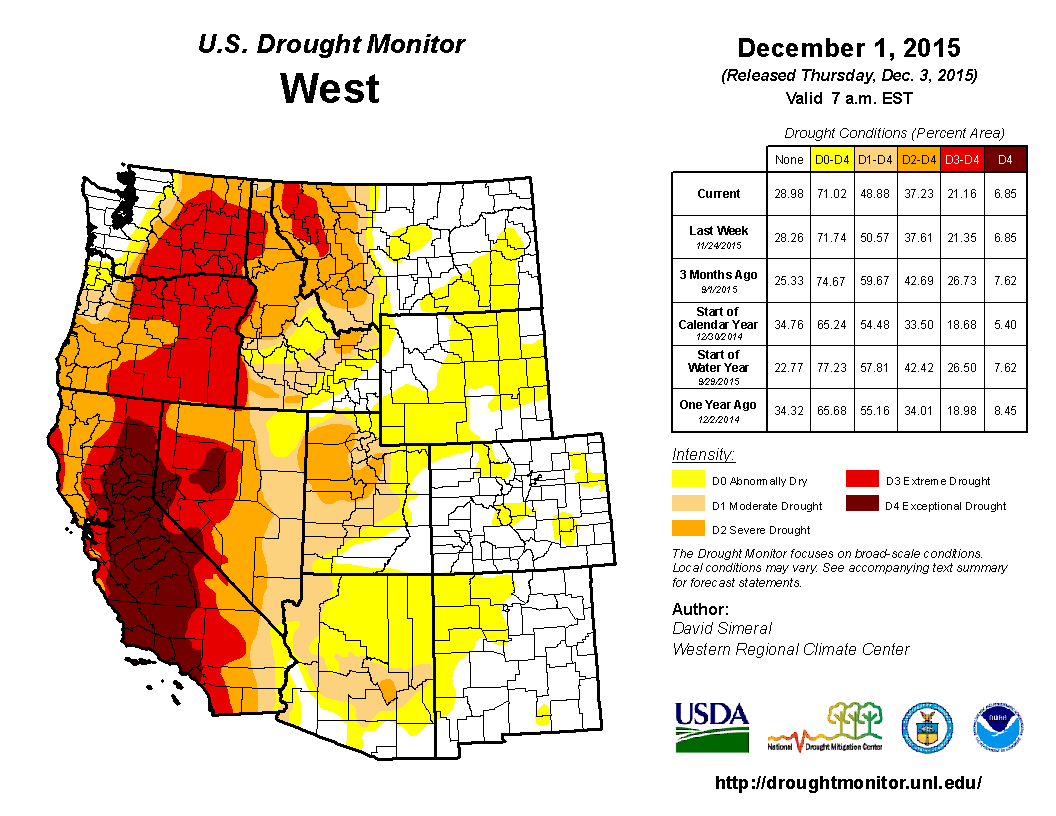
Percent area of the Western U.S. in moderate to extreme drought, January 1900 to present, based on the Palmer Drought Index.
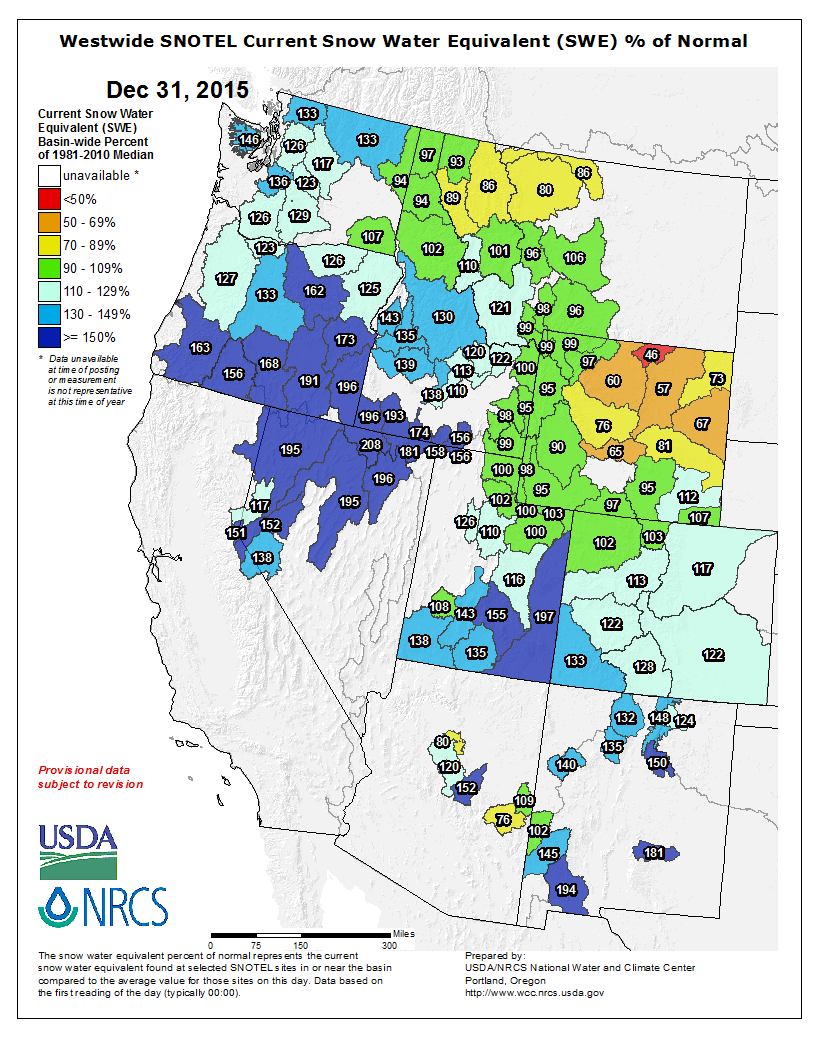
December was wetter than normal across much of the West. It was drier than normal in parts of the Southwest and in the Big Horn region of Wyoming. With a wetter-than-normal water year-to-date (October 1-December 31), mountain snowpack has improved in many areas. The precipitation has been enough to improve drought conditions, but deficits built up over the last several years will take much more precipitation to ease. According to the USDM, 45.1 percent of the West was experiencing moderate to exceptional drought at the end of December, which is slightly less than the previous month. The Palmer Drought Index percent area statistic for the West was 18.8 percent, which is about half of the amount from the previous month.
 |
 |
December saw a continuation of the wetter- and warmer-than-normal weather of the previous two months in the Primary Hard Red Winter Wheat agricultural belt. December 2015 ranked as the ninth wettest and sixth warmest December in the 1895-2015 record, regionwide. October marks the beginning of the growing season. The region was generally wetter- and warmer-than-normal for the growing season-to-date, with October-December 2015 ranking as the fifth wettest and third warmest October-December in the 1895-2015 record, regionwide.
NOAA Regional Climate Centers:
A more detailed drought discussion, provided by the NOAA Regional Climate Centers and others, can be found below.
West
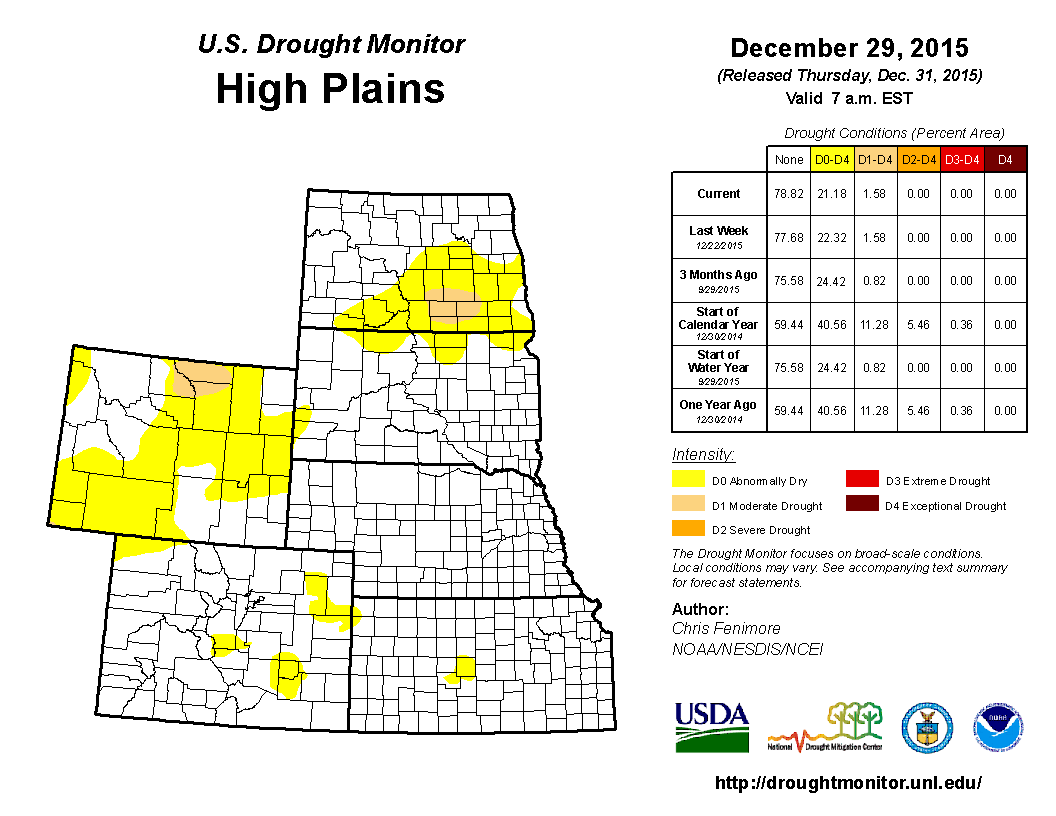
As described by the High Plains Regional Climate Center, a warm pattern continued into December for much of the High Plains region, especially in the eastern part of the area. Many areas experienced much above normal precipitation due to a persistent storm track that brought systems through the area, but not all places in the High Plains had above normal precipitation during December. Parts of Wyoming, eastern Colorado, northwestern Kansas, and southwestern Nebraska missed out and received 50 percent of normal precipitation, at best. One particularly dry area was Goodland, KS, which only received 0.16 inch (4 mm) of precipitation for the month, or 35 percent of normal. However, the month was nowhere near record-breaking compared to other Decembers on record. Luckily, at this time of year, deficits do not accumulate quickly, as even 50 percent of normal may only translate into a deficit of a half inch. Snowpack is faring well in Colorado, but not faring as well in Wyoming. Dry conditions have led to below normal snowpack across the northern and central parts of the state, particularly in the Bighorn Mountains. Because it is early in the season, it is important to keep in mind that these conditions can change quite dramatically over the course of the season.
There were both improvements and degradations in drought conditions across the High Plains region in December, according to the USDM. The two areas of moderate drought (D1) in central and eastern Kansas that were present at the beginning of the month were removed by mid-December due to excessively wet conditions. Parts of the areas that were previously in drought have received as much as 300 percent of normal precipitation since November. Above normal precipitation in December also improved drought conditions and abnormal dryness (D0) in the Dakotas, although a small area of D1 remains in southern North Dakota. Pockets of D0 were also removed from the Nebraska panhandle, southern Nebraska, and northern and central Colorado. Some parts of the region missed out on the excessive precipitation in December, leading to degradations in drought conditions. North-central Wyoming was placed into moderate drought (D1) in late December. This area received 50-70 percent of normal precipitation in December, at best. In fact, this region experienced below normal precipitation during the fall months as well. This particular region contains the Bighorn Mountains, and the snowpack season has not gotten off to a very good start there.
As explained by the Southern Regional Climate Center, as was the case with November, December was a warm month for the entire Southern region, the third warmest December regionwide. Precipitation varied spatially with some areas receiving above normal precipitation, and other areas experiencing precipitation deficits for the month. In southern Texas, conditions were quite dry, with many stations averaging less than half the normal precipitation. Near-to-above normal precipitation in the Southern region has allowed for the continuation of drought-free conditions in all six states. By the end of the year, 2015 was the wettest year on record for Texas. The major flooding and wet periods of 2015 were in May and October. These beat the previous record from 1895. This excess rain put an end to the five year drought. The Lone Star State was drought free for all of December, with just a slight increase in the areas with Abnormal Dryness (D0) throughout the month (Information provided by the Texas Office of State Climatology).
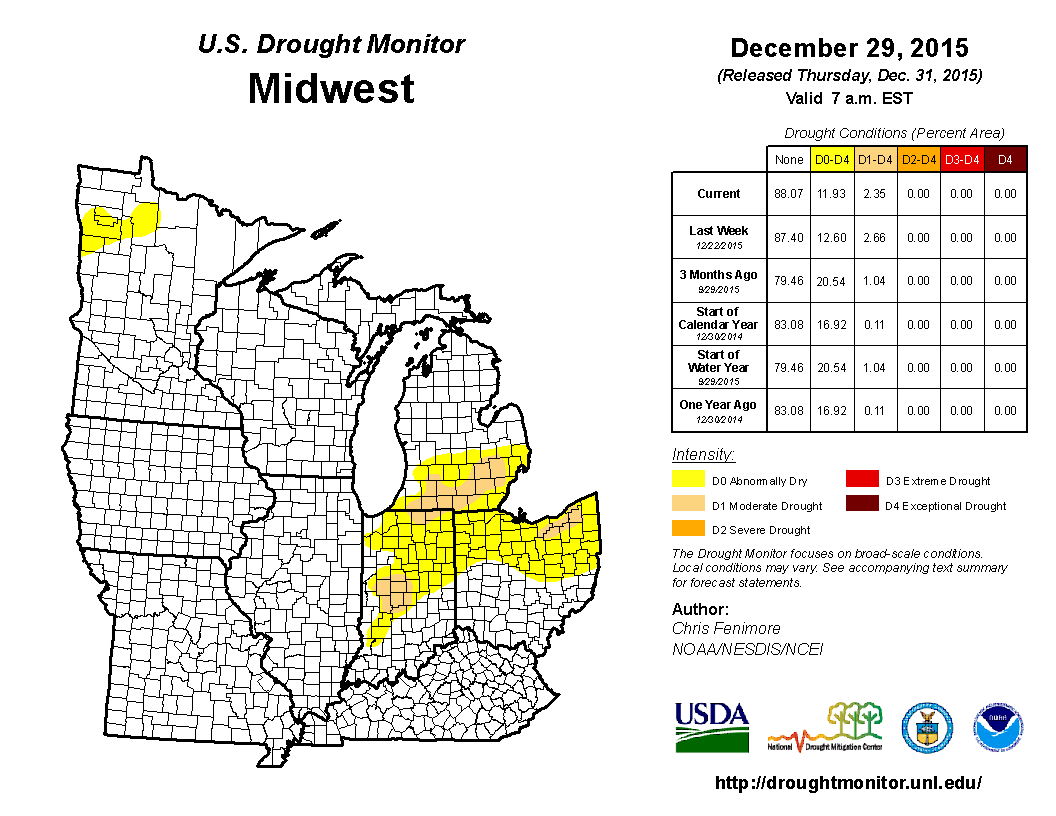
As summarized by the Midwest Regional Climate Center, December was unseasonably warm across the Midwest and ranked as the warmest December on record in the past 121 years (1895-2015). It was also the wettest December. After a wet December, drought concerns remained minimal across the Midwest. At the beginning of December, only 3.16 percent of the region was in drought and by the end of the month, this reduced to 2.35 percent. The main area of improvement was in the Upper Peninsula of Michigan. On the other hand, a small portion of northeast Ohio remained in moderate drought. Other drought areas that did not see much improvement in December were portions of central Indiana, northern Indiana, and southern Michigan.
As noted by the Southeast Regional Climate Center, temperatures were exceptionally above average across the Southeast region, and precipitation was well above normal across much of the region during December. The driest locations were found across central and northern Florida as well as southeastern Georgia, where monthly precipitation totals were between 5 and 50 percent of normal. Temperatures were well above average in Puerto Rico and the U.S. Virgin Islands, as San Juan, PR (1898-2015) tied its fifth warmest December mean temperature on record. Precipitation was well below normal across much of Puerto Rico and the U.S. Virgin Islands, with monthly precipitation totals that were less than 5 percent of normal across southwestern Puerto Rico. Ensenada, PR (1955-2015) tied its driest December on record with no measurable precipitation.
Drought conditions (D1 and greater) were not observed across the Southeast region (excluding Puerto Rico) during December. The extent of severe-to-extreme (D2 and D3) drought conditions across eastern Puerto Rico decreased about 2 percent during the month, reaching a coverage of 14 percent on December 29th. However, moderate (D1) drought expanded westward along the southern coast of Puerto Rico. Extremely warm and wet conditions resulted in widespread agricultural impacts across the region. Heavy rainfall during early December significantly damaged vegetable fields in southeastern Florida, where over 50 percent of the winter yellow squash, zucchini, and green bean crop were lost due to flooding. Saturated pecan groves in Georgia prevented farmers from harvesting a significant portion of the crop. In addition, the lack of December chill hours (i.e. hour with the temperature between 32 and 45 degrees F [0 and 7.2 degrees C]) in Georgia reduced the period of winter dormancy required for peach trees and blueberry bushes to maintain a proper growth cycle, which will likely result in lower yields in 2016.
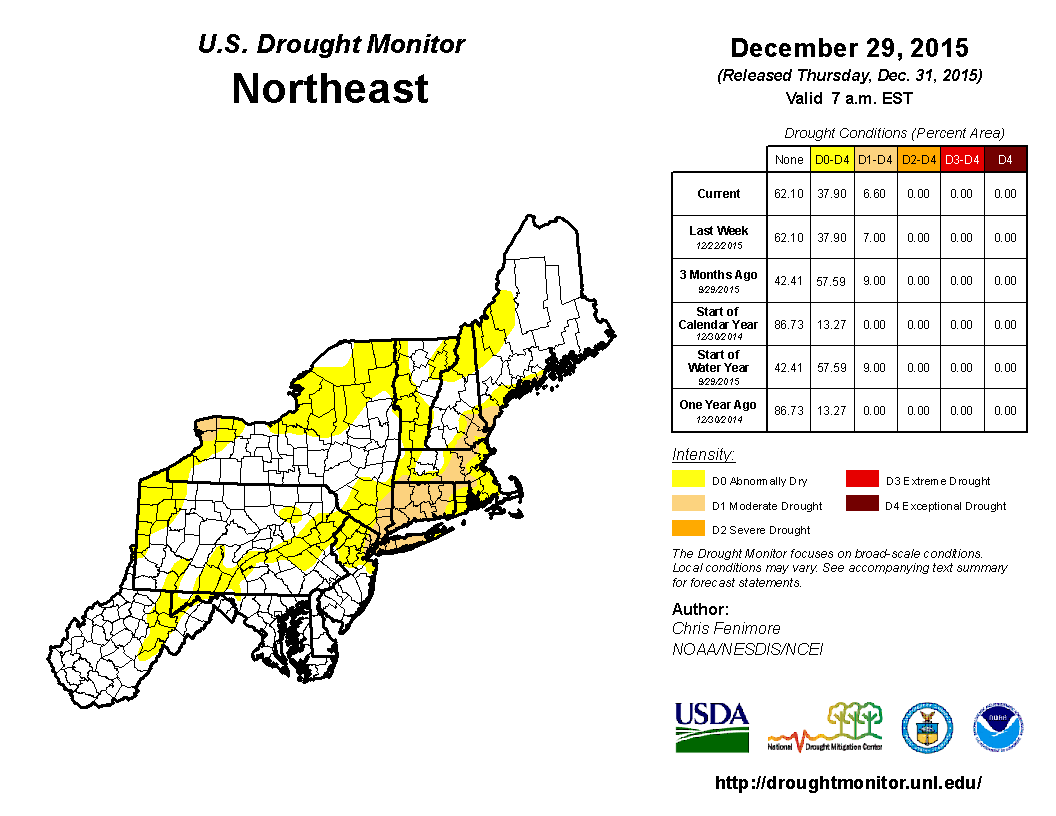
As explained by the Northeast Regional Climate Center, December was an extremely mild month as the Northeast was record warm. The region received 4.52 inches (114.81 mm) of precipitation in December, or 130 percent of normal. This made it the 20th wettest December on record. In early December, 20 percent of the Northeast was abnormally dry, with another 6 percent of the region experiencing moderate drought. Conditions deteriorated somewhat during December, with abnormal dryness expanding to cover 31 percent of the region by month's end.
As summarized by the Western Regional Climate Center, storms brought well above normal precipitation to the Northwest, northern Great Basin, and some areas of the Rocky Mountains. Temperatures averaged near normal, with pockets of above normal temperatures along the northern tier.
The Pacific Northwest saw impressive amounts of precipitation. Many areas that observed above normal precipitation also saw significant snowfall. Snowpack in the Sierra Nevada was just slightly above normal at month's end. In the Cascades and northern Great Basin, snowpack ranged from 100% to nearly 200% of normal. The northern and central Rockies observed slightly below normal snowpack, generally 75-100% of normal, while the southern Rockies were 110% to 150% of normal. Abundant precipitation and building snowpack helped to alleviate drought conditions in eastern Washington, western Oregon, coastal northern California and portions of Idaho and Montana. Extreme to exceptional drought conditions persisted California, western Nevada, and southeastern Oregon.
The Desert Southwest was seasonally dry this month. Las Vegas, Nevada recorded 0.01 in (less than 1 mm) for the month, 2% of normal. In Las Vegas' 68-year record, 16 other years observed 0.01 in (less than 1 mm) or less. Southern California also saw drier than normal conditions — rainfall in Los Angeles totaled 0.57 in (14 mm), 24% of normal. Drought conditions improved in a very small area of western Arizona and northern Wyoming.
Parts of Hawaii continued to remain warm. Lihue, Kauai, had its warmest December since records began in 1950, averaging 76.2 F (24.5 C), 3 F (1.6 C) above normal. Honolulu, Oahu, and Hilo, Big Island, both had their second warmest December on record at 77.9 F (25.5 C) and 74.6 F (23.7 C), respectively. After wetter than normal conditions the past 4 months, many locations in Hawaii observed a drier than normal December. Honolulu recorded 0.27 in (7 mm), 8% of the December normal, tied for 7th driest December in 76 years. In Alaska, temperatures were within 5 F (2.8 C) of normal. With the exception of the southeast, much of the state observed drier than normal conditions this month. Fairbanks received 0.07 in (2 mm) of precipitation, 11% of normal and the 5th driest December since records began in 1929. Anchorage recorded 0.23 in (6 mm), 21% of normal, the 4th driest since records began in 1952.
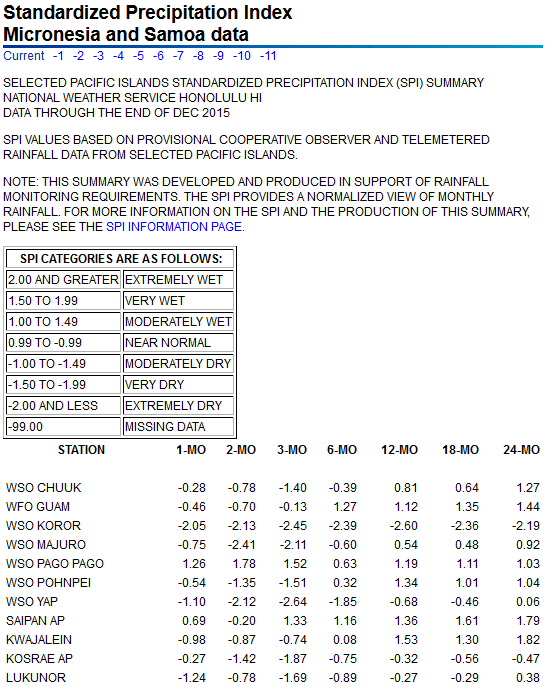
Pacific Islands: According to reports from National Weather Service offices, the Pacific ENSO Applications Climate Center (PEAC), and partners, conditions varied across the Pacific Islands.
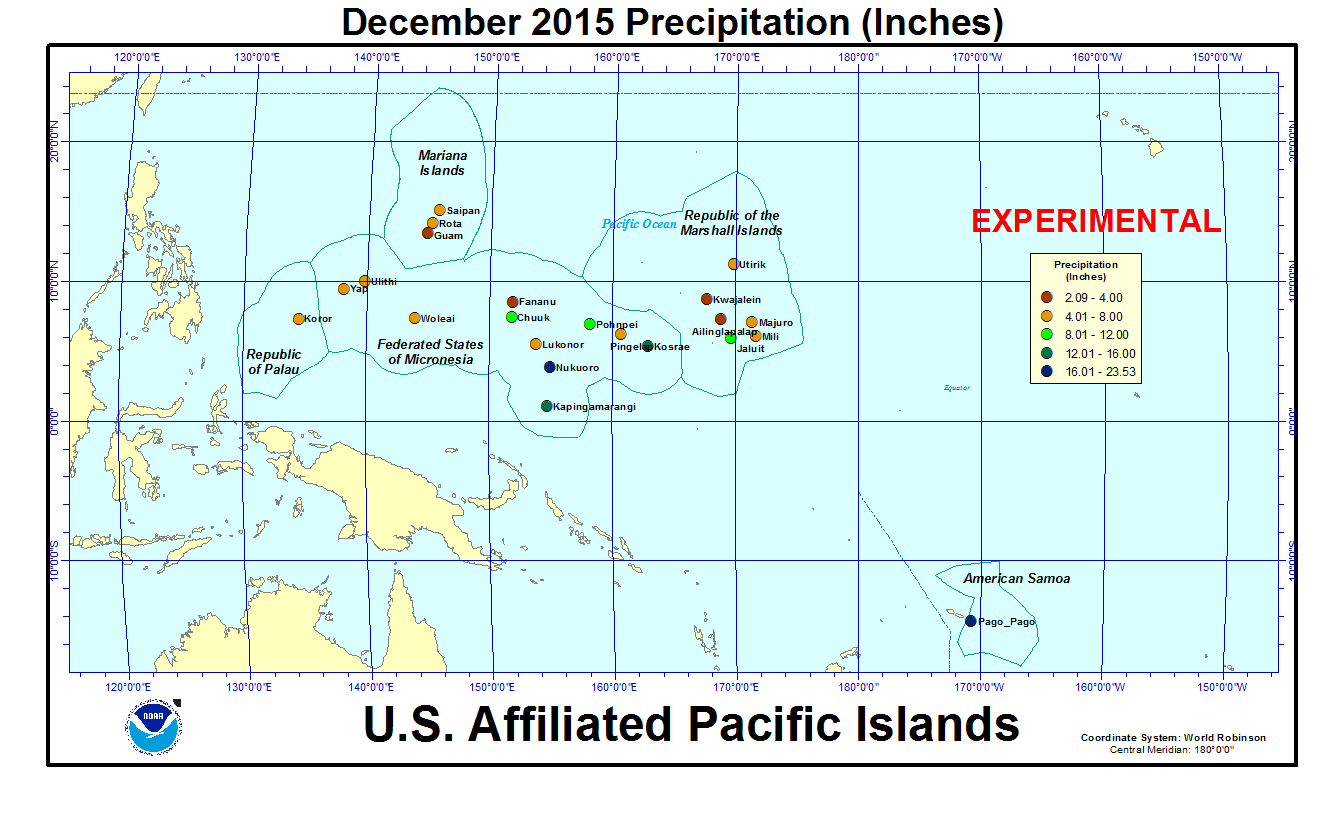
In the U.S. Affiliated Pacific Islands (maps — Micronesia, Marshall Islands, basinwide), December 2015 was wetter than normal at only Kapingamarangi, Pago Pago, and Saipan, and drier than normal at the rest of the primary stations.
Rainfall amounts were below the minimum thresholds (4 or 8 inches) required to meet most monthly water needs at stations across the region. These included the primary stations of Guam in the Mariana Islands; Koror in the Republic of Palau; Dugor, Fananu, Gilman, Luweech, Lukonor, Maap, North Fanif, Pingelap, Rumung, Tamil, Ulithi, and Yap in Micronesia; and Ailinglapalap, Kwajalein, Majuro, Mili, and Utirik in the Republic of the Marshall Islands. Koror had 4.59 inches of rain in December, with 9 of the last 12 months drier than 8 inches. In Micronesia, Yap reported 4.93 inches of rain in December, with the last three months very dry. The stations on the islands around Yap have also been much drier than 8 inches for each of the last three months. Gilman and Ulithi have reported less than 8 inches for the last four months, and Woleai for the last five months. In the Marshall Islands, Ailinglapalap has had less than 8 inches of precipitation for eight of the last 12 months, Jaluit for nine of the last 11 months, and Mili for nine of the last 14 months. The 4- and 8-inch thresholds are important because, if monthly precipitation falls below the threshold, then drought becomes a concern. Below-normal rainfall is expected to continue for many of these stations as the strong El Niño persists.
In early January 2016, the NOAA National Weather Service office in Guam issued a Drought Information Statement for the Republic of Palau, Yap State in Micronesia, and the Marshall Islands. The Drought Information Statement noted the very dry conditions of the last three months and urged close monitoring of water supplies, implementation of water conservation measures, and concern for grass fires and impacts on crops and other vegetation. The Guam office also issued a Public Information Statement for the Mariana Islands warning of continued dry weather with the risk of grass fires and damage to food crops. Grass fires have already been observed on Guam and the office urged monitoring of water supplies and implementation of water conservation measures.
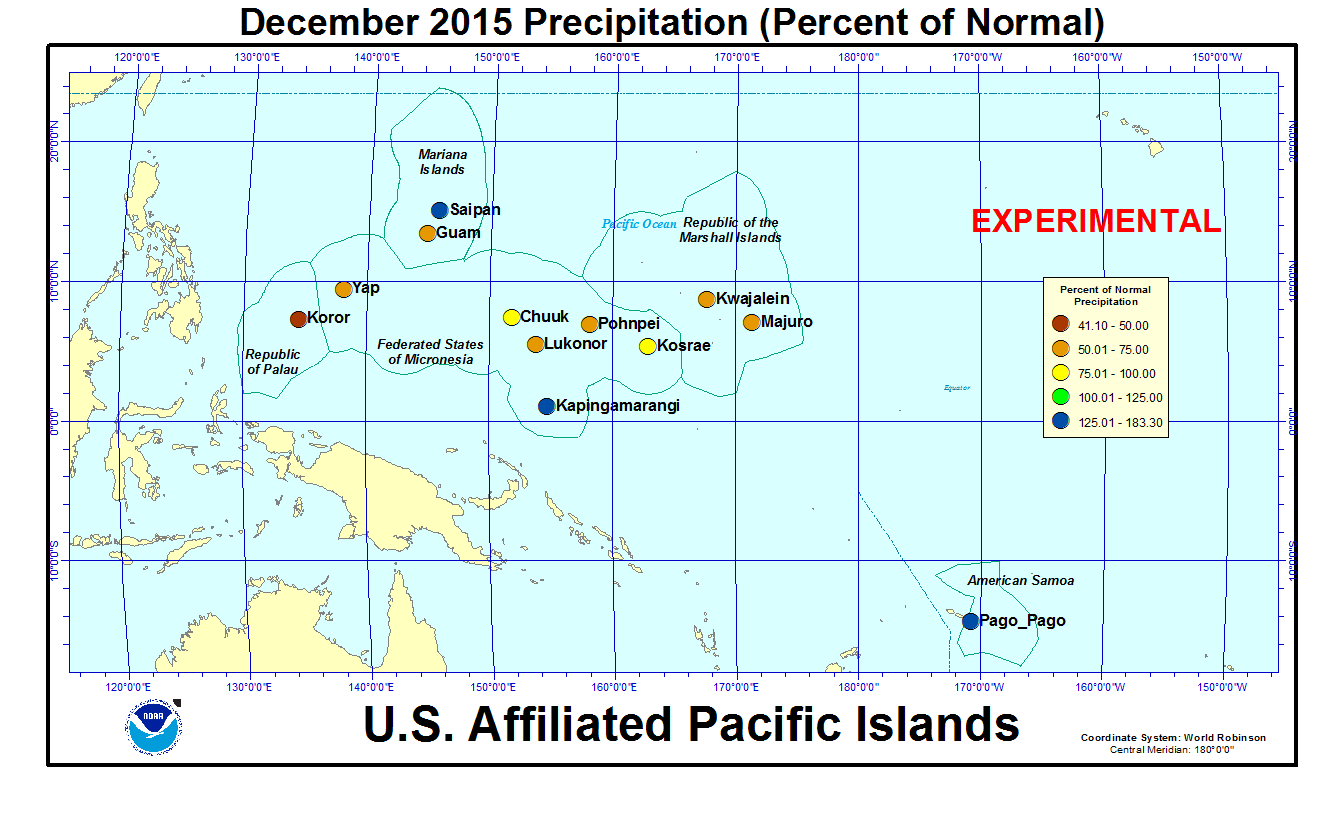
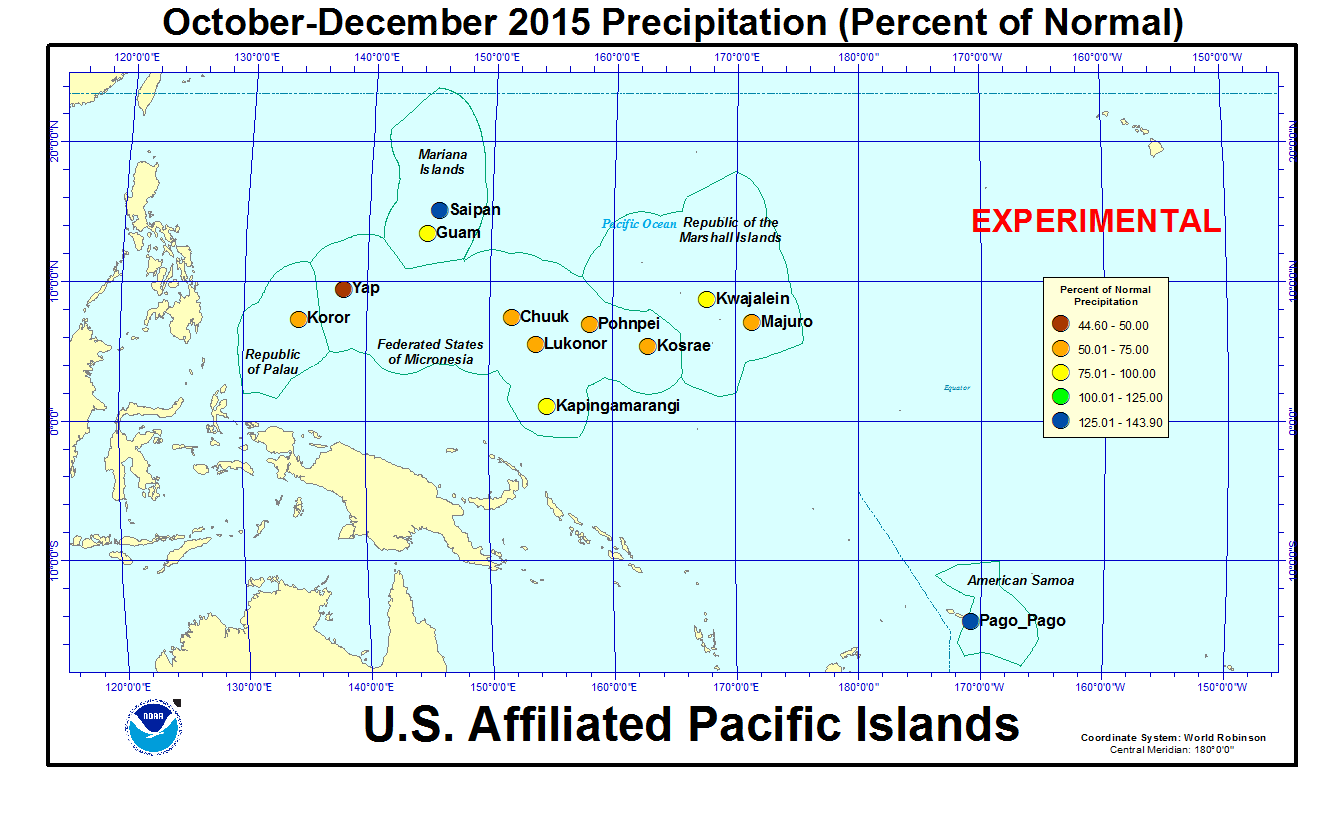
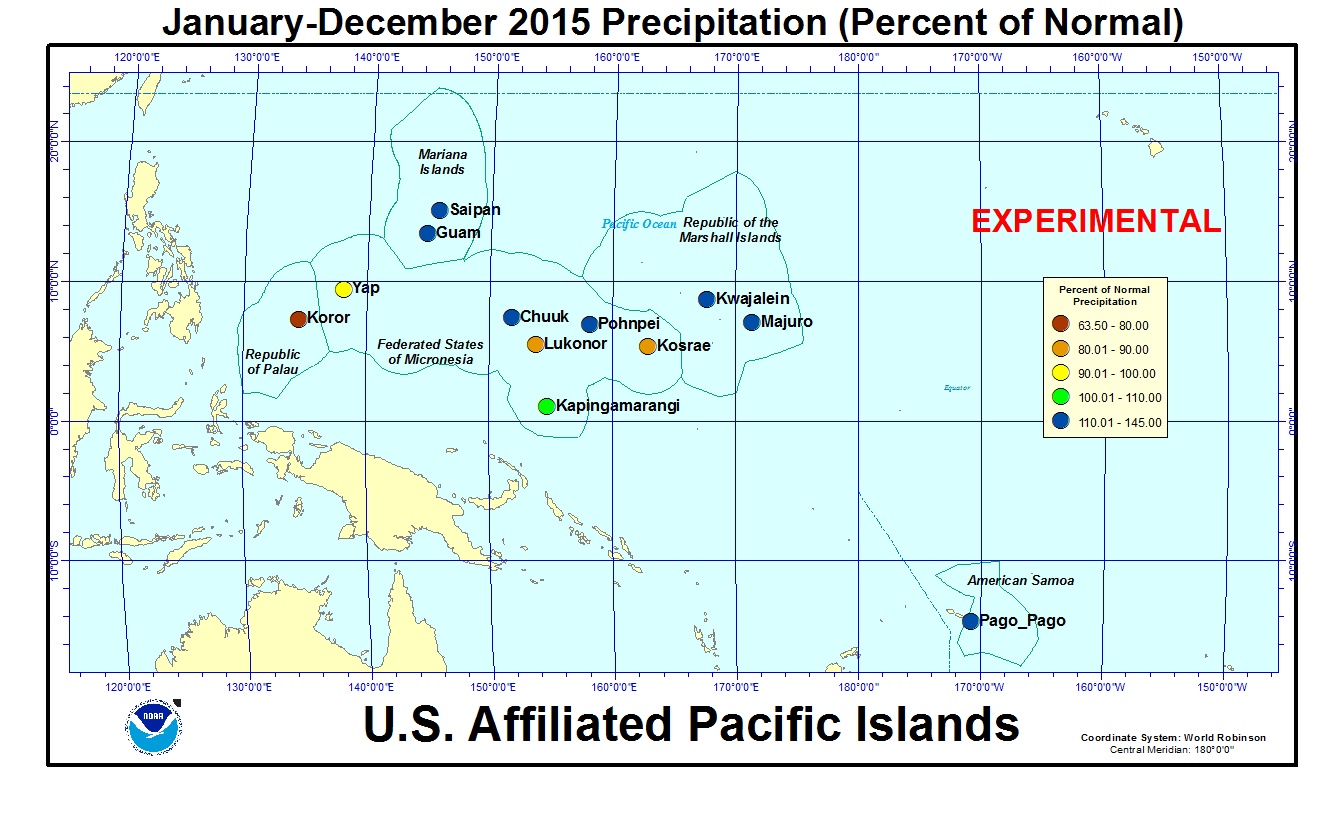
As measured by percent of normal precipitation, Koror, Kosrae, Lukonor, and Yap have been drier than normal in the short term (December and the last 3 months [October-December 2015]) as well as the long term (last 12 months [January-December 2015]). Pago Pago and Saipan were wetter than normal at all three time scales. Chuuk, Guam, Kwajalein, Majuro, and Pohnpei have been drier than normal in the short term but near to wetter than normal in the long term. Kapingamarangi was drier than normal for December but near to wetter than normal at the other two time scales.
| Station Name | Jan 2015 | Feb 2015 | Mar 2015 | Apr 2015 | May 2015 | Jun 2015 | Jul 2015 | Aug 2015 | Sep 2015 | Oct 2015 | Nov 2015 | Dec 2015 | Jan- Dec |
|---|---|---|---|---|---|---|---|---|---|---|---|---|---|
| Chuuk | 142% | 134% | 209% | 104% | 89% | 172% | 54% | 155% | 188% | 53% | 70% | 82% | 114% |
| Guam NAS | 213% | 6% | 198% | 263% | 291% | 86% | 215% | 146% | 108% | 125% | 81% | 74% | 117% |
| Kapingamarangi | 229% | 131% | 62% | 87% | 173% | 161% | 54% | 162% | 112% | 63% | 89% | 134% | 105% |
| Koror | 64% | 83% | 69% | 74% | 33% | 107% | 27% | 73% | 143% | 53% | 69% | 41% | 64% |
| Kosrae | 116% | 114% | 91% | 92% | 84% | 143% | 108% | 138% | 115% | 63% | 33% | 95% | 84% |
| Kwajalein | 74% | 149% | 994% | 322% | 204% | 117% | 104% | 171% | 95% | 105% | 88% | 59% | 145% |
| Lukonor | 228% | 97% | 99% | 83% | 89% | 136% | 77% | 75% | 149% | 40% | 123% | 56% | 88% |
| Majuro | 106% | 63% | 329% | 162% | 171% | 57% | 87% | 207% | 96% | 83% | 40% | 61% | 112% |
| Pago Pago | 201% | 102% | 64% | 153% | 172% | 170% | 72% | 125% | 18% | 88% | 210% | 183% | 120% |
| Pohnpei | 78% | 100% | 138% | 119% | 219% | 108% | 138% | 199% | 124% | 78% | 67% | 71% | 120% |
| Saipan | 184% | 14% | 315% | 203% | 341% | 115% | 112% | 141% | 92% | 198% | 64% | 154% | 138% |
| Yap | 92% | 89% | 93% | 139% | 235% | 92% | 82% | 148% | 68% | 43% | 37% | 58% | 91% |
| Station Name | Jan 2015 | Feb 2015 | Mar 2015 | Apr 2015 | May 2015 | Jun 2015 | Jul 2015 | Aug 2015 | Sep 2015 | Oct 2015 | Nov 2015 | Dec 2015 | Jan- Dec |
|---|---|---|---|---|---|---|---|---|---|---|---|---|---|
| Chuuk | 14.32" | 9.68" | 17.37" | 13.03" | 10.08" | 20.03" | 6.45" | 19.91" | 22.07" | 6.09" | 7.46" | 9.25" | 155.74" |
| Guam NAS | 8.56" | 0.18" | 4.09" | 6.65" | 9.91" | 5.32" | 21.80" | 21.54" | 13.71" | 14.26" | 5.96" | 3.77" | 115.75" |
| Kapingamarangi | 20.91" | 12.19" | 7.05" | 11.82" | 20.84" | 22.14" | 7.71" | 13.14" | 11.08" | 5.13" | 8.28" | 13.20" | 153.49" |
| Koror | 6.48" | 7.07" | 5.11" | 5.42" | 3.96" | 18.66" | 4.98" | 9.90" | 16.88" | 6.24" | 7.86" | 4.59" | 97.15" |
| Kosrae | 19.28" | 14.73" | 14.57" | 16.12" | 14.89" | 20.90" | 16.17" | 19.69" | 16.36" | 6.90" | 4.55" | 15.37" | 179.53" |
| Kwajalein | 2.33" | 3.94" | 23.37" | 16.94" | 13.69" | 8.12" | 10.28" | 16.63" | 10.24" | 11.71" | 9.98" | 3.90" | 131.13" |
| Lukonor | 19.16" | 8.70" | 9.16" | 9.36" | 10.36" | 15.83" | 12.22" | 10.55" | 15.15" | 4.53" | 11.18" | 6.35" | 132.55" |
| Majuro | 8.24" | 4.32" | 21.65" | 15.23" | 17.27" | 6.31" | 9.72" | 24.24" | 10.72" | 10.52" | 5.33" | 6.93" | 140.48" |
| Pago Pago | 26.87" | 12.22" | 6.88" | 14.35" | 16.59" | 9.07" | 3.99" | 6.75" | 1.20" | 8.15" | 21.33" | 23.53" | 150.93" |
| Pohnpei | 10.24" | 9.58" | 18.14" | 21.94" | 43.68" | 16.03" | 21.31" | 28.33" | 15.59" | 11.86" | 9.95" | 11.41" | 218.06" |
| Saipan | 4.66" | 0.35" | 5.95" | 5.34" | 8.11" | 4.15" | 10.00" | 18.51" | 9.26" | 21.00" | 3.61" | 5.94" | 96.88" |
| Yap | 5.86" | 4.60" | 4.22" | 7.80" | 18.41" | 11.07" | 12.39" | 21.99" | 9.21" | 5.29" | 3.31" | 4.93" | 109.08" |
| Station Name | Jan 2015 | Feb 2015 | Mar 2015 | Apr 2015 | May 2015 | Jun 2015 | Jul 2015 | Aug 2015 | Sep 2015 | Oct 2015 | Nov 2015 | Dec 2015 | Jan- Dec |
|---|---|---|---|---|---|---|---|---|---|---|---|---|---|
| Chuuk | 10.10" | 7.25" | 8.32" | 12.47" | 11.30" | 11.66" | 11.98" | 12.86" | 11.71" | 11.51" | 10.61" | 11.25" | 136.77" |
| Guam NAS | 4.01" | 3.03" | 2.07" | 2.53" | 3.40" | 6.18" | 10.14" | 14.74" | 12.66" | 11.44" | 7.38" | 5.11" | 99.09" |
| Kapingamarangi | 9.15" | 9.27" | 11.43" | 13.64" | 12.08" | 13.78" | 14.15" | 8.13" | 9.93" | 8.19" | 9.27" | 9.84" | 145.85" |
| Koror | 10.18" | 8.56" | 7.44" | 7.32" | 11.83" | 17.48" | 18.53" | 13.50" | 11.77" | 11.84" | 11.39" | 11.16" | 152.90" |
| Kosrae | 16.67" | 12.93" | 16.06" | 17.51" | 17.75" | 14.64" | 14.91" | 14.22" | 14.22" | 10.94" | 13.83" | 16.11" | 213.87" |
| Kwajalein | 3.16" | 2.64" | 2.35" | 5.26" | 6.72" | 6.93" | 9.87" | 9.74" | 10.74" | 11.18" | 11.28" | 6.66" | 90.41" |
| Lukonor | 8.41" | 8.93" | 9.26" | 11.31" | 11.69" | 11.65" | 15.93" | 14.04" | 10.15" | 11.32" | 9.08" | 11.27" | 151.36" |
| Majuro | 7.74" | 6.88" | 6.58" | 9.42" | 10.11" | 11.01" | 11.17" | 11.69" | 11.17" | 12.73" | 13.44" | 11.39" | 125.25" |
| Pago Pago | 13.34" | 12.00" | 10.68" | 9.39" | 9.66" | 5.33" | 5.55" | 5.38" | 6.53" | 9.26" | 10.14" | 12.84" | 125.57" |
| Pohnpei | 13.18" | 9.55" | 13.17" | 18.41" | 19.96" | 14.81" | 15.43" | 14.26" | 12.55" | 15.27" | 14.83" | 16.08" | 182.36" |
| Saipan | 2.53" | 2.59" | 1.89" | 2.63" | 2.38" | 3.62" | 8.91" | 13.13" | 10.09" | 10.62" | 5.61" | 3.85" | 70.25" |
| Yap | 6.39" | 5.19" | 4.56" | 5.63" | 7.85" | 12.04" | 15.08" | 14.82" | 13.50" | 12.18" | 8.83" | 8.51" | 120.31" |
[top]
State/Regional/National Moisture Status
A detailed review of drought and moisture conditions is available for all contiguous U.S. states, the nine standard regions, and the nation (contiguous U.S.):
| northeast u. s. | east north central u. s. | central u. s. |
| southeast u. s. | west north central u. s. | south u. s. |
| southwest u. s. | northwest u. s. | west u. s. |
| Contiguous United States |
[top]
Contacts & Questions