|
Contents Of This Report: |


|
Please note that the values presented in this report are based on preliminary data. They will change when the final data are processed, but will not be replaced on these pages.
National Drought Overview
|
|
[top]
Detailed Drought Discussion
Overview
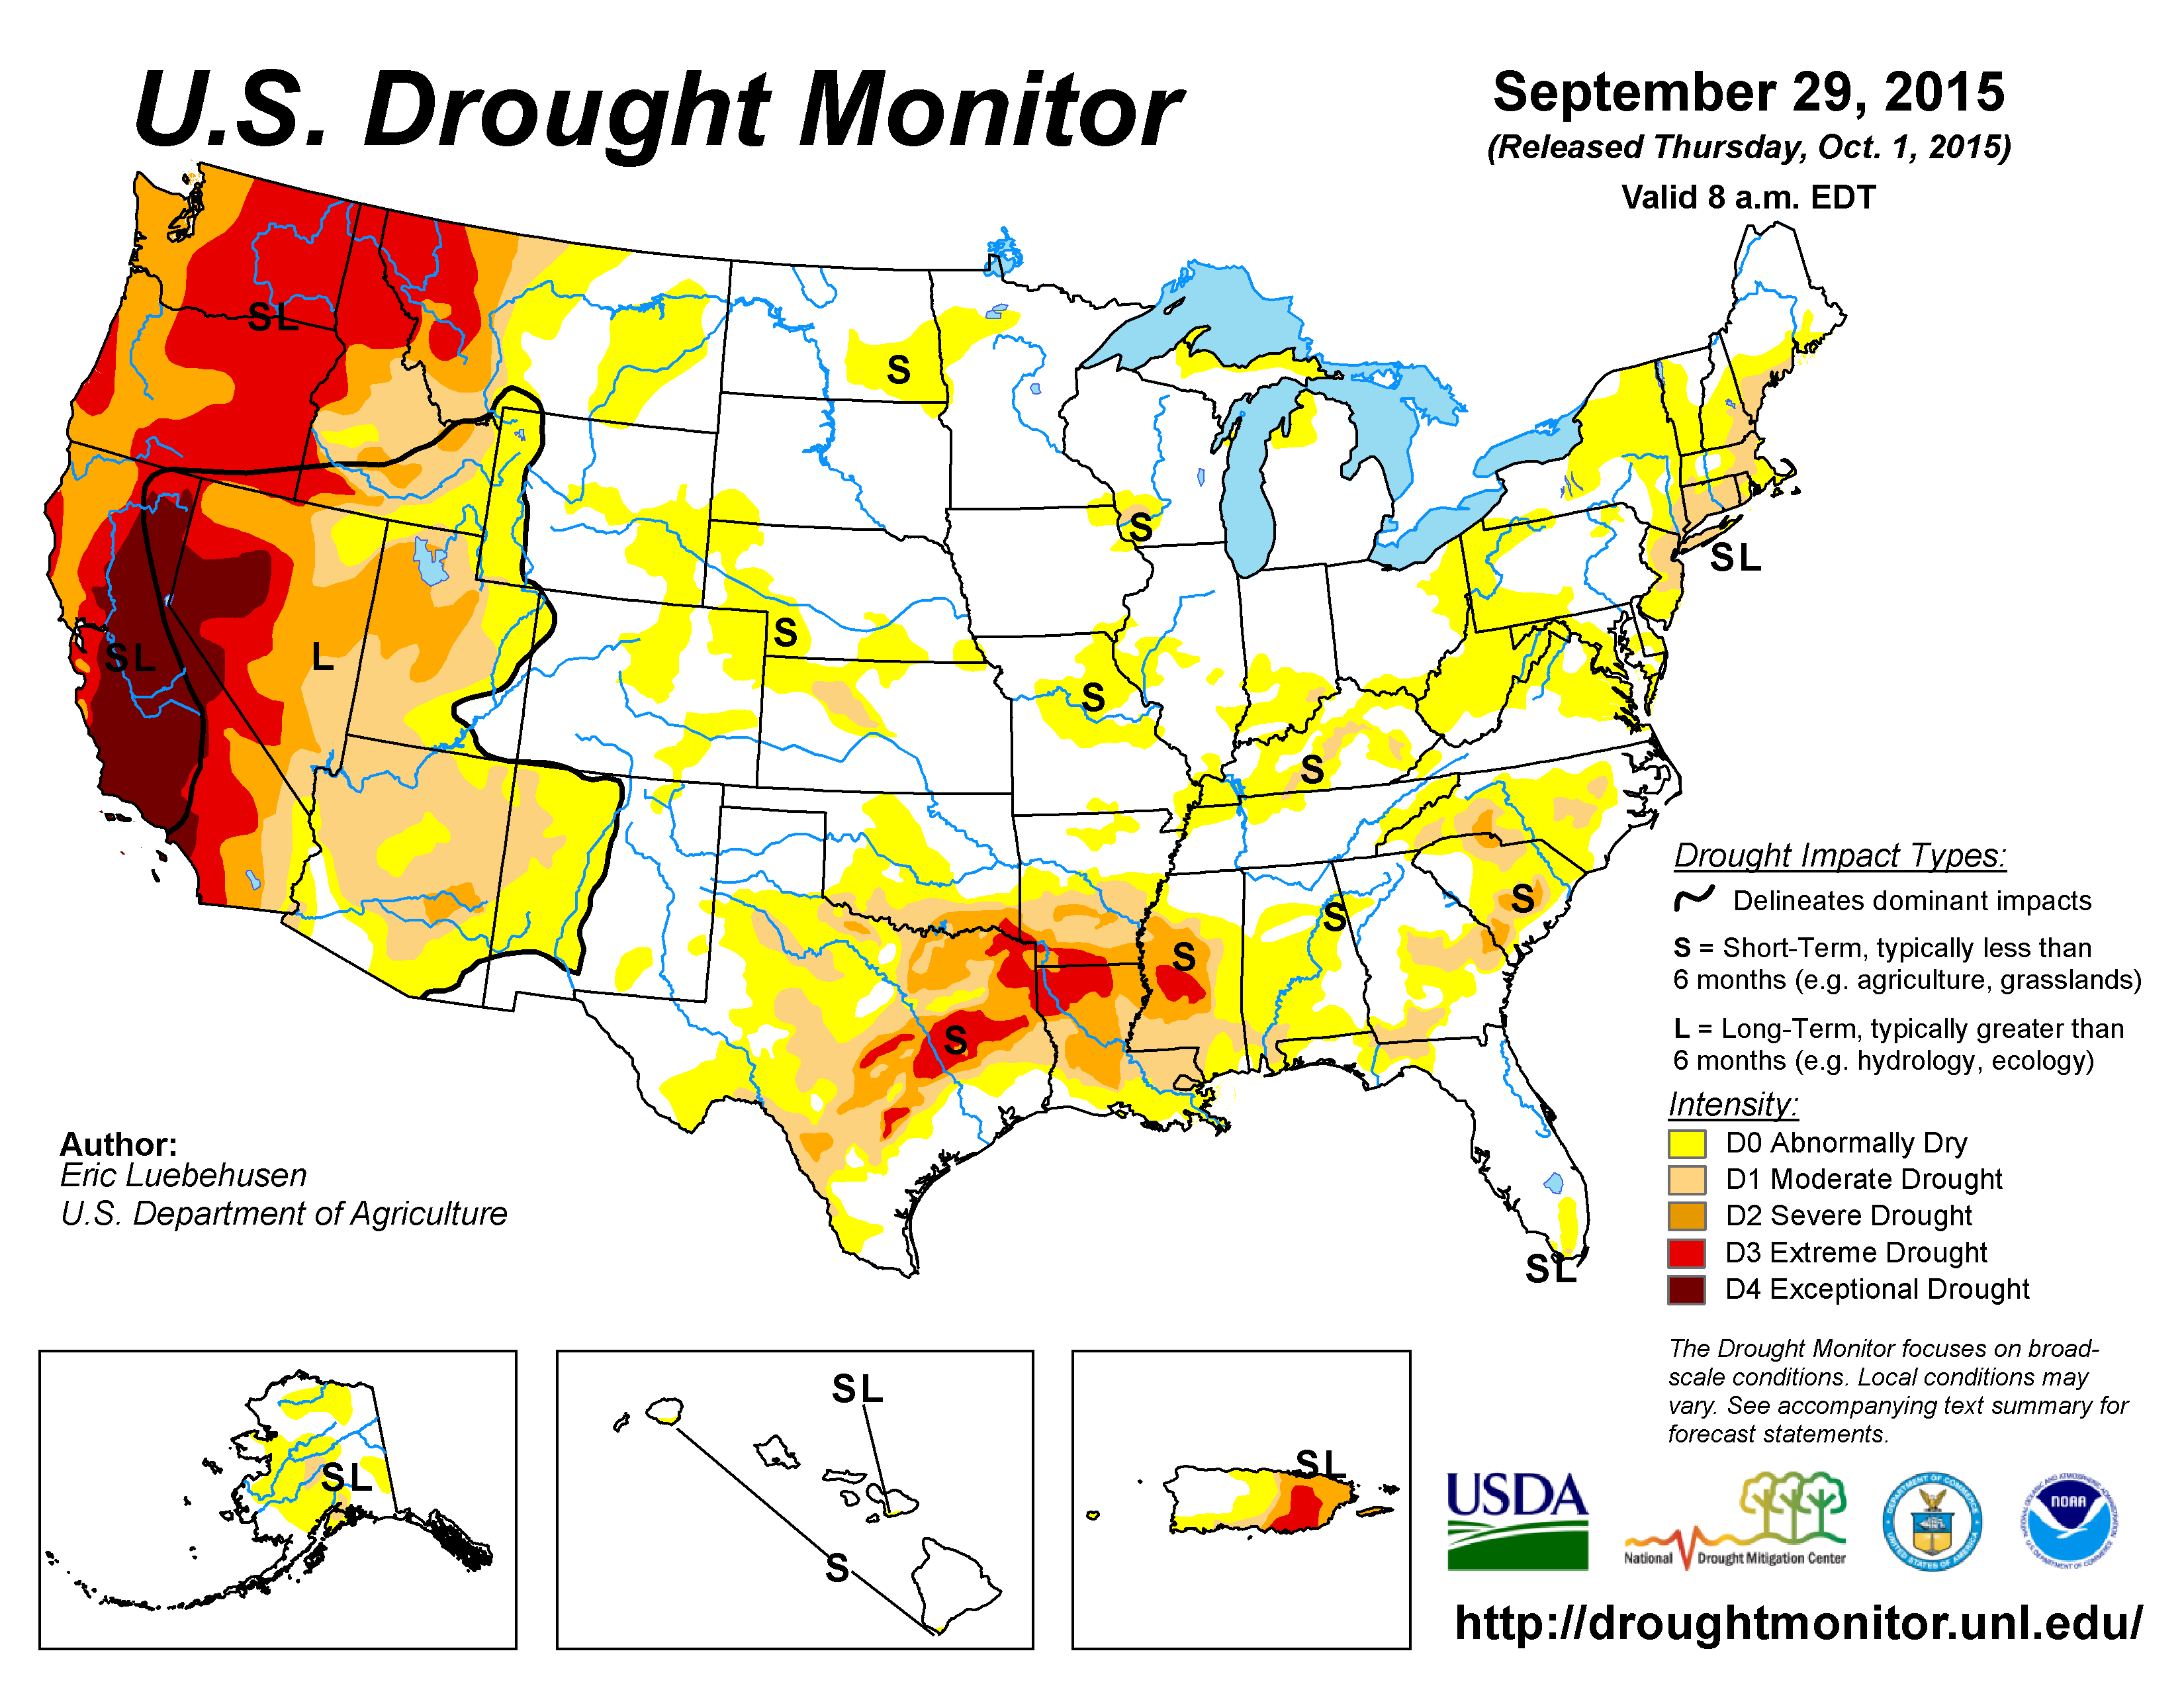
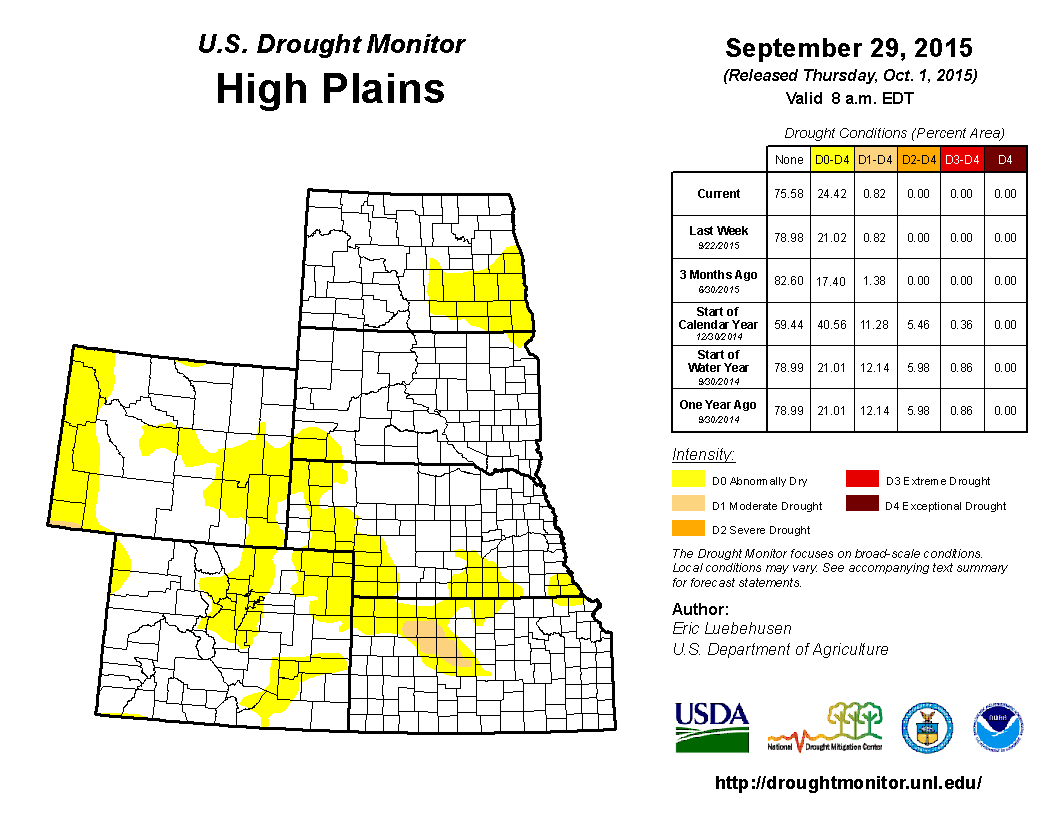
The U.S. Drought Monitor drought map valid September 29, 2015.
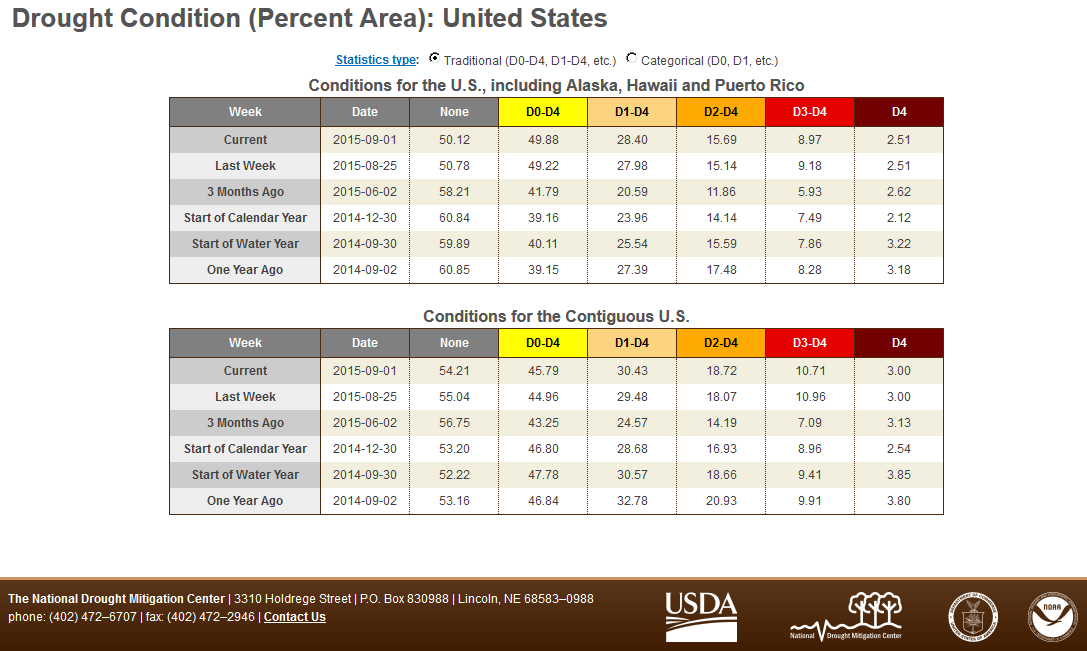
The weather and upper-level circulation during September 2015 were influenced by the North Pacific and North Atlantic subtropical high pressure centers (mostly in the south) and an active jet stream (mostly in the north). A strong El Niño enhanced the creation of numerous Pacific tropical cyclones. Energy from the tropical cyclones that moved into higher latitudes was transferred to the jet stream, which was propagated downstream and helped invigorate the circulation over the CONUS. Moisture from a couple of the eastern North Pacific tropical systems contributed to rainfall over parts of the western CONUS, but most of these systems moved away from North America. Frontal passages and low pressure systems brought areas of above-normal precipitation to parts of the western U.S., Central and Northern Plains, and East, but stable air associated with the highs and upper-level ridges kept much of the country drier than normal. Dominant ridging kept monthly temperatures warmer than average across most of the country, especially from the Plains to Northeast. This weather pattern contracted drought in parts of the Southeast, Gulf of Mexico Coast, and West, and expanded drought and abnormal dryness in parts of the Plains, Lower Mississippi Valley, Ohio Valley, and Northeast. This resulted in a slight increase of the drought area over the CONUS, from 30.4 percent at the end of August to 31.4 percent at the end of September, according to USDM statistics. When integrated across the CONUS, September 2015 ranked as the 21st driest September in the 1895-2015 record. But above-normal precipitation in Alaska, Hawaii, and northwest Puerto Rico contracted drought in those areas, causing the drought area for all of the U.S. to decrease to 26.8 percent. According to the Palmer Drought Index, which goes back to the beginning of the 20th century, about 21.1 percent of the CONUS was in moderate to extreme drought at the end of September, a decrease of about 0.4 percent compared to last month.
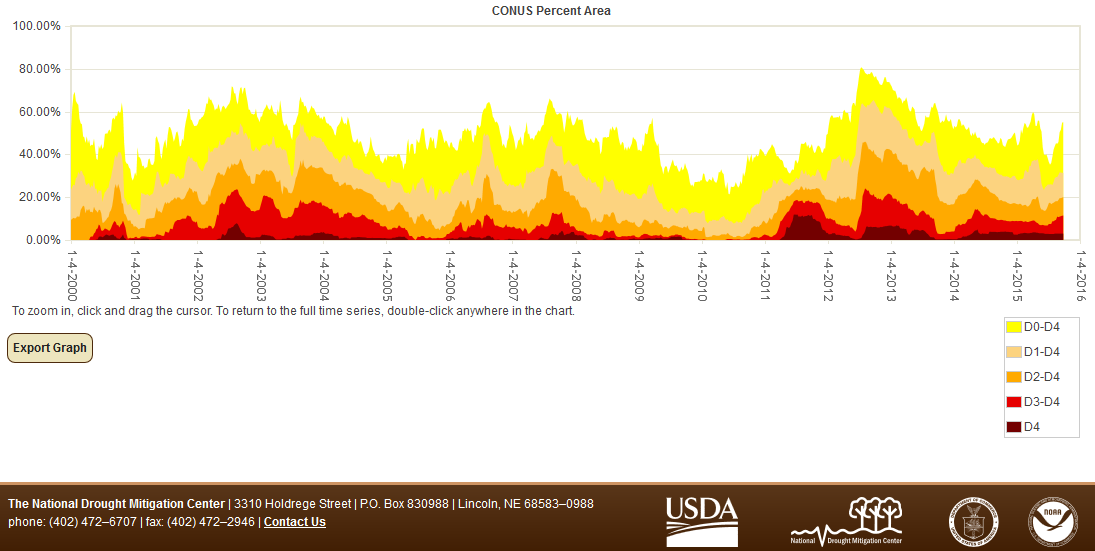
Percent area of the CONUS in moderate to exceptional drought, January 4, 2000 to present, based on the U.S. Drought Monitor.
Palmer Drought Index
The Palmer drought indices measure the balance between moisture demand (evapotranspiration driven by temperature) and moisture supply (precipitation). The Palmer Z Index depicts moisture conditions for the current month, while the Palmer Hydrological Drought Index (PHDI) and Palmer Drought Severity Index (PDSI) depict the current month's cumulative moisture conditions integrated over the last several months. While both the PDSI and PHDI indices show long-term moisture conditions, the PDSI depicts meteorological drought while the PHDI depicts hydrological drought. The PDSI map shows less severe and extensive drought in parts of the West than the PHDI map because the meteorological conditions that produce drought and wet spell conditions are not as long-lasting as the hydrological impacts.
|
 |
Used together, the Palmer Z Index and PHDI maps show that short-term dry conditions occurred over the Southern Plains to Lower Mississippi Valley, resulting in decreasing long-term wet conditions over Texas and Oklahoma and the development of long-term drought over Louisiana and Mississippi in September compared to August. Short-term dry conditions in the Central to Northern Plains reduced the long-term wet conditions. Short-term dry conditions in parts of the Great Lakes reduced the long-term wet conditions and introduced long-term dry conditions. Near-normal to wet short-term conditions in the Mid-Atlantic region contracted long-term drought conditions in parts of North Carolina, compared to last month.
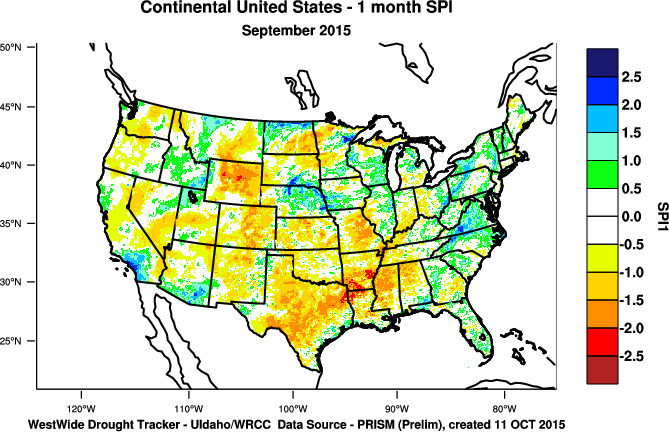
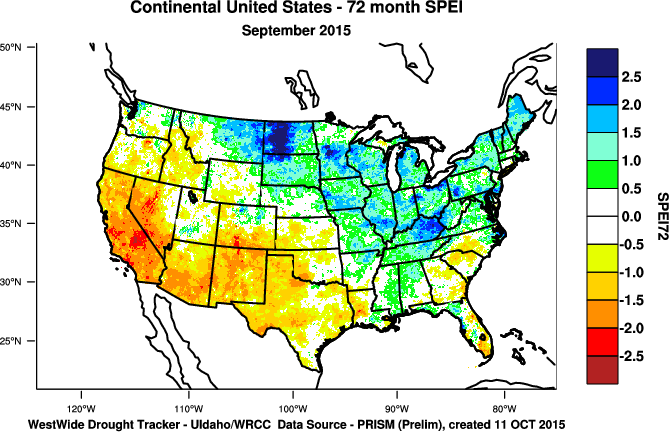
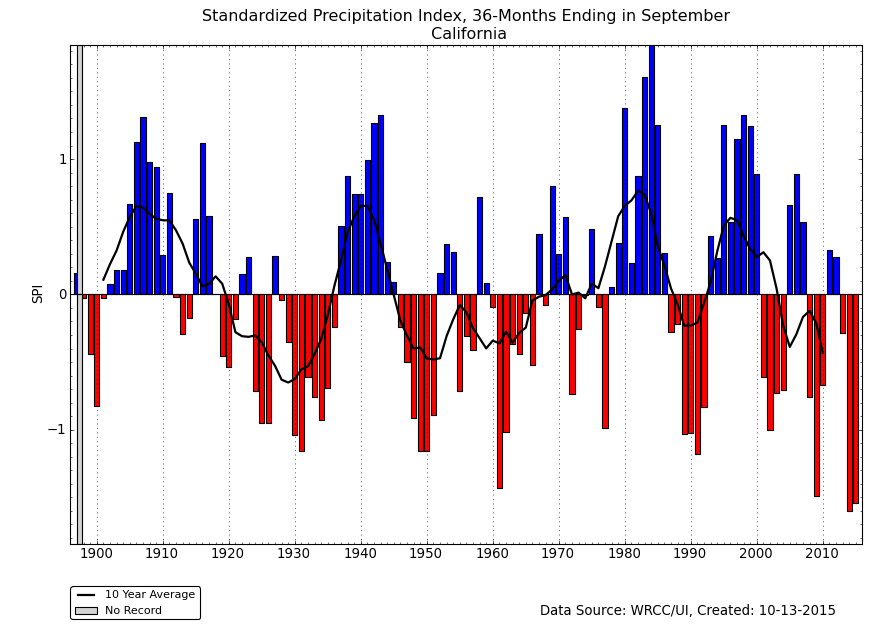
Standardized Precipitation Index
The Standardized Precipitation Index (SPI) measures moisture supply. The SPI maps here show the spatial extent of anomalously wet and dry areas at time scales ranging from 1 month to 24 months.
 |
 |
 |

The SPI maps illustrate how moisture conditions have varied considerably through time and space over the last two years. Dryness in the Southern Plains to Lower Mississippi Valley, and High Plains of Colorado to Wyoming, is evident on the 1- to 3-month SPI maps, but wetness dominates at the 6- to 24-month time scales. The Pacific Northwest has near-normal conditions on the 1-month SPI month, but dryness begins to dominate at 2 to 3 months and is widespread at the 6- to 24-month time scales. The last 1 to 2 months have been dry across parts of the Ohio Valley, but wet conditions dominate at the 3- to 24-month time scales. In California, the dry season (last 1 to 6 months) has had generally near-normal precipitation, but dryness dominates at the 9- to 24-month time scales. Parts of the Southeast to Southern Appalachians have been dry at the 3- to 24-month time scales, but near-normal to wet conditions are evident for the last 1 to 2 months. Southern New England has been drier than normal and northern New England wetter than normal for much of the last 2 to 24 months.
 |
 |
 |
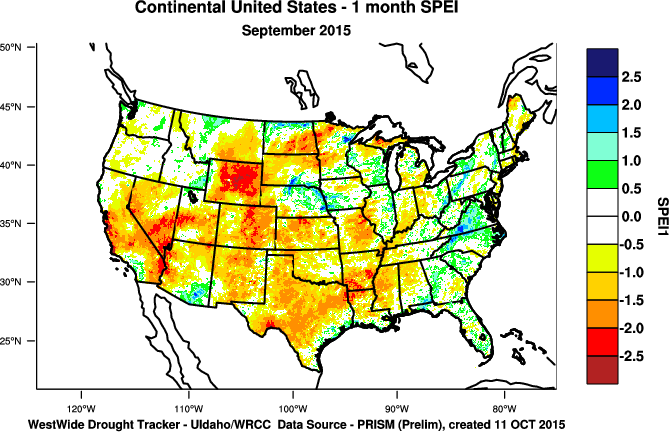
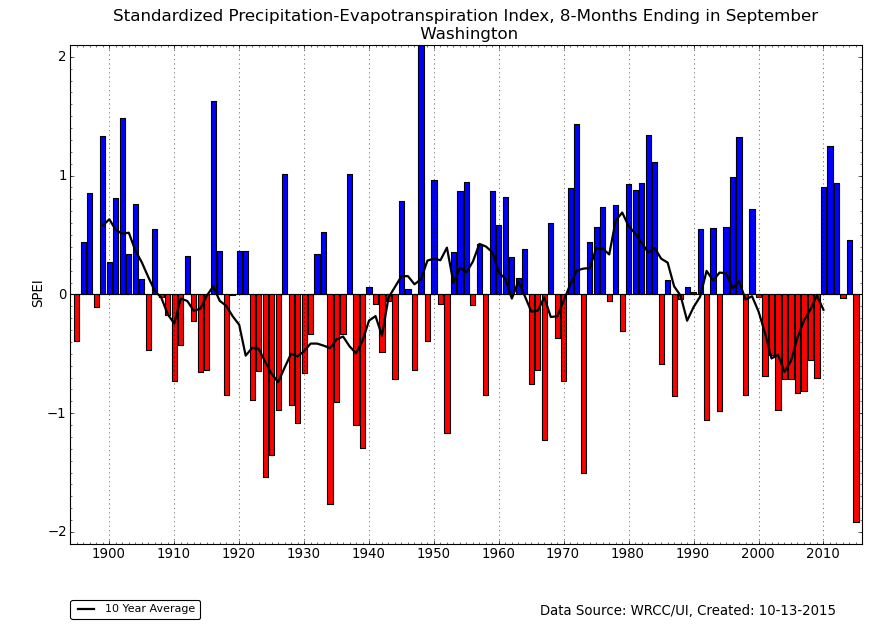
Standardized Precipitation Evapotranspiration Index
The SPI measures water supply (precipitation), while the SPEI (Standardized Precipitation Evapotranspiration Index) measures the combination of water supply (precipitation) and water demand (evapotranspiration as computed from temperature). Warmer temperatures tend to increase evapotranspiration, which generally makes droughts more intense.
 |
 |
During September 2015, temperatures were below normal across parts of the Northwest and Southeast, but above normal across the rest of the country and much above normal from the Southwest and across the Great Plains to the Northeast. The warmer-than-normal temperatures amplified the dry conditions in the High Plains and West when the 1-month SPEI is compared to the SPI. The combination of heat and dryness of the last several months has been so severe that Washington has had the most extreme SPEI in the 1895-2015 record at several time scales this year (6, 7, 8, 9, 10 months).
 |
 |

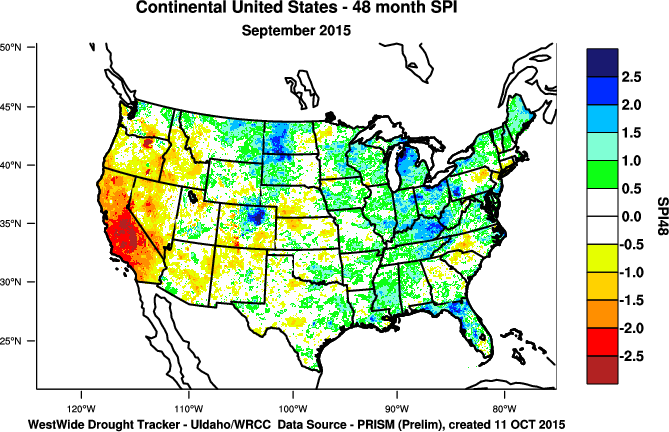
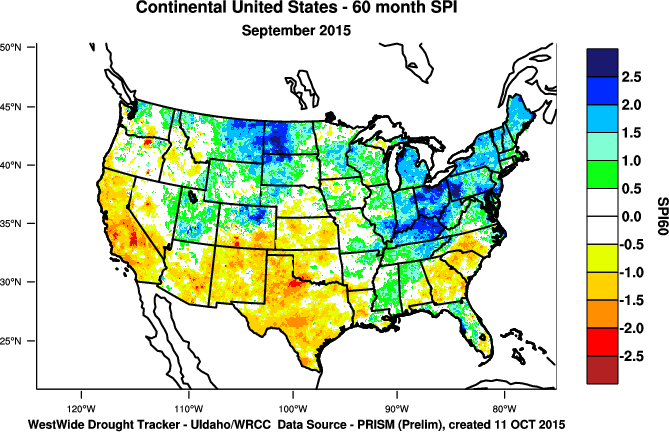
48-month SPEI for current month.
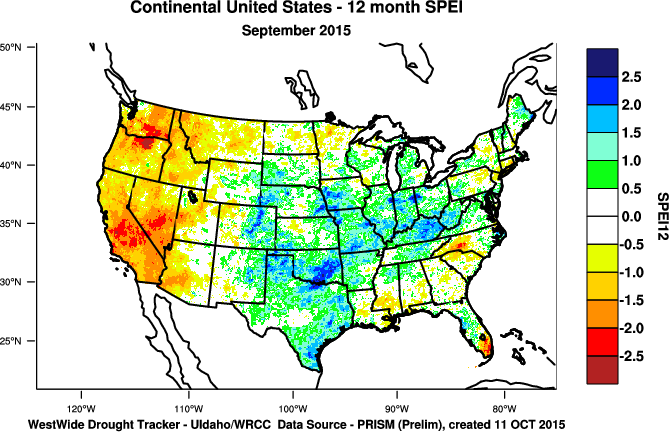
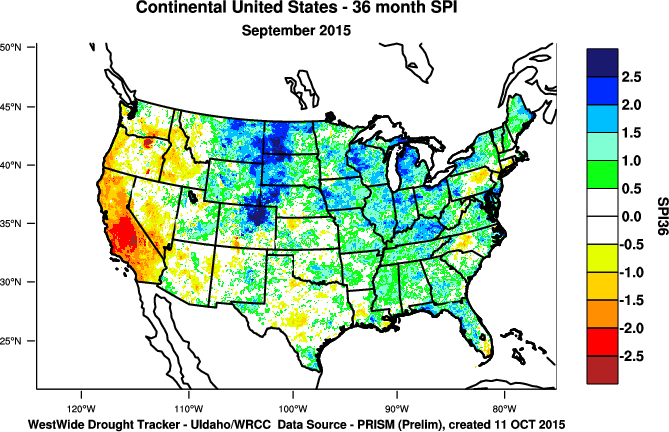
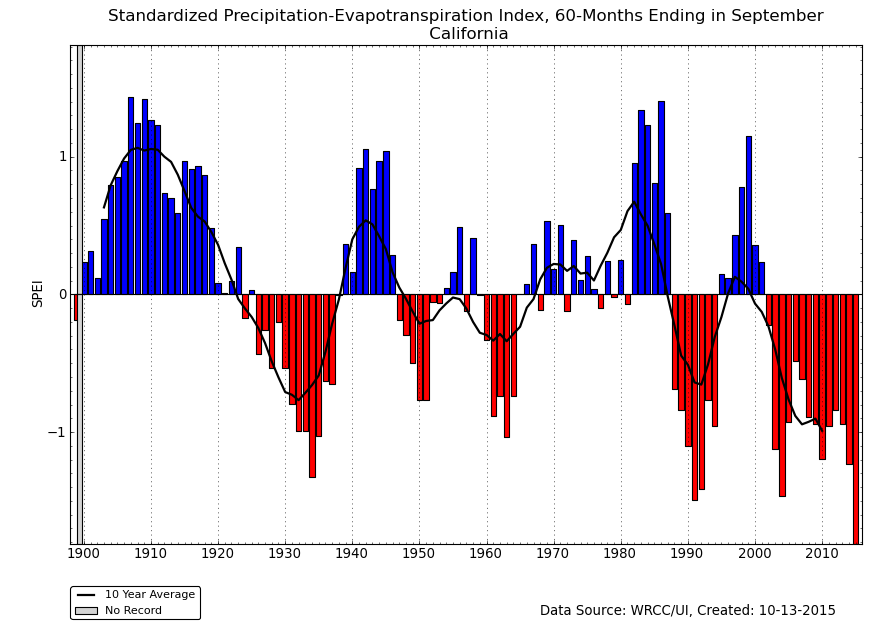
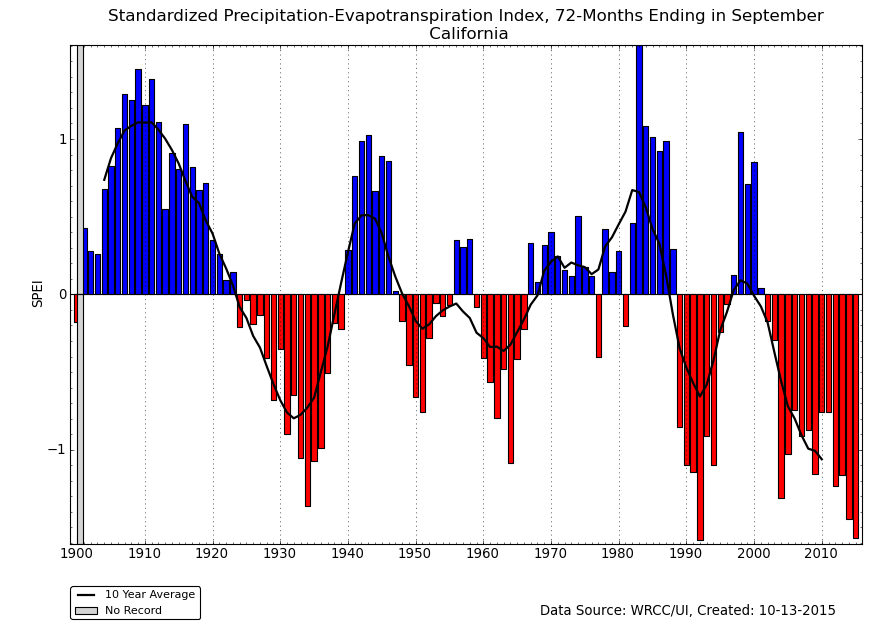
The persistent above-normal temperatures in the West have resulted in more severe SPEI values, compared to the SPI, for much of the last six years (SPEI maps for the last 2, 6, 12, 24, 36, 48, 60, 72 months) (SPI maps for the last 2, 6, 12, 24, 36, 48, 60, 72 months). The excessive heat has exacerbated drought conditions.
This is especially the case in California, where temperatures have been record warm for the last 12 months and well above average for each of the last four years. In fact, the October-September temperature for 2013-2014 was record warm up to that point, and this year (October 2014-September 2015) far exceeded that record value. The state has had the most severe 24-, 36-, 48-, and 60-month SPEI in the 1895-2015 record. The 72-month SPEI for 2015 almost ties with 1992 as the most severe on record. Even without the heat, the last 48 months have been the driest on record for California, according to the 48-month SPI. The 24- and 36-month SPI both rank as the second driest after last year's values.
 |
 |
Regional Discussion
 |
 |
CONUS Agricultural & Hydrological Impacts:
Drought conditions were reflected in numerous agricultural, hydrological, and other meteorological indicators, both observed and modeled. According to September 28th U.S. Department of Agriculture (USDA) reports, only ten percent of the nation's corn crop, 12 percent of the soybean crop, and 22 percent of the pastures and rangeland were rated in poor to very poor condition. As of September 29th, 23 percent of the nation's hay, 23 percent of the cattle inventory, 23 percent of the winter wheat production, 5 percent of soybean production, and 4 percent of corn production were in drought. But 41 percent of the nation's topsoil and 39 percent of the subsoil were short to very short of moisture (dry to very dry). Most of these statistics were increases compared to the end of August. And conditions varied considerably from state to state.
Drought conditions at the end of the month, as depicted on the September 29th USDM map, included the following CONUS core drought and abnormally dry areas:
- Moderate (D1) to severe (D2) drought covered a large part of the western U.S., with extreme (D3) to exceptional (D4) drought extending from California and Nevada into the Pacific Northwest. —
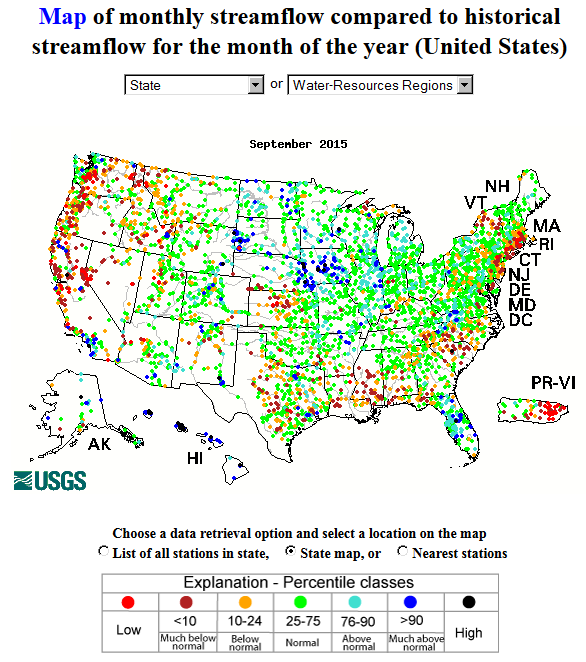
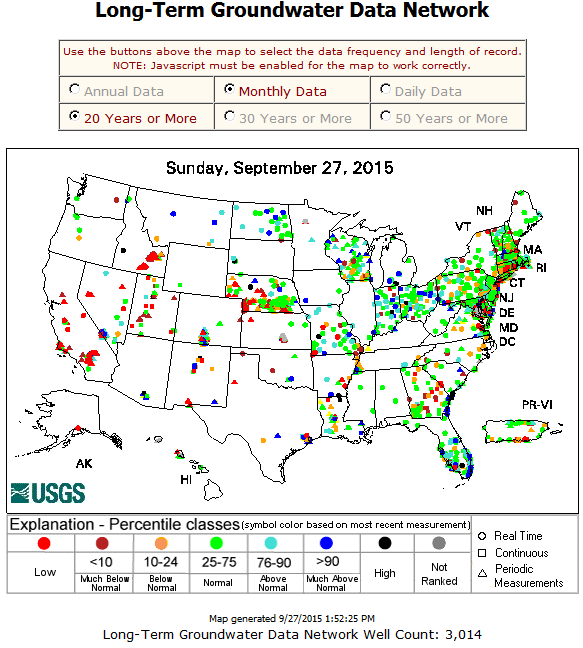
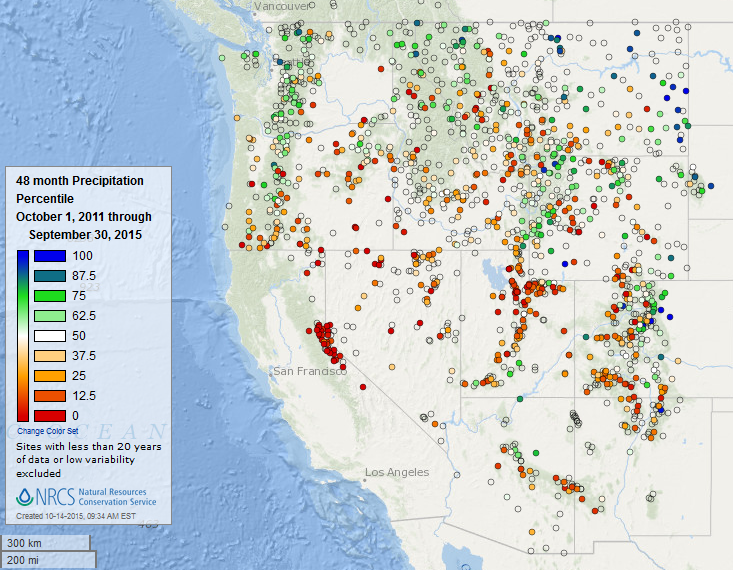
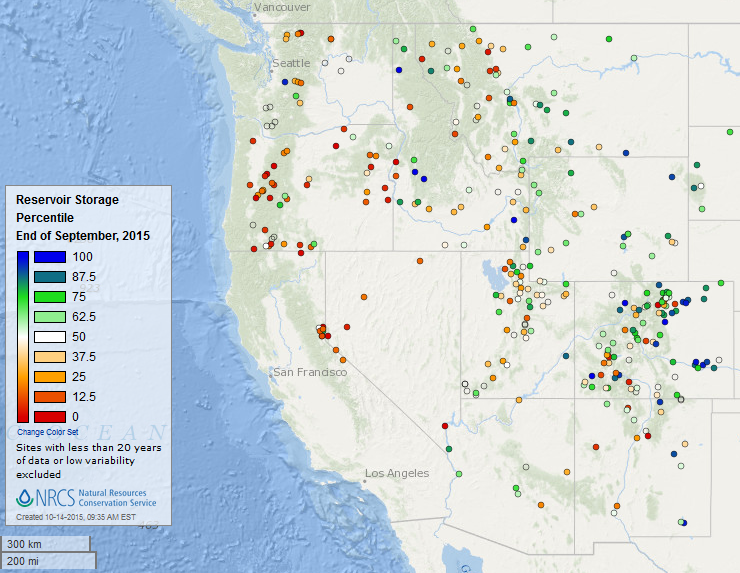
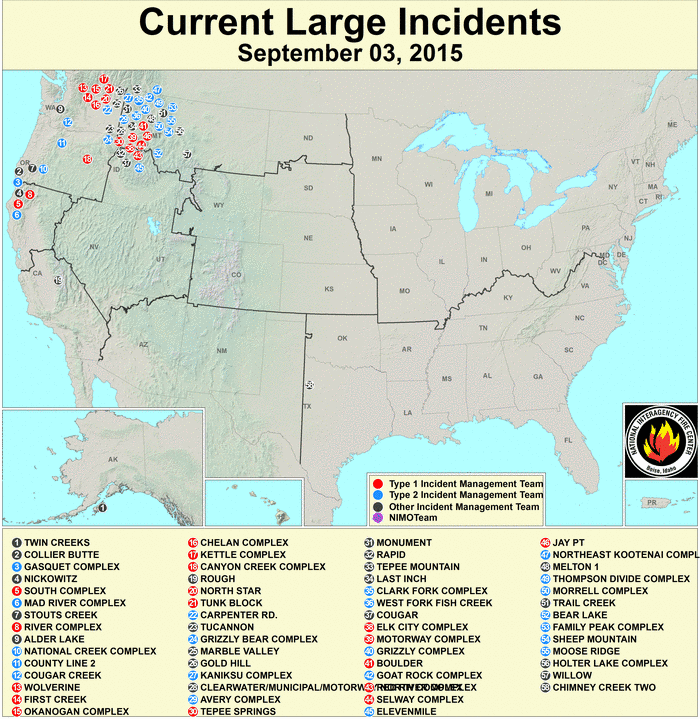
- Although rain fell in parts of the West, mainly coastal Washington and Oregon, and parts of the Northern Rockies and Southwest, improving streamflow on a scattered local basis, the lack of a mountain snowpack earlier this year to provide spring and summer meltwater has resulted in record to near-record low streamflow in other parts of the West. Most of California, Nevada, and the Pacific Northwest had few rainy days with long runs of consecutive dry days. Groundwater across the West is depleted. The rainfall improved soil moisture conditions in some areas, but soil moisture was severely depleted along the West Coast and into the Northern Rockies. The USDA estimated that 95 percent of the topsoil in California, 84 percent in Oregon, 71 percent in Washington, 70 percent in Nevada, and 50 percent or more in Idaho, Montana, New Mexico, and Wyoming was short or very short of moisture. Subsoil moisture conditions were just as dire with 90 percent short or very short in California, 87 percent in Oregon; 70 percent or more in Washington and Nevada; and 50 percent or more in Idaho, Montana, and Utah. Cooler temperature anomalies (especially in the Northwest) reduced evaporative stress (Evaporative Stress Index [ESI] and Evaporative Demand Drought Index [EDDI]) compared to previous months, but vegetation continued to be stressed. September 28th USDA reports indicated that 75 percent of the pastures and rangeland in Washington, 67 percent in Oregon, and 65 percent in California were rated in poor to very poor condition, which are increases compared to four weeks ago. The prolonged duration of the dryness over the last 12 months to four years has severely depleted reservoirs in most western states, especially in Nevada, New Mexico, Oregon, Washington, and California. Cooler temperatures and areas of rain helped diminish the large wildfires which were raging at the beginning of the month.
- Moderate to severe drought continued in the Southeast, although its extent was significantly reduced. —
- As the month progressed, precipitation deficits continued to build in the Southeast (weeks 1, 2, 3, 4) so that, by the end of the fourth week, severe to extreme short-term dryness had developed, with moderate to severe drought covering much of the Carolinas. But during the last few days of the month (and continuing into October), a complex upper-level low pressure system and surface front triggered widespread beneficial rains which improved drought conditions by the end of September. Before the end-of-month and early October rains, drought impacts were manifested by low streamflows, reduced groundwater, and stressed vegetation, especially in the Carolinas. September 27th USDA reports indicated that 38 percent of the topsoil and 49 percent of the subsoil in South Carolina, and 28 percent of the topsoil and 37 percent of the subsoil in North Carolina, were short or very short of moisture. These values are improvements compared to the previous month, and they improved even more as October progressed. Before the heavy end-of-month rains, 45 percent of the pastures and rangeland in North Carolina, and 18 percent in South Carolina, were rated in poor to very poor condition.
- Abnormally dry conditions with moderate to extreme drought continued to expand in the Southern Plains and Lower Mississippi Valley. —
- These "flash drought" conditions expanded due largely to continued hot and dry conditions this month. Parts of Texas and Arkansas had little to no rain, with long runs of consecutive dry days. Soils continued to dry out, with the USDA estimating about two-thirds or more of the topsoil in Arkansas, Louisiana, Mississippi, and Texas, and more than half in New Mexico and Oklahoma, short or very short of moisture. More than two-thirds of the subsoil was short or very short of moisture in Arkansas, Mississippi, and Texas, with more than half short or very short in Louisiana and Oklahoma. The above-normal temperatures increased evaporation (EDDI, ESI) which, along with the lack of rainfall, stressed vegetation. The Palmer Crop Moisture Index (CMI) expanded and increased in severity as the month wore on (weeks 1, 2, 3, 4, 5). Thirty percent or more of the pastures and rangeland in Louisiana, Mississippi, and Texas were rated in poor to very poor condition, and large wildfires were beginning to develop, by the end of the month. In western Texas, reservoir levels were beginning to decline.
- Abnormally dry to moderate drought conditions expanded in the Northeast. —
- Like the Southeast, much of the Northeast was drier than normal for most of the month, but rains near the end of the month brought monthly totals near to above normal. Well above-normal temperatures increased evaporation which stressed vegetation. Before the end-of-month rains, soil moisture was becoming depleted; streamflow levels were much below normal, especially along the coast where long-term dry conditions were evident; groundwater levels were decreasing; and there were long runs of consecutive dry days, again, especially along the coast. As of September 27th, the USDA estimated that over 50 percent of the topsoil was short or very short of moisture in Connecticut, Delaware, New Jersey, Pennsylvania, and Rhode Island, and 50 percent or more of the subsoil was short or very short in Deleware, Pennsylvania, and Rhode Island. Over 50 percent of the pastures and rangeland were rated in poor to very poor condition in Connecticut.
- Pockets of abnormally dry to moderate drought conditions remained in parts of the Midwest and Central to Northern Plains. —
- Groundwater and soil moisture deficits were evident in places, with low streamflow levels and some stressed vegetation noted in central Kansas. The USDA estimated about 58 percent of the topsoil in Kentucky, and 40 percent or more in Kansas, Missouri, Indiana, and Ohio, short or very short of moisture.
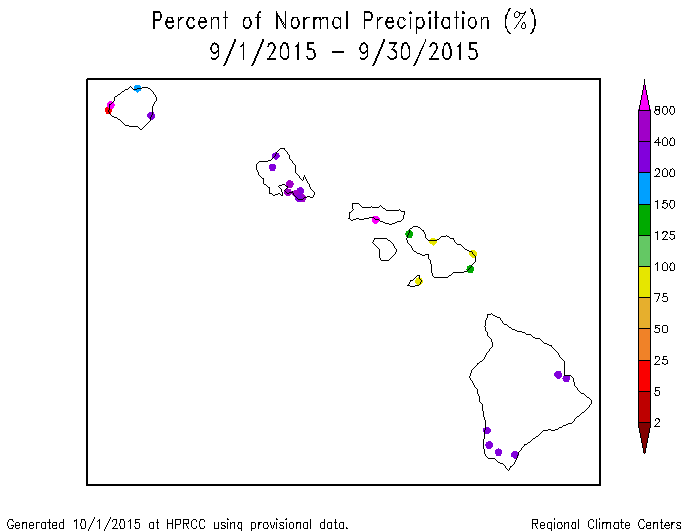
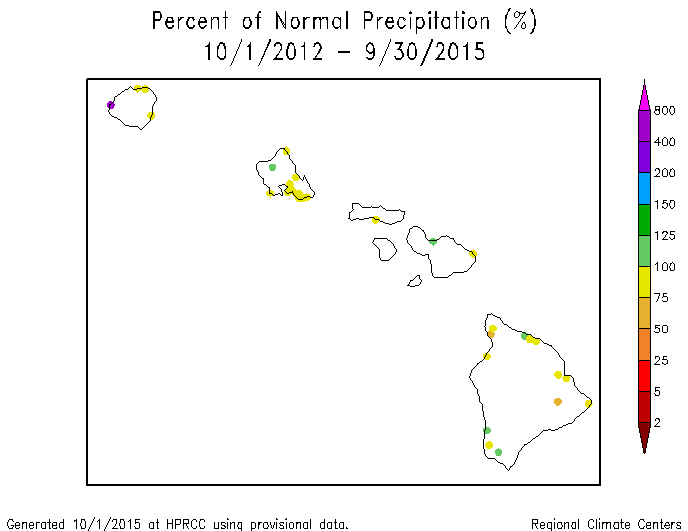
Hawaii: September 2015 was wetter than normal at most of the stations in Hawaii. Precipitation during the last several months has resulted in a wet pattern for the last 2, 3, 6, and 9 months for most stations. Dryness was evident for several stations at the 12 and 24 month time scales, and at the 36 month time scale for most of the stations across the islands. On the USDM map, drought disappeared and abnormal dryness decreased to about three percent of the state.

![Evaporative Stress Index [ESI]](/monitoring-content/sotc/drought/2015/09/usda-ndmc-noaa-ESI-0930.jpg)
![Evaporative Demand Drought Index [EDDI]](/monitoring-content/sotc/drought/2015/09/eddi_usdm_30day_2015-09-29.png)
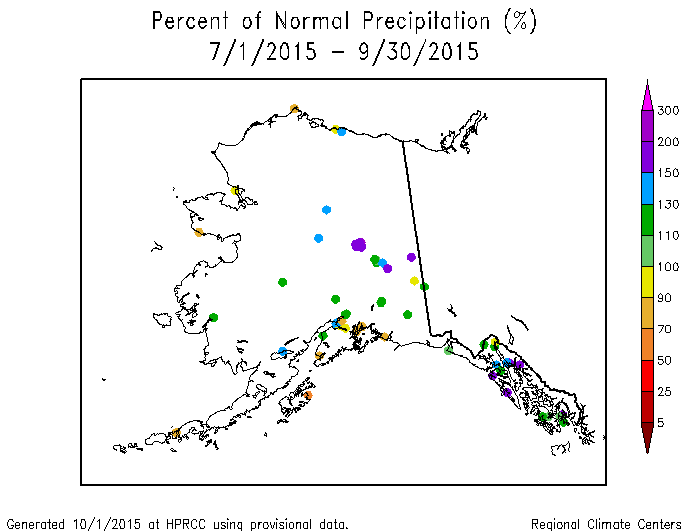
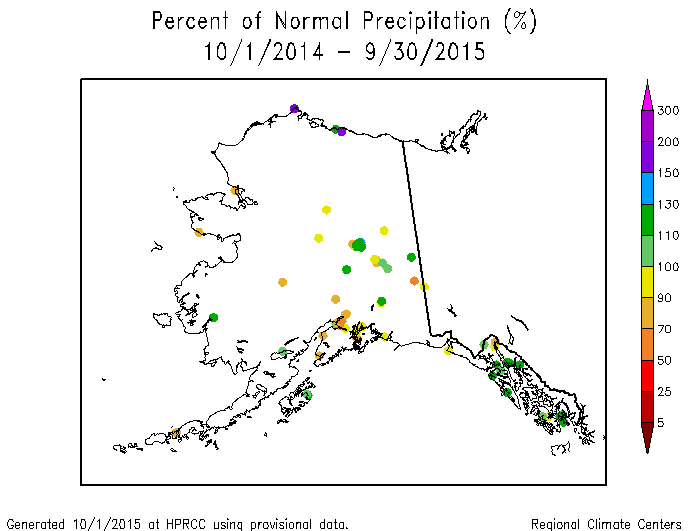
Alaska: Alaska was generally drier than normal at the northern and western coastal stations and interior southeast stations, and wetter than normal elsewhere. September was generally cooler than normal. A wetter-than-normal pattern dominated at the 2-, 3-, 6-, and 9-month time scales, but a drier-than-normal became evident at interior stations at longer time scales (last 12, 24, and 36 months). Similar precipitation percentile patterns were evident at the higher-elevation SNOTEL stations (last 1 and 12 months) and Alaska climate division maps (last 1 and 9 months). The September temperature anomaly pattern held for the last 2 to 3 months, with some mixing of temperature anomalies at the interior and southern stations, but warmer-than-normal temperature anomalies dominated the state at longer time scales, both on the station maps (last 9 and 12 months) and climate division maps (last 9 months). The above-normal precipitation helped to improve soil moisture conditions, although soils remained drier than normal along the south central coast. Moderate drought contracted to cover about four percent of the state, with abnormal dryness and drought down to 42.6 percent, on the September 29th USDM map.
Puerto Rico: El Niño-enhanced dryness continued across the Caribbean during September 2015. Northwestern Puerto Rico received above-normal rainfall, but the eastern and southern portions continued drier than normal during the month. A pattern of drier-than-normal conditions in the south and east, and wetter-than-normal conditions in the northwest, has dominated much of the last year (last 2, 3, 6, 9, 12 months). The dryness was reflected in low to record low streamflow in the streams on the eastern half and southern portions of the island, as well as continuing water restrictions. The rain that did fall during September helped to improve soil moisture conditions across the islands and lake levels at some water supply reservoirs. On the September 29th USDM map, abnormal dryness and drought shrank to about 70.5 percent of Puerto Rico, with moderate to extreme drought contracting to 45.2 percent of the island. This included 14.7 percent in the extreme drought category.
CONUS State Precipitation Ranks:
|
|
|
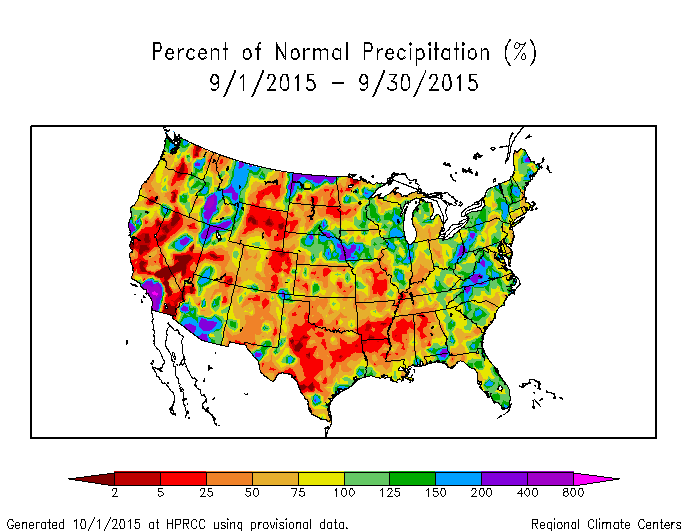
The September precipitation anomaly pattern of dryness in the central part of the CONUS was reflected in the state ranks, with 12 states ranking in the driest third of the historical record. Spotty above-normal precipitation fell over parts of the western states, which tempered their ranks. Arkansas had the eleventh driest September in the 1895-2015 record.
Louisiana statewide precipitation, July-September, 1895-2015.
The last three months were drier than normal across the Southern Plains to Lower Mississippi Valley. The rest of the CONUS had a patchwork mixture of above- and below-normal precipitation. Louisiana had the third driest July-September, while it was the eleventh driest in Connecticut and Texas. Six other states ranked in the driest third of the historical record for July-September.
|
|
|

Washington statewide precipitation, April-September, 1895-2015.

California statewide precipitation, January-September, 1895-2015.
The last six months were drier than normal in the Far West, Pacific Northwest, and parts of the South, Southeast, and New England. Washington had the fifth driest April-September and Connecticut the tenth driest. Six other states ranked in the driest third of the historical record for April-September.
A similar pattern of dryness extended to the year to date. California had the fourth driest January-September, Oregon the fifth driest, and Connecticut the seventh driest. Ten other states ranked in the driest third of the historical record for January-September. This year marks the fourth consecutive year-to-date with much below-average precipitation for California, and eleven of the last 15 years have been below average. Half of the last 16 year-to-date periods have been much drier than average in Oregon. Three of the last four year-to-date periods have been much drier than average in Connecticut.
A similar pattern of dryness extended back to the last twelve months — areas of dryness in the West, Central to Northern Plains, Lower Mississippi Valley, Southeast, and Northeast, with patchy wet areas mixed in between. Seven states (mostly in the West, plus Connecticut) ranked in the driest third of the historical record.

|

|

Percent area of the Western U.S. in moderate to extreme drought, January 1900 to present, based on the Palmer Drought Index.
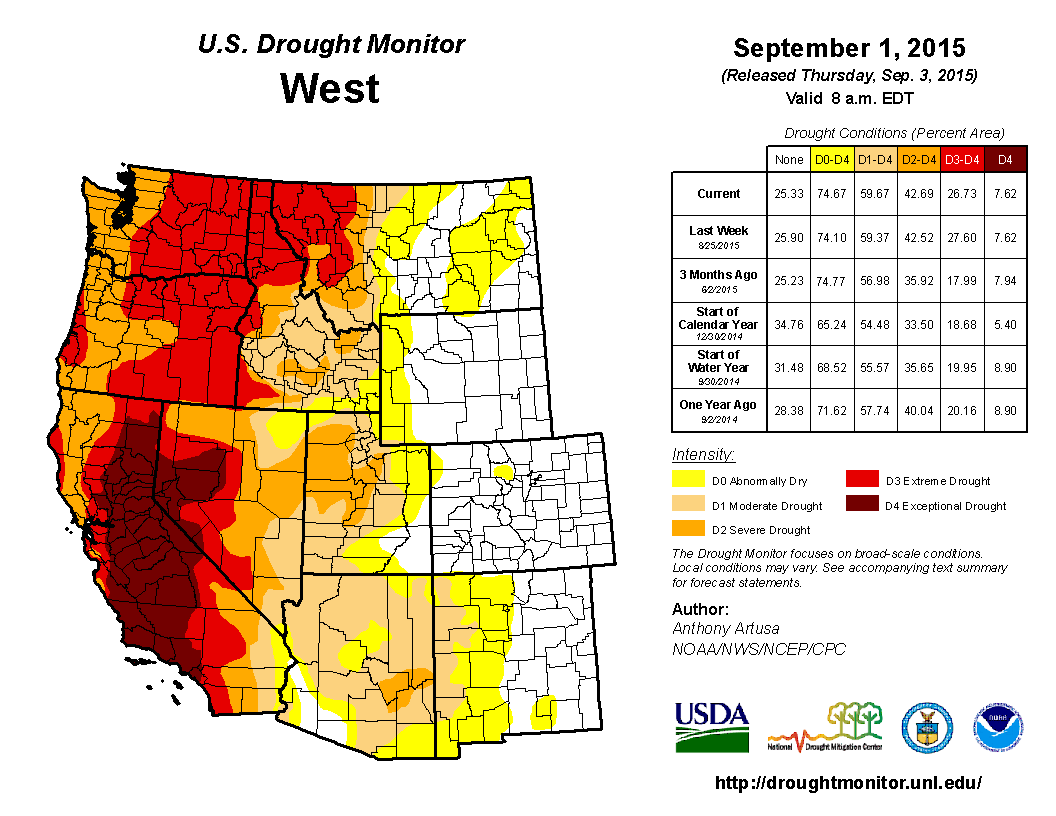
As noted above, dry weather has dominated the West for much of the last four years, resulting in significant hydrological (low lake, reservoir, and stream levels) and agricultural impacts. According to the USDM, 57.8 percent of the West was experiencing moderate to exceptional drought at the end of September, which is a little less than the previous month. The Palmer Drought Index percent area statistic for the West was 55.6 percent, which is slightly more than the previous month.
Except for an occasional interruption, the dryness has been accompanied by unusually and persistently hotter-than-normal weather. Upper-level troughs kept September temperatures near to cooler than normal in the Pacific Northwest, but an upper-level ridge brought much warmer-than-normal temperatures to the rest of the West as well as the central CONUS to Northeast. Colorado, New Mexico, and Utah had the warmest September on record. Persistent ridging over the West for much of the last twelve months has resulted in the warmest April-September for Oregon and Washington, and warmest January-September and October-September for California, Nevada, Oregon, and Washington. Most of the other states in the West ranked in the top ten category for these periods. When temperatures are integrated across the West (Rockies to West Coast), temperatures have been record warm for the last 12 months, last 24 months, and last 36 months. These graphs also show an alarming increasing trend in region-wide temperatures over the last 35 years.
 |
 |
Climate Extremes Index for the West Region, September, 1910-2015.
The combination of persistent extreme warmth and extreme dryness across the West has resulted in a record to near-record Climate Extremes Index (CEI). The CEI aggregates temperature and precipitation extremes across space and time and is a good measure for this aspect of climate. The West region had the third most extreme September CEI on record due to the fifth most extreme warm minimum and twelfth most extreme warm maximum temperature components, second most extreme drought component, and third most extreme 1-day precipitation component. Very high values for these same components gave the West region the fifth most extreme July-September CEI in the 1910-2015 record, second most extreme April-September CEI, and third most extreme January-September CEI. For the water year (October 2014-September 2015), the most extreme warm minimum and warm maximum temperature components and most extreme drought component gave the West region the most extreme October-September CEI on record.
 |
 |
March serves as the beginning of the growing season for the Primary Corn and Soybean agricultural belt. The region had a generally mixed precipitation pattern this month, with September 2015 ranking as the 37th driest and seventh warmest September in the 1895-2015 record, regionwide. The growing season to date ranked as the seventh wettest and 25th warmest March-September on record, regionwide.
 |
 |
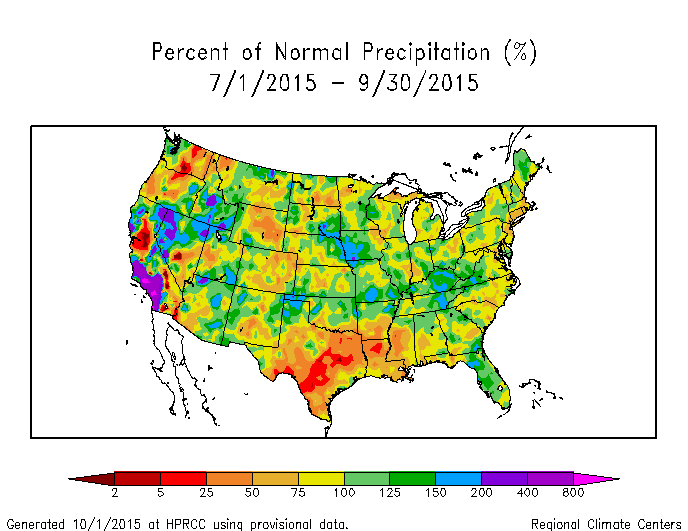
October serves as the beginning of the growing season for the Primary Hard Red Winter Wheat agricultural belt. Precipitation that falls during the July-September period can replenish soil moisture reserves which will help the next season's crop become established. The region had a generally mixed precipitation pattern for this period, with July-September 2015 ranking as the 57th wettest and 26th warmest July-September in the 1895-2015 record, regionwide. The last 12 months ranked as the eleventh wettest and 19th warmest October-September on record, regionwide.
NOAA Regional Climate Centers:
A more detailed drought discussion, provided by the NOAA Regional Climate Centers and others, can be found below.
West
As described by the High Plains Regional Climate Center, September was a record-setting month for much of the High Plains region and beyond. The jet stream stayed well to the north of the region in Canada, which allowed for unseasonably warm temperatures. It was a fairly dry month across the region, with large areas receiving little to no precipitation. The exceptions to the dryness included western Wyoming, western and northern North Dakota, and an area stretching from north-central Nebraska/south-central South Dakota to the east into eastern Nebraska and western Iowa. Overall, the generally warm and dry conditions were good for producers as these helped progress the maturity of late planted crops, aided in the dry down process, and allowed for fall harvesting and/or planting activities to begin. According to the United States Department of Agriculture (USDA), record corn and soybean yields are expected in both Nebraska and South Dakota, while record hard spring wheat yields are forecast for North Dakota.
The drier conditions across the High Plains region this month led to some changes in the USDM. While not a major change, the total area in drought (D1-D4) in the region did increase to just under one percent. At the end of the month, two areas of moderate drought conditions (D1) were present — one in the far southwest corner of Wyoming and the other in northwestern Kansas. The small area of drought in Wyoming has persisted for several months; however, the drought area in Kansas developed over the past month due to warm and dry conditions. At the end of last month, Kansas was drought free for the first time since 2010. Unfortunately, this drought free period did not last long. Elsewhere, abnormally dry conditions (D0) developed or expanded in portions of all the states in the High Plains region. This included central and eastern Colorado, eastern Wyoming, western and southern Nebraska, southwestern South Dakota, and eastern North Dakota. While D0 does not indicate drought, it does show areas that should be monitored for possible development. D0 now encompasses almost 25 percent of the region. Taking a look to the west shows that extreme drought conditions (D3) improved slightly in northwestern Montana, while moderate (D1) and severe (D2) drought conditions expanded slightly.
As explained by the Southern Regional Climate Center, September temperatures in the Southern region were much warmer than normal, particularly in western Texas and western Oklahoma. It was a drier than normal month for all states in the Southern region, and an extremely drier than normal month for the majority of counties in central Texas, northern Louisiana, northern Mississippi, southern Arkansas and southern Oklahoma. Precipitation totals in the central portions of the region ranged from zero to twenty-five percent of normal. Drier than normal conditions, combined with above average temperatures, created a recipe for drought expansion across the central portions of the Southern region. Over the month of September, the areal coverage of drought in the region increased by approximately thirteen percent. More dramatically, the amount of extreme drought increased by over five percent. As of September 29, 2015, extreme drought is located in the Arkansas-Louisiana-Texas border region, where conditions have been unusually dry. Similar drought patterns can be observed in east central Texas and in central Mississippi.
As summarized by the Midwest Regional Climate Center, precipitation in September was below normal for the Midwest as a whole, and the average temperatures were well above normal in the upper Midwest and ranged to just above normal in the southeast portions of the region. Drought was persistent in September for a few counties in the southwest corner of Wisconsin. New areas of drought emerged in Kentucky and southeast Indiana in the latter half of the month. The area affected by drought was only about 1 percent of the region while abnormally dry conditions were in place for roughly 20 percent of the Midwest. Generally warm and dry conditions in many locations allowed for harvest to begin. Soybean harvest was ahead of the 5-year average pace in all but Iowa and Wisconsin where it was about 5 to 10 percent behind. Corn harvest trailed the 5-year average by 5 to 10 percent in all nine states. Crop conditions for both corn and soybeans remained steady during the month with no big departures, for the better or the worse, from August reports. Wheat planting was running close to average in the region.
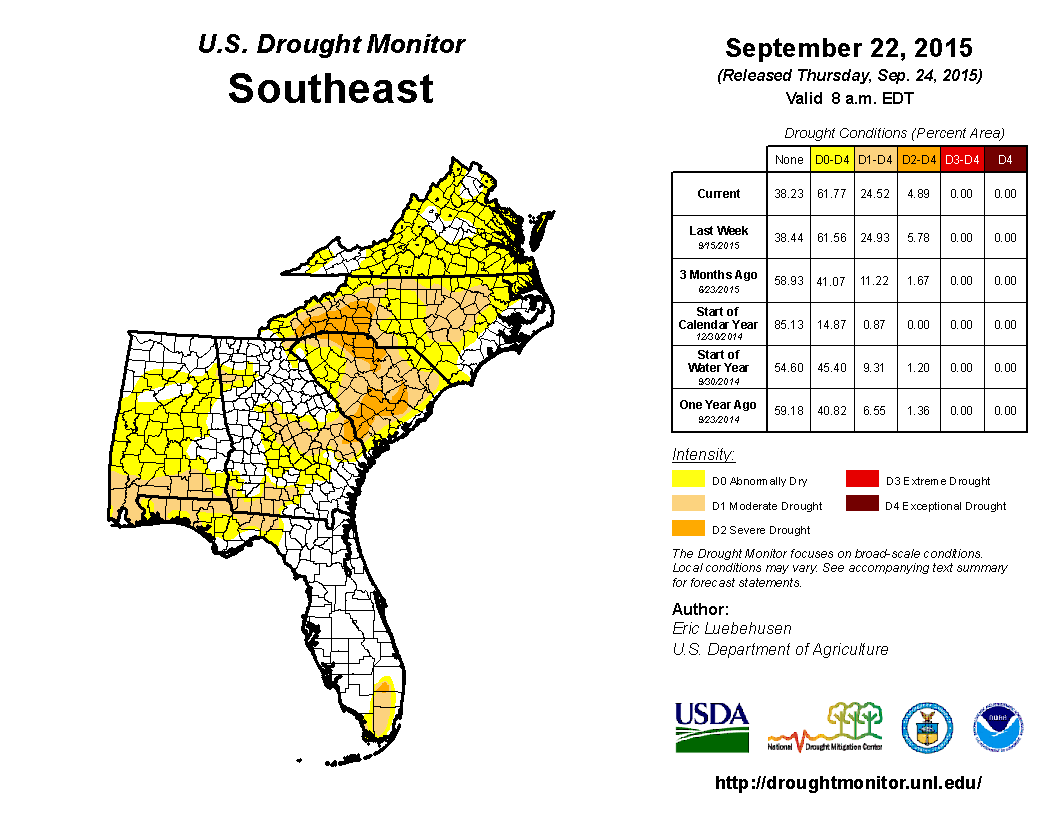
As noted by the Southeast Regional Climate Center, temperatures were near average to above average across much of the Southeast region during September and precipitation was highly variable. The driest locations were found across central and northern Alabama as well as portions of east-central Georgia and southeastern North Carolina, where monthly precipitation totals were between 10 and 50 percent of normal. Precipitation was also below normal across much of Puerto Rico and the U.S. Virgin Islands, where Coloso, PR (1905-2015) observed its fourth driest September on record with 4.02 inches (102 mm) of precipitation.
Drought conditions improved substantially across much of the Southeast region during September. The percentage of the region under drought-free conditions (less than D1) increased significantly from 76 percent on the 1st to 88 percent on the 29th. Drought improvement was especially prevalent across the Carolinas during the final week of the month, where the coverage of moderate-to-severe (D1-D2) drought conditions decreased from 41 (66) to 18 (32) percent across North and South Carolina, respectively. The localized area of extreme (D3) drought in far southern Florida was completely eliminated by the end of the month, and moderate drought was partially ameliorated in portions of central Georgia, southern Alabama, and the Florida Panhandle. In addition, the coverage of extreme drought conditions across eastern Puerto Rico decreased from 25 to 15 percent by the end of September. Abundant rainfall during the latter half of the month increased soil moisture levels and aided in the planting of winter wheat and rye across portions of Florida and Georgia. However, the harvesting of several field crops, including cotton, peanuts, and soybeans, was delayed due to the persistent rainfall extending from northern Florida to Virginia.
As explained by the Northeast Regional Climate Center, the Northeast had its second warmest September on record and two heavy rain events, one mid-month and one the last two days of the month, tipped September over to the wet side of normal. At the beginning of September, 24 percent of the Northeast was abnormally dry, with 3 percent of the region experiencing moderate drought. Above-normal temperatures and below-normal precipitation during the month contributed to declining soil moisture and low streamflows. With that, abnormal dryness expanded to 53 percent of the region, while moderate drought expanded to 6 percent of the region, according to the USDM released on September 24.
September's weather had numerous impacts. USDA reports indicated that some pastures were very dry and that various crops were smaller in size due to lack of water; however, pumpkins ripened earlier than usual due September's warmth and harvest was ahead of schedule in several areas. Falling water levels in reservoirs and wells led to voluntary and mandatory water restrictions in parts of New England, New York, and New Jersey. The prolonged warmth in September delayed the onset of the fall foliage season across much of the Northeast, with delays of up to two weeks in New England.
As summarized by the Western Regional Climate Center, after a three-month streak of above normal temperatures, a few low pressure systems brought cooler air to the Pacific Northwest this month. Elsewhere in the West, warmer temperatures dominated. Remnants of tropical storms interacting with upper-level low pressure systems produced above normal precipitation in scattered areas of the West. Mid-month, the remnants of Hurricane Linda interacting with an upper level low brought precipitation to several areas. Moisture was dragged northeastward, bringing precipitation to areas of Utah, Idaho, and western Montana in association with this moisture plume. Towards the end of the month, remnants of Tropical Depression 16E moved across the southwest boosting monthly precipitation totals across southeastern Arizona and New Mexico. This precipitation helped to erase drought conditions along the southern Arizona and New Mexico borders. The monsoon season, which began on June 15, was average this year with most of Arizona and New Mexico receiving 75-125% of normal precipitation. Much of the precipitation did not result from a traditional Southwest Monsoon pattern setting up in the atmosphere and bringing moisture from the Gulf of Mexico, but from the availability of moisture from the remnants of tropical storms.
Some areas of the West received little precipitation, which is not unusual for September. Sacramento, California received no precipitation this month (normal is 0.35 in /9 mm), though this has occurred in 38 other years in Sacramento's 139-year record. Several areas east of the Rockies saw a drier than normal September as well. Buffalo, in north-central Wyoming recorded 0.11 in (3 mm) for the month, 8% of normal. Areas of eastern Colorado and Wyoming moved into the USDM's "abnormally dry" category. No other areas of drought degradation were observed in the West this month.
An active hurricane season in the central and eastern Pacific supported a wetter than normal September for much of the Hawaiian Islands. Record or near record September precipitation was observed at several locations. Honolulu had its wettest September on record at 4.48 in (114 mm), 2.08 in (53 mm) greater than the previous record set in 1947. Records for Honolulu began in 1940. Further north, temperatures across Alaska were slightly cooler than normal this month with the greatest departures in the Interior of 2-4 F (1-2 C) below normal. Much of South Central and Interior Alaska was wetter than normal. Unusually early snow fell in Fairbanks on the 13th and in Anchorage on the 18th, blanketing elevated terrain in these areas with several inches of snow. The last early occurrence of snow was 1992 in Fairbanks and 1993 in Anchorage.
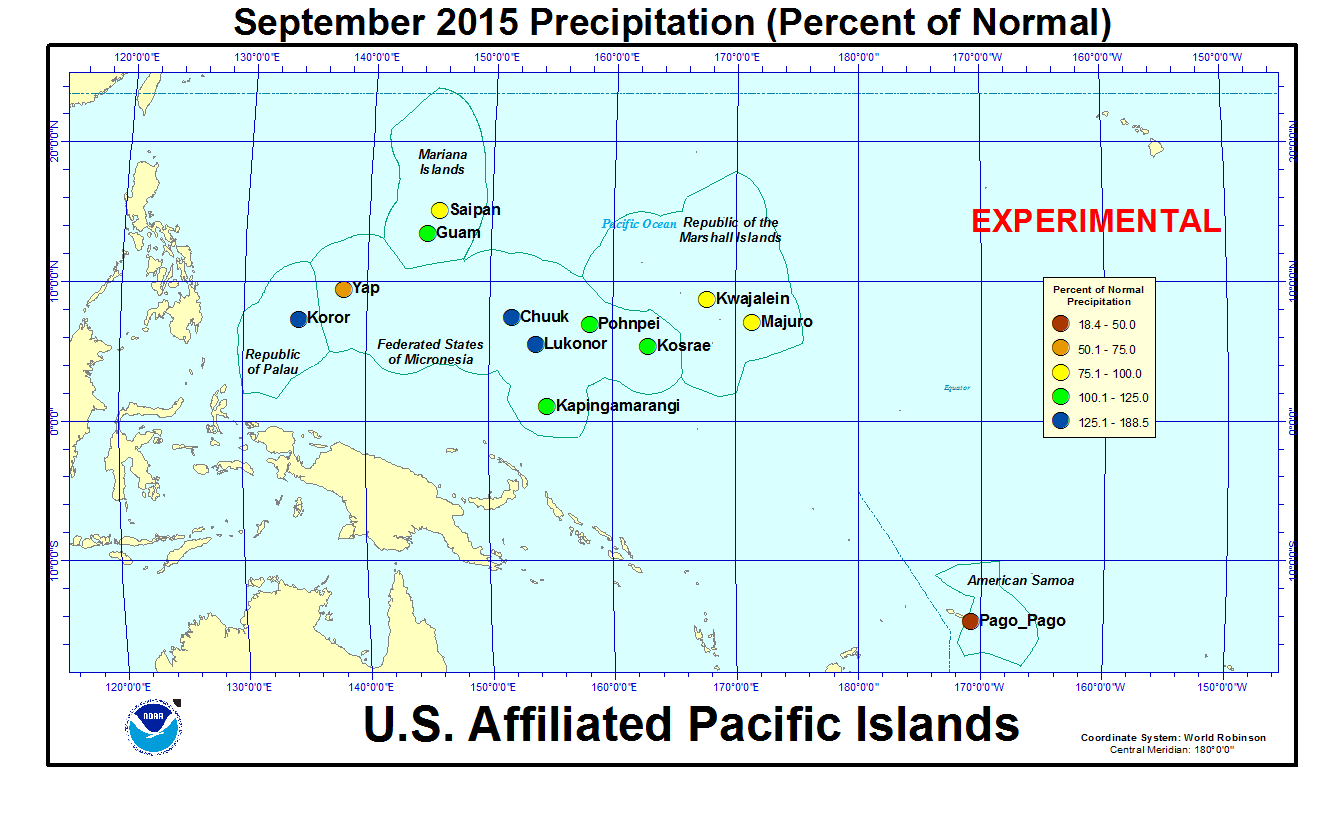
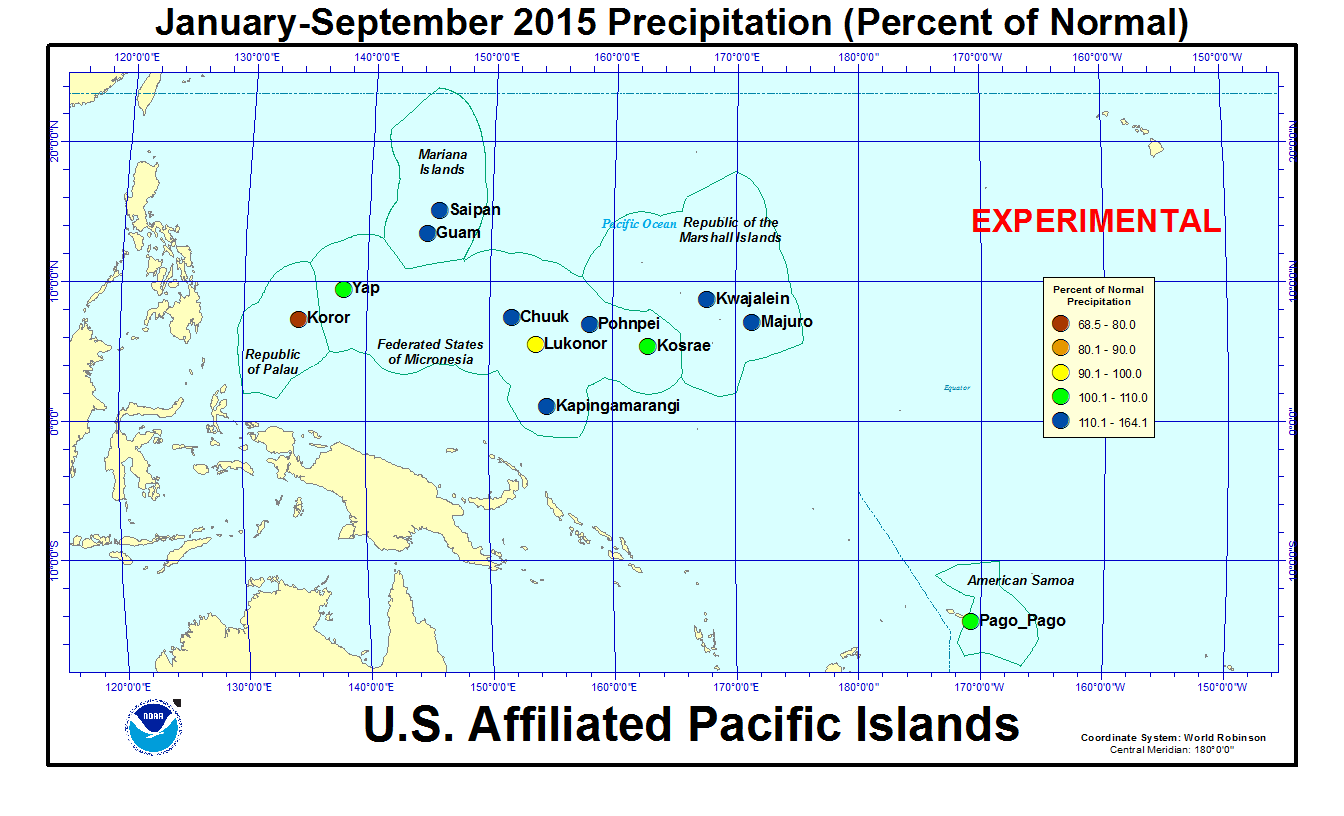
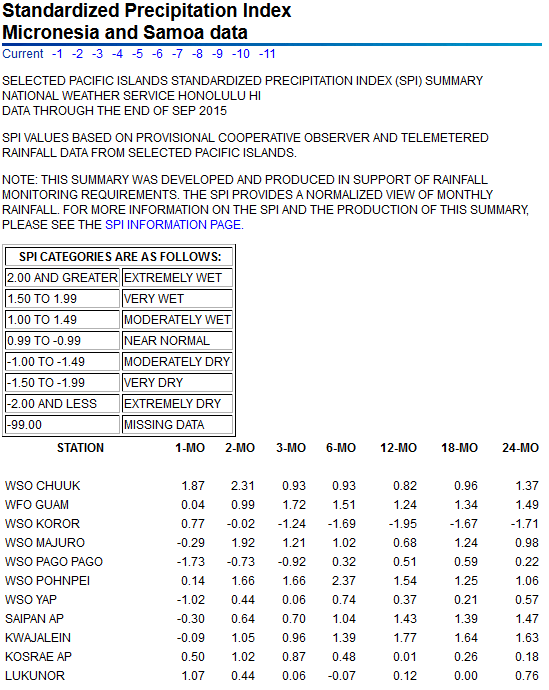
Pacific Islands: According to reports from National Weather Service offices, the Pacific ENSO Applications Climate Center (PEAC), and partners, conditions varied across the Pacific Islands.
In the U.S. Affiliated Pacific Islands (maps — Micronesia, Marshall Islands, basinwide), September 2015 was drier than normal at Kwajalein, Majuro, Pago Pago, Saipan, and Yap, and wetter than normal at the rest of the primary stations.
Rainfall amounts were below the minimum thresholds (4 or 8 inches) required to meet most monthly water needs at stations in the Marshall Islands and American Samoa. These included Ailinglapalap, Jaluit, Mili, Wotje, and Pago Pago. Jaluit recorded 7.02 inches, marking the eighth out of the last ten months that have been drier than 8 inches. The 4- and 8-inch thresholds are important because, if monthly precipitation falls below the threshold, then drought becomes a concern.
Pago Pago measured only 1.20 inches of rain in September, which is the third consecutive month drier than 8 inches. Dead and desiccated foliage has been observed in the southeast quarter of the island, with brown grass across the Samoan islands. According to an October 2nd drought statement issued by the National Weather Service, there have been reports of decreasing levels in water wells and increasing chloride readings in the well water, indicating sea water intrusion.
As measured by percent of normal precipitation, Pago Pago and Yap have been drier than normal in the short term (September and the last 3 months [July-September 2015]), but near normal in the long term (year to date [January-September 2015] and last 12 months [October 2014-September 2015]). Saipan, Majuro, and Kwajalein were drier than normal for September but wetter than normal at the other three time periods. Kapingamarangi was drier than normal for the last three months, but wetter than normal at the other three time periods. Kosrae was drier than normal at the 12-month time scale, but near to wetter than normal at the other three time periods. Koror and Lukonor were wetter than normal for September, but drier than normal at the other three time periods. Guam, Chuuk, and Pohnpei were wetter than normal at all four time scales.
| Station Name | Oct 2014 | Nov 2014 | Dec 2014 | Jan 2015 | Feb 2015 | Mar 2015 | Apr 2015 | May 2015 | Jun 2015 | Jul 2015 | Aug 2015 | Sep 2015 | Oct- Sep |
|---|---|---|---|---|---|---|---|---|---|---|---|---|---|
| Chuuk | 120% | 66% | 57% | 142% | 134% | 209% | 104% | 89% | 172% | 54% | 155% | 188% | 117% |
| Guam NAS | 164% | 75% | 76% | 213% | 6% | 198% | 263% | 291% | 86% | 215% | 146% | 108% | 121% |
| Kapingamarangi | 130% | 140% | 116% | 229% | 131% | 62% | 87% | 173% | 161% | 54% | 162% | 112% | 111% |
| Koror | 63% | 54% | 118% | 64% | 83% | 69% | 74% | 33% | 107% | 27% | 73% | 143% | 69% |
| Kosrae | 114% | 68% | 86% | 116% | 114% | 91% | 92% | 84% | 143% | 108% | 138% | 115% | 88% |
| Kwajalein | 154% | 96% | 68% | 74% | 149% | 994% | 322% | 204% | 117% | 104% | 171% | 95% | 153% |
| Lukonor | 138% | 70% | 86% | 228% | 97% | 99% | 83% | 89% | 136% | 77% | 75% | 149% | 94% |
| Majuro | 88% | 66% | 67% | 106% | 63% | 329% | 162% | 171% | 57% | 87% | 207% | 96% | 116% |
| Pago Pago | 29% | 136% | 141% | 201% | 102% | 64% | 153% | 172% | 170% | 72% | 125% | 18% | 106% |
| Pohnpei | 100% | 108% | 104% | 78% | 100% | 138% | 119% | 219% | 108% | 138% | 199% | 124% | 128% |
| Saipan | 105% | 265% | 47% | 184% | 14% | 315% | 203% | 341% | 115% | 112% | 141% | 92% | 134% |
| Yap | 77% | 84% | 197% | 92% | 89% | 93% | 139% | 235% | 92% | 82% | 148% | 68% | 107% |
| Station Name | Oct 2014 | Nov 2014 | Dec 2014 | Jan 2015 | Feb 2015 | Mar 2015 | Apr 2015 | May 2015 | Jun 2015 | Jul 2015 | Aug 2015 | Sep 2015 | Oct- Sep |
|---|---|---|---|---|---|---|---|---|---|---|---|---|---|
| Chuuk | 13.78" | 6.99" | 6.46" | 14.32" | 9.68" | 17.37" | 13.03" | 10.08" | 20.03" | 6.45" | 19.91" | 22.07" | 160.17" |
| Guam NAS | 18.77" | 5.51" | 3.87" | 8.56" | 0.18" | 4.09" | 6.65" | 9.91" | 5.32" | 21.80" | 21.54" | 13.71" | 119.91" |
| Kapingamarangi | 10.64" | 13.02" | 11.37" | 20.91" | 12.19" | 7.05" | 11.82" | 20.84" | 22.14" | 7.71" | 13.14" | 11.08" | 161.91" |
| Koror | 7.45" | 6.12" | 13.14" | 6.48" | 7.07" | 5.11" | 5.42" | 3.96" | 18.66" | 4.98" | 9.90" | 16.88" | 105.17" |
| Kosrae | 12.51" | 9.38" | 13.80" | 19.28" | 14.73" | 14.57" | 16.12" | 14.89" | 20.90" | 16.17" | 19.69" | 16.36" | 188.4" |
| Kwajalein | 17.17" | 10.80" | 4.54" | 2.33" | 3.94" | 23.37" | 16.94" | 13.69" | 8.12" | 10.28" | 16.63" | 10.24" | 138.05" |
| Lukonor | 15.57" | 6.37" | 9.65" | 19.16" | 8.70" | 9.16" | 9.36" | 10.36" | 15.83" | 12.22" | 10.55" | 15.15" | 142.08" |
| Majuro | 11.14" | 8.85" | 7.68" | 8.24" | 4.32" | 21.65" | 15.23" | 17.27" | 6.31" | 9.72" | 24.24" | 10.72" | 145.37" |
| Pago Pago | 2.68" | 13.76" | 18.13" | 26.87" | 12.22" | 6.88" | 14.35" | 16.59" | 9.07" | 3.99" | 6.75" | 1.20" | 132.49" |
| Pohnpei | 15.32" | 15.97" | 16.67" | 10.24" | 9.58" | 18.14" | 21.94" | 43.68" | 16.03" | 21.31" | 28.33" | 15.59" | 232.8" |
| Saipan | 11.15" | 14.87" | 1.80" | 4.66" | 0.35" | 5.95" | 5.34" | 8.11" | 4.15" | 10.00" | 18.51" | 9.26" | 94.15" |
| Yap | 9.34" | 7.40" | 16.77" | 5.86" | 4.60" | 4.22" | 7.80" | 18.41" | 11.07" | 12.39" | 21.99" | 9.21" | 129.06" |
| Station Name | Oct 2014 | Nov 2014 | Dec 2014 | Jan 2015 | Feb 2015 | Mar 2015 | Apr 2015 | May 2015 | Jun 2015 | Jul 2015 | Aug 2015 | Sep 2015 | Oct- Sep |
|---|---|---|---|---|---|---|---|---|---|---|---|---|---|
| Chuuk | 11.51" | 10.61" | 11.25" | 10.10" | 7.25" | 8.32" | 12.47" | 11.30" | 11.66" | 11.98" | 12.86" | 11.71" | 136.77" |
| Guam NAS | 11.44" | 7.38" | 5.11" | 4.01" | 3.03" | 2.07" | 2.53" | 3.40" | 6.18" | 10.14" | 14.74" | 12.66" | 99.09" |
| Kapingamarangi | 8.19" | 9.27" | 9.84" | 9.15" | 9.27" | 11.43" | 13.64" | 12.08" | 13.78" | 14.15" | 8.13" | 9.93" | 145.85" |
| Koror | 11.84" | 11.39" | 11.16" | 10.18" | 8.56" | 7.44" | 7.32" | 11.83" | 17.48" | 18.53" | 13.50" | 11.77" | 152.90" |
| Kosrae | 10.94" | 13.83" | 16.11" | 16.67" | 12.93" | 16.06" | 17.51" | 17.75" | 14.64" | 14.91" | 14.22" | 14.22" | 213.87" |
| Kwajalein | 11.18" | 11.28" | 6.66" | 3.16" | 2.64" | 2.35" | 5.26" | 6.72" | 6.93" | 9.87" | 9.74" | 10.74" | 90.41" |
| Lukonor | 11.32" | 9.08" | 11.27" | 8.41" | 8.93" | 9.26" | 11.31" | 11.69" | 11.65" | 15.93" | 14.04" | 10.15" | 151.36" |
| Majuro | 12.73" | 13.44" | 11.39" | 7.74" | 6.88" | 6.58" | 9.42" | 10.11" | 11.01" | 11.17" | 11.69" | 11.17" | 125.25" |
| Pago Pago | 9.26" | 10.14" | 12.84" | 13.34" | 12.00" | 10.68" | 9.39" | 9.66" | 5.33" | 5.55" | 5.38" | 6.53" | 125.57" |
| Pohnpei | 15.27" | 14.83" | 16.08" | 13.18" | 9.55" | 13.17" | 18.41" | 19.96" | 14.81" | 15.43" | 14.26" | 12.55" | 182.36" |
| Saipan | 10.62" | 5.61" | 3.85" | 2.53" | 2.59" | 1.89" | 2.63" | 2.38" | 3.62" | 8.91" | 13.13" | 10.09" | 70.25" |
| Yap | 12.18" | 8.83" | 8.51" | 6.39" | 5.19" | 4.56" | 5.63" | 7.85" | 12.04" | 15.08" | 14.82" | 13.50" | 120.31" |


[top]
State/Regional/National Moisture Status
A detailed review of drought and moisture conditions is available for all contiguous U.S. states, the nine standard regions, and the nation (contiguous U.S.):
| northeast u. s. | east north central u. s. | central u. s. |
| southeast u. s. | west north central u. s. | south u. s. |
| southwest u. s. | northwest u. s. | west u. s. |
| Contiguous United States |
[top]
Contacts & Questions