|
Contents Of This Report: |


|
Please note that the values presented in this report are based on preliminary data. They will change when the final data are processed, but will not be replaced on these pages.
National Drought Overview
|
|
[top]
Detailed Drought Discussion
Overview
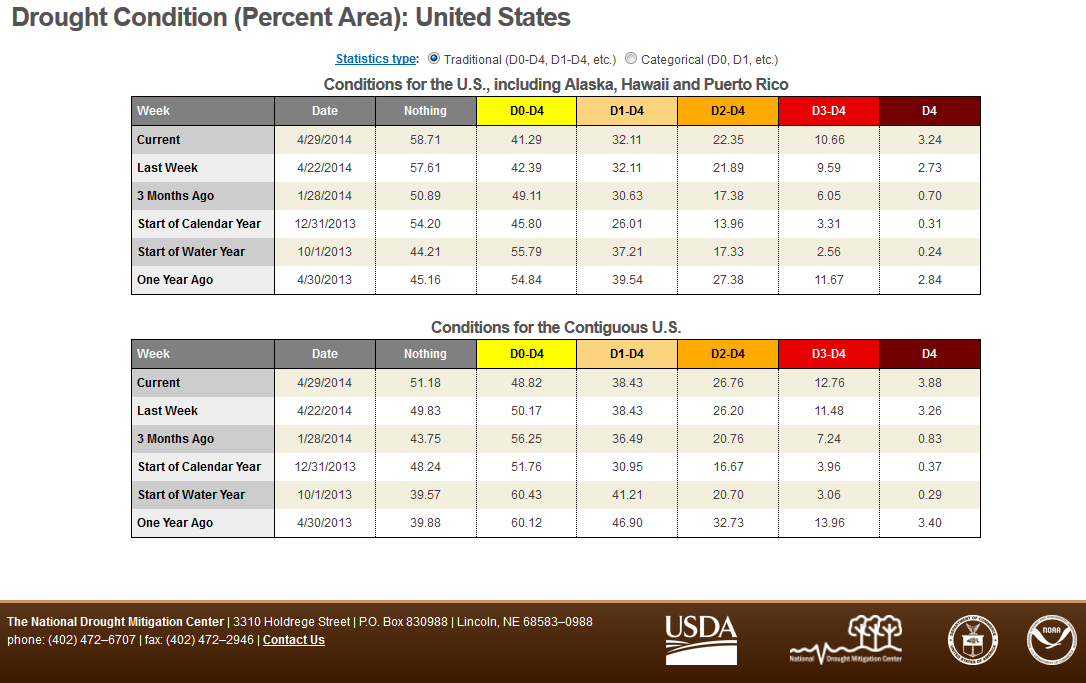
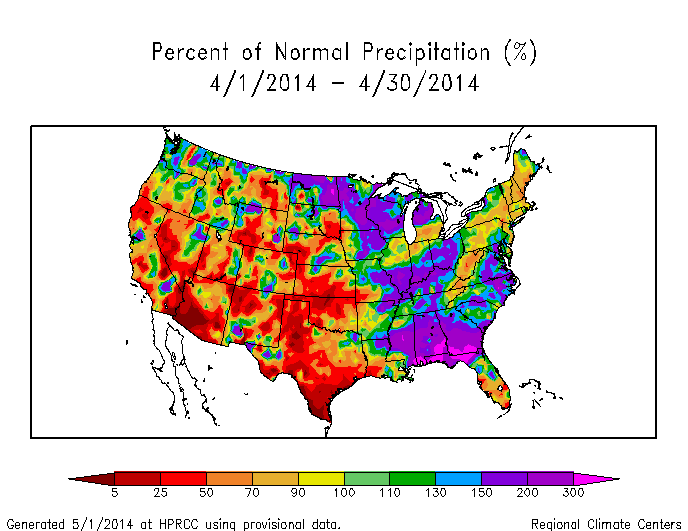
During April 2014, a long-wave trough in the upper-level circulation was evident over central Canada and extended into the north central CONUS. Short-wave troughs traversed the CONUS in the fast westerly flow along the southern edge of the long-wave trough, generating large bands of precipitation east of the Rockies, with some producing heavy rain and severe weather when slowed by blocking patterns in the atmospheric circulation. The rain from these weather systems shrank the drought and abnormal dryness areas in the Midwest, Southeast, and Pacific Northwest. The circulation pattern inhibited beneficial precipitation across much of the West and Central to Southern Plains, where drought expanded or intensified. The strong westerly flow over the Pacific kept weather systems away from Alaska, resulting in another drier-than-normal month. The precipitation pattern across Hawaii was mixed, with drought conditions improving. When integrated across the CONUS, April 2014 ranked as the 30th wettest April in the 1895-2014 record. On balance, the national drought footprint changed very little compared to last month, staying around 32.1 percent of the U.S. as a whole, according to USDM statistics. According to the Palmer Drought Index, which goes back to the beginning of the 20th century, 29.1 percent of the CONUS was in moderate to extreme drought at the end of April, an increase of about 1 percent compared to last month.

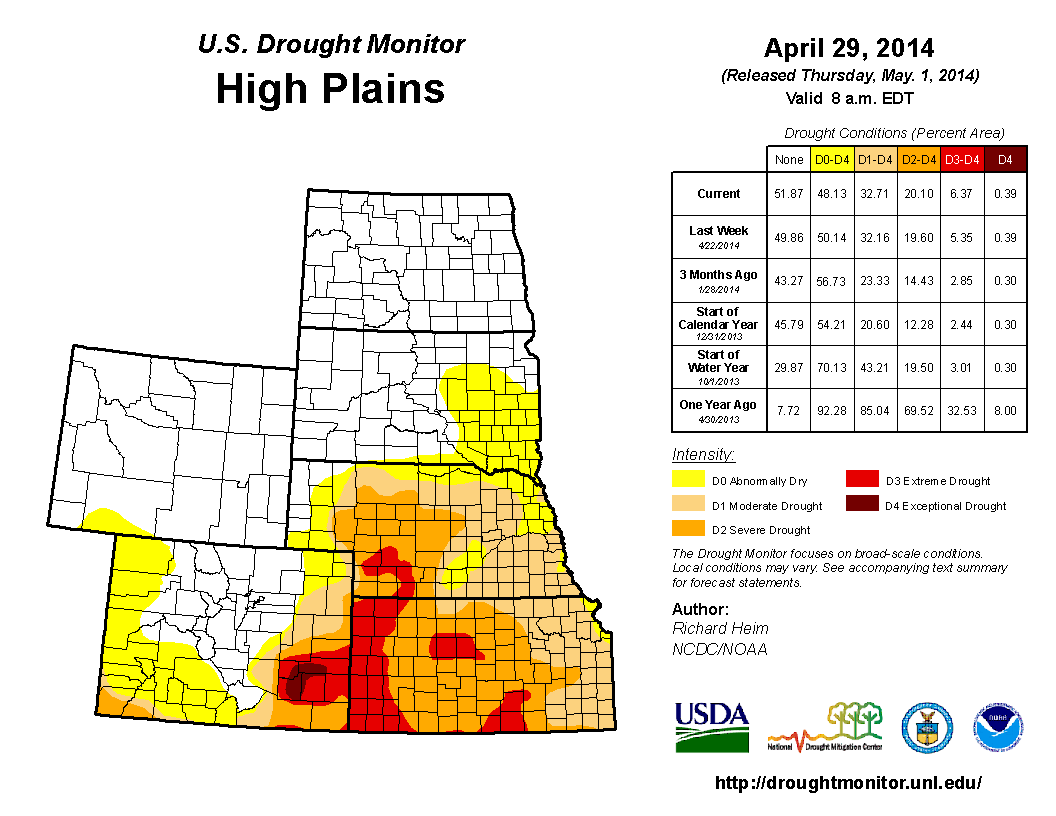
The U.S. Drought Monitor drought map valid April 29, 2014.
By the end of the month:
- moderate (D1) to severe (D2) drought covered a large area of the U.S. continuously from the West Coast to the Great Plains, connected across New Mexico;
- there were two epicenters of extreme (D3) to exceptional (D4) drought in this large drought area — one located in the California-Nevada region and the other in the Southern Plains centered in the Texas panhandle and extending outward into New Mexico, central Texas, Oklahoma, southeast Colorado, and western Kansas; and
- moderate drought persisted in Hawaii.
Palmer Drought Index
The Palmer drought indices measure the balance between moisture demand (evapotranspiration driven by temperature) and moisture supply (precipitation). The Palmer Z Index depicts moisture conditions for the current month, while the Palmer Hydrological Drought Index (PHDI) and Palmer Drought Severity Index (PDSI) depict the current month's cumulative moisture conditions integrated over the last several months. While both the PDSI and PHDI indices show long-term moisture conditions, the PDSI depicts meteorological drought while the PHDI depicts hydrological drought. The PDSI map shows less severe and extensive drought in the West and parts of the Plains than the PHDI map because the meteorological conditions that produce drought are not as long-lasting as the hydrological impacts.
|
 |
Used together, the Palmer Z Index and PHDI maps show that short-term wet or near normal conditions occurred during April over the Pacific Northwest and Midwest which had areas in long-term drought or neutral conditions during March, resulting in contraction of drought or introduction of wet spell conditions by the end of April. Short-term dry conditions occurred over much of the West, from the Central to Southern Plains, and in the Central Appalachians, which had areas in long-term drought or neutral conditions during March, resulting in an intensification and expansion of drought by the end of April. Wet short-term conditions occurred over the long-term near normal to wet areas of the Northern Plains and Southeast, resulting in expansion of the wet spell areas there.
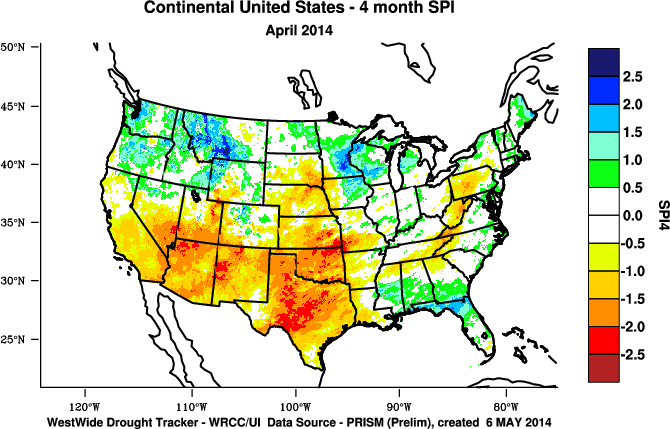
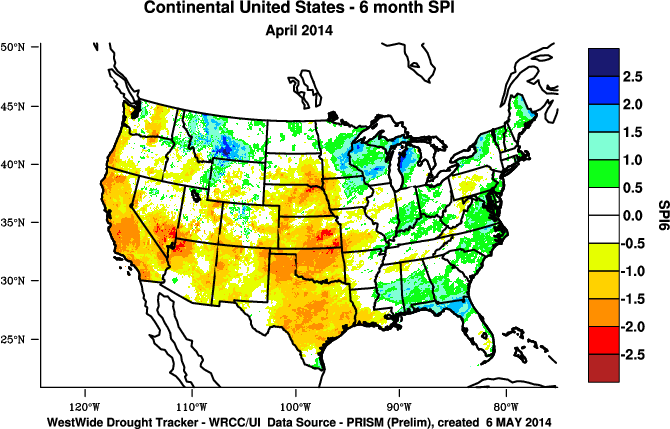
Standardized Precipitation Index
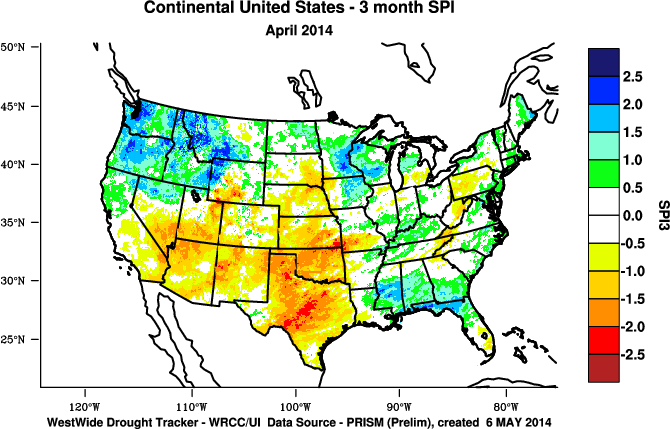
The Standardized Precipitation Index (SPI) measures moisture supply. The SPI maps here show the spatial extent of anomalously wet and dry areas at time scales ranging from 1 month to 24 months.
 |
 |
 |
The SPI maps illustrate how moisture conditions have varied considerably through time and space over the last two years. The neutral to wet conditions during February, March, and April 2014 in the Pacific Northwest and the Northern Rockies have been enough to neutralize the dryness at the 1- to 3-month time scales, and even at longer time scales in places. The rest of the West is neutral to dry at 1 to 2 months, with widespread dryness showing up at 3 to 6 months. At 9 to 12 months, dryness is severe in California while much of the rest of the West is near normal to wet, but at 24 months dryness is widespread across much of the West. Dryness shows up at 1 to 3 months, especially at the 2-month time scale, along the spine of the Appalachians. Widespread dryness is evident in the Central to Southern Plains at all time scales, except wet conditions last year neutralized the dryness in places at the 9 to 12 month time scales. Last year's dry spell is evident in the Midwest at 9 to 12 months, while patchy dryness shows up in the Northeast at the 9-month time scale.
 |
 |
 |
Agricultural, Hydrological, and Meteorological Indices and Impacts
 |
 |
Drought conditions were reflected in numerous agricultural, hydrological, and other meteorological indicators, both observed and modeled.
USDA statewide soil moisture.
The cumulative impact of the persistent reduced precipitation (last 1, 2, 3, 4, 6, 7 months) in the nation's agricultural areas can be seen in dried soils (both modeled and observed) and stressed vegetation in parts of the West and much of the Plains. Signs of dry soils are evident in eastern Washington state and parts of the Southwest and Intermountain Basin, but especially hard-hit were California and the Southern to Central Plains. According to April 27 U.S. Department of Agriculture (USDA) reports, more than 70 percent of the topsoil was short or very short of moisture in California (75%), Texas (78%), and Oklahoma (72%), and 50 percent or more was short or very short in Kansas (67%), New Mexico (64%), Nevada (60%), Nebraska (53%), and Colorado (50%). Except for New Mexico, these values were higher than the 19-year median for all of these states, as well as for Washington, Oregon, Utah, South Dakota, Iowa, Missouri, and Illinois. Even several eastern states (West Virginia, New Jersey, Connecticut, Massachusetts) had drier-than-median topsoil moisture statistics. Conditions worsened in the following week in the Southern Plains, with Texas jumping to 82 percent of the state having topsoil moisture short or very short, Oklahoma 78 percent, and Colorado 60 percent. Louisiana had the biggest jump, doubling to 35 percent in one week. Subsoil moisture conditions were just as bad, with more than 80 percent of the subsoil moisture short or very short in California (85%), Nevada (85%), Oklahoma (83%), and Texas (82%), reflecting the long-term (multi-year) nature of the drought. The dried-out soils and desiccated vegetation allowed wind from frequent cold fronts to kick up numerous dust storms in the Southern Plains. The wind, low humidities, and prolonged dryness contributed to the development of large wildfires in the Plains and Southern Appalachian regions throughout the month.
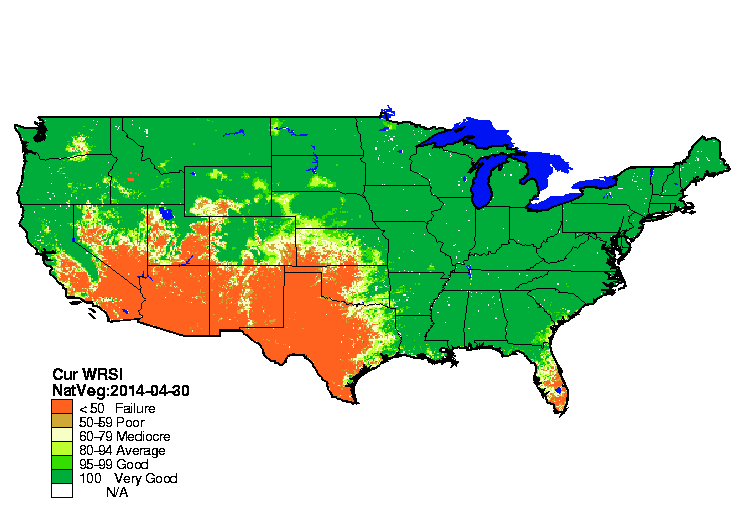
USGS Water Requirement Satisfaction Index.
Precipitation in the Midwest improved soil moisture and crop conditions, but the continued dry conditions across the West and Plains ravaged crops and other vegetation. The modeled Soil Water Index indicates unsatisfactory soil moisture conditions across the southwestern third of the country, where impacts could be stress or wilting, and the Water Requirement Satisfaction Index indicates potential crop failure across much of the Southwest and Southern Plains. As of April 29th, about 53 percent of winter wheat was in drought, up from 52 percent a month ago, 44 percent of the cattle inventory was in drought (down 1 percent), 30 percent of hay (down 1 percent), 26 percent of corn (down 5 percent), and 19 percent of soybeans (down 5 percent). April 27th USDA reports indicated that 34 percent of the winter wheat crop was in poor to very poor condition, nationally (up 5 percent from a month ago), with state values of 65 percent in Texas and Oklahoma, 37 percent in Kansas, and 33 percent in Colorado. A week later (May 4th), 38 percent of the national winter wheat crop was in poor to very poor condition, with statewide values up in Oklahoma (73%), Kansas (47%), and Colorado (37%). According to estimates released by the Wheat Quality Council Hard Winter Wheat Tour and statistics compiled by the NOAA Climate Prediction Center, the 2014 Oklahoma-Kansas winter wheat harvest is estimated to be the lowest since the 1960s. This is due to drought but also partially to late season freezes. Nationally, 22 percent of the pasture and rangeland was in poor to very poor condition, with statewide values over 50 percent in Arizona (52%), California (60%), Nevada (55%), and New Mexico (73%), and 30 percent or more in several other states in the West, Plains, and New England. The Palmer Crop Moisture Index (CMI) showed abnormally to excessively dry conditions expanding northward in the Southwest and Southern Plains as the month progressed (weeks 1, 2, 3, 4, 5).

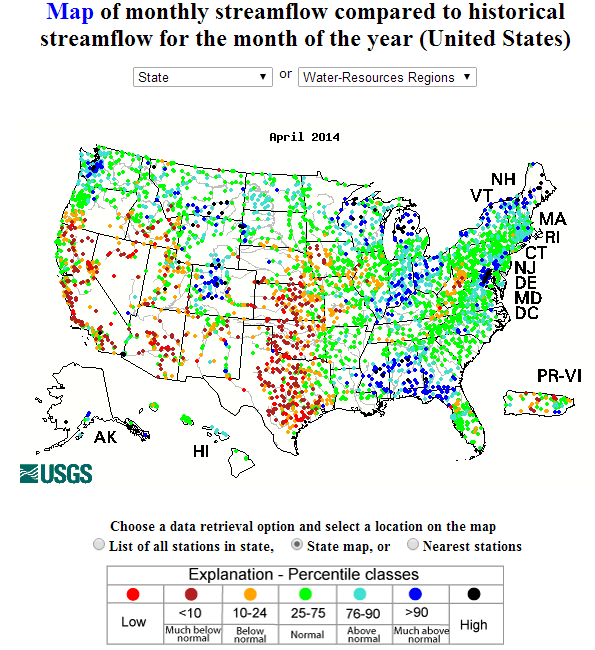
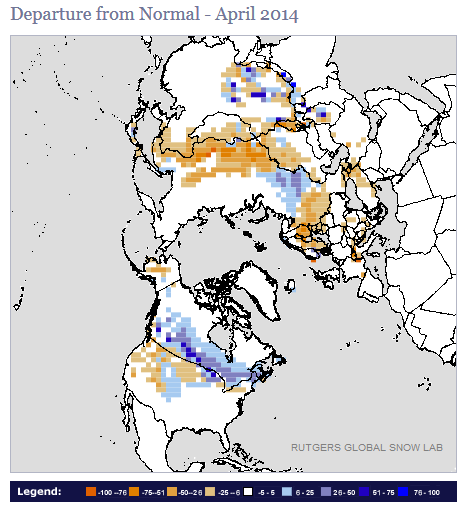
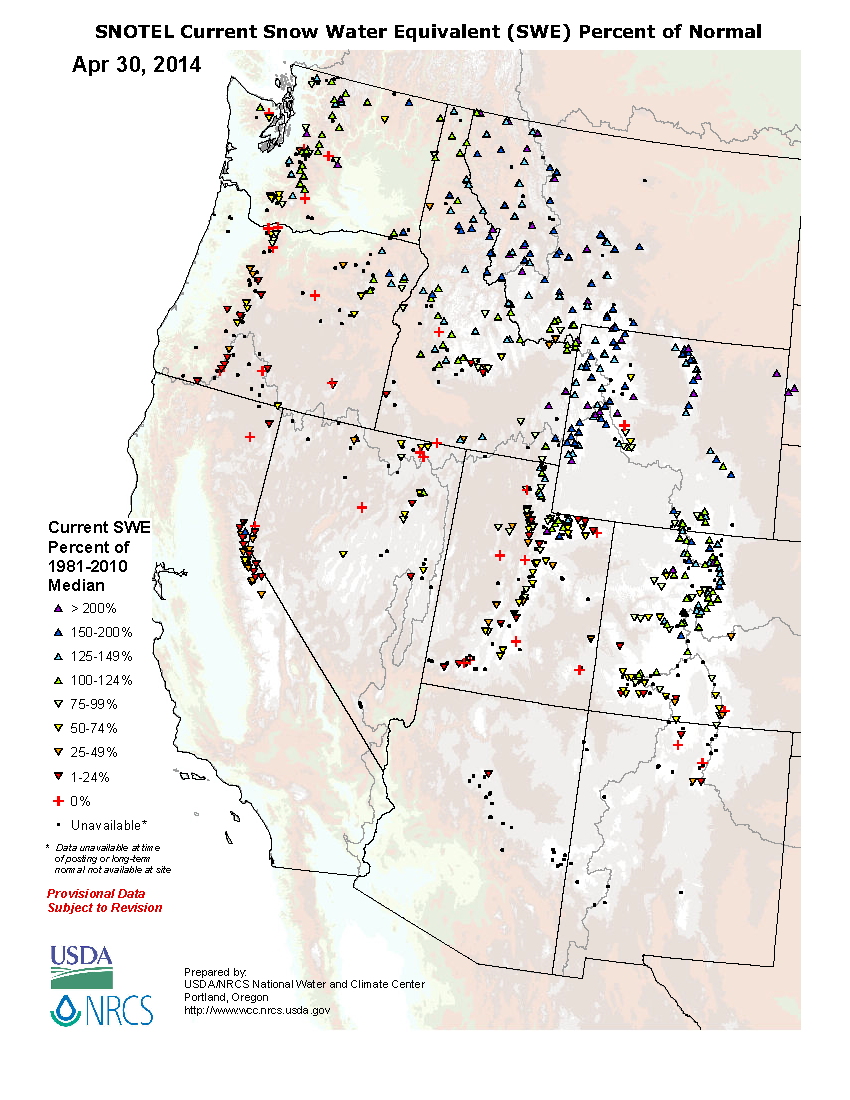
USDA West statewide reservoir status.
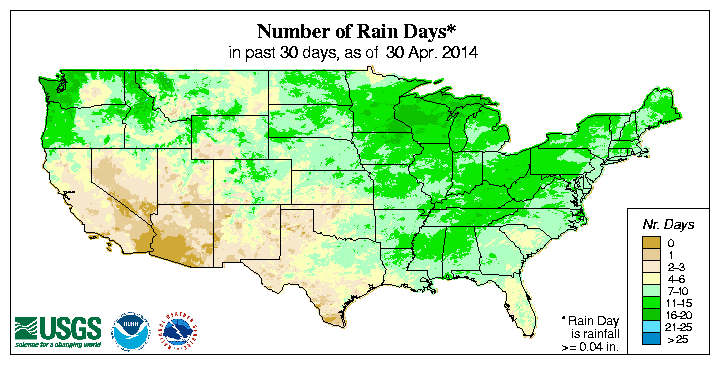
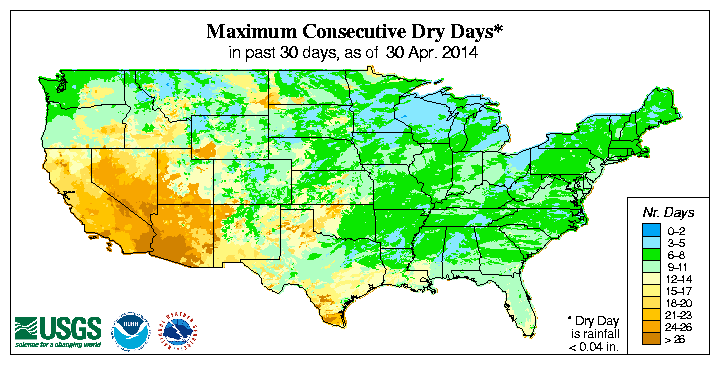
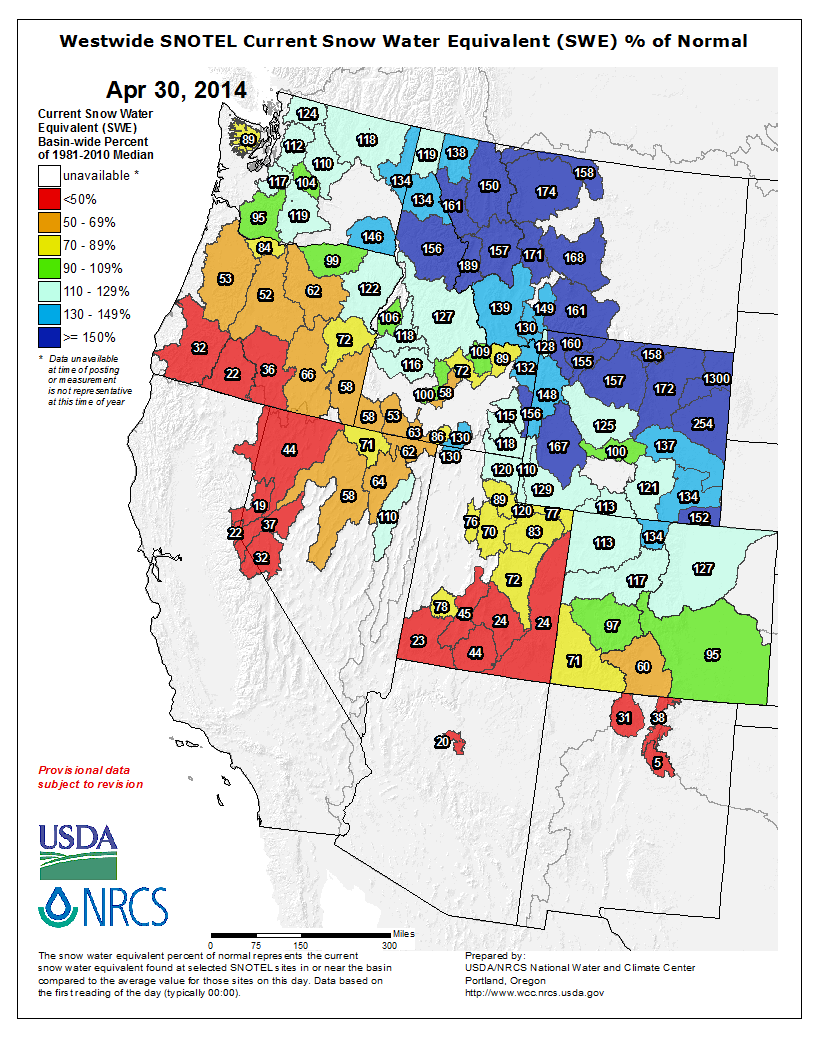
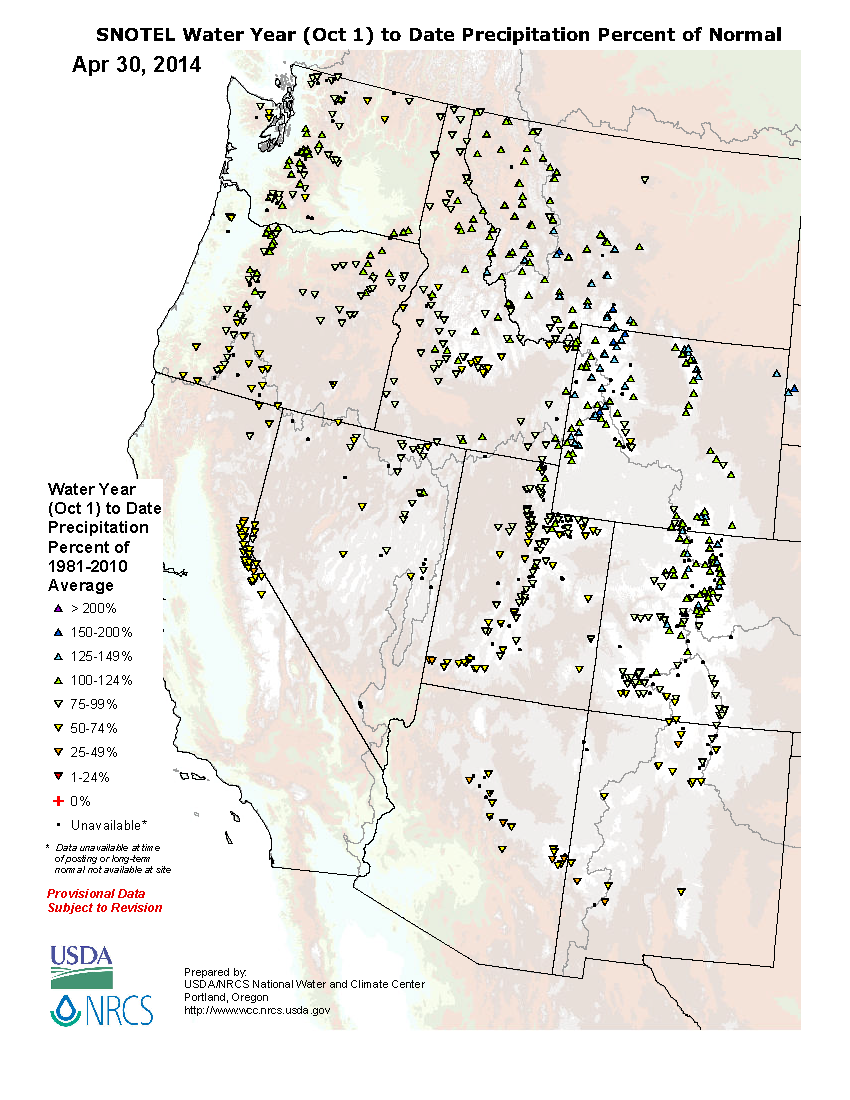
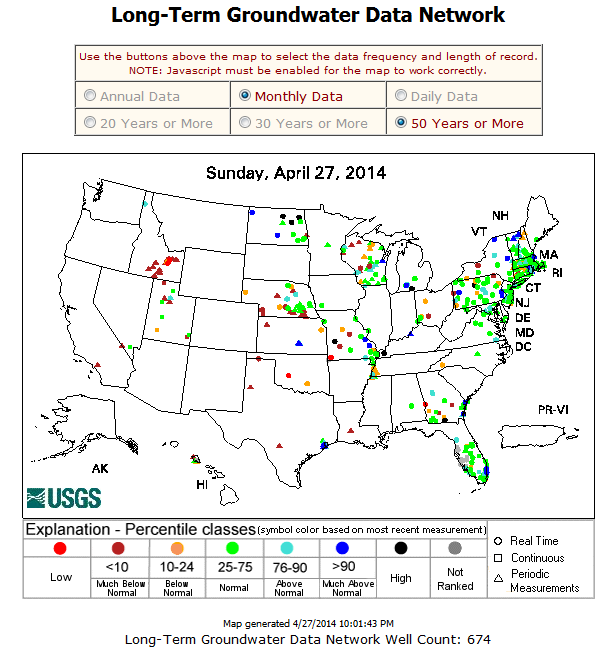
The subnormal precipitation was reflected in below-normal monthly precipitation totals as well as lack of rain days and long runs of consecutive dry days, especially in the Southwest and Southern Plains. Streamflow and modeled runoff averaged below normal in parts of the West, Plains, and Southern Appalachians, with some basins averaging much below normal and some stream gauges measuring record low monthly values for April. Cold fronts brought below-freezing air to the central CONUS, resulting in occasional snow storms which dropped an above-normal snow cover over the central states, but for the most part, the snow-producing systems stayed north of the border with the western and some northern states having below-normal snow cover. In the West, snow pack and snow water content were deficient in the southwestern basins but near to above normal in the northern basins, especially the Northern and Central Rockies. Precipitation for the water year-to-date (October 1 to present) has generally been above normal for the Northern to Central Rockies. On a basinwide basis, the basins in the Pacific Northwest had near average precipitation for the water year-to-date, but on an individual station-by-station basis, many stations were drier than normal. Stations and basins in the Southern Rockies and Southwest, especially California, predominantly have had a drier-than-normal water year. The persistent dryness — for the water year-to-date and longer — was reflected in below-normal groundwater and springwater observations, and, for Texas (especially the western counties), Colorado (southwestern counties), California, and most of the western states, below-normal reservoir levels. Some wells in the western and central states, and some springs in the southern states, had record low levels, with some of the wells having the lowest groundwater levels in 50 years or longer.
The lack of precipitation, low reservoirs, and low snowpack, which provides essential drinking and irrigation water when it melts during the spring and summer, have prompted many western communities to issue water restrictions. In the Four Corners area, the town of Monticello, Utah has major water supply problems. With their reservoir at a critically low level, groundwater wells were drilled for supplemental supply. Even with conservation, they have at most one season of water supply. If snowpack is low again next year, they will have very little water available for municipal supply. In California, the city of San Diego was proposing a water supply "level 1" status, and a small reservoir/water district in Riverside County was on the 30-90 day "watch" list for depleted supplies. The San Antonio Reservoir has been essentially dry through the entire winter and Nacimiento Reservoir was at 22 percent capacity. The City of Montague risked running out of drinking water by the end of summer and has requested that all outside watering be curtailed until further notice; this is the first time in over 80 years of water deliveries from the Montague Water Conservation District (MWCD) that this situation has occurred. Growers in Shasta Valley with the primary irrigation district (MWCD) were expected to have only enough irrigation water to irrigate what would equate to a single irrigation on about half of their acreage. Many growers in the Big Springs area have already started pumping water to irrigate field. Within 24 hours of when one grower started irrigating, two nearby domestic wells went dry.
Regional Discussion
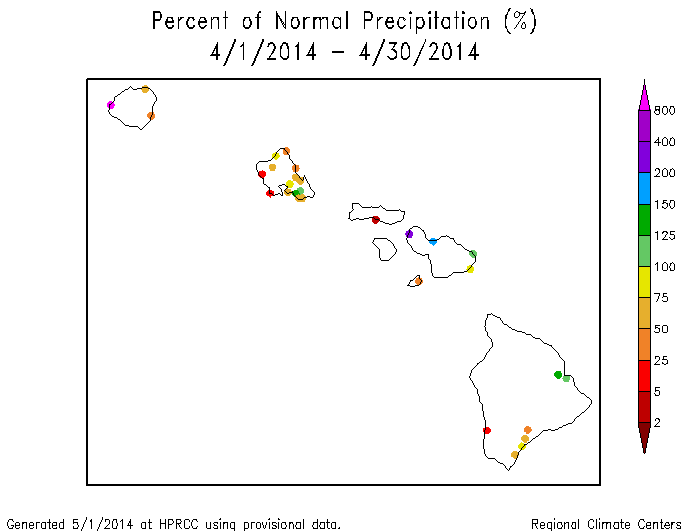
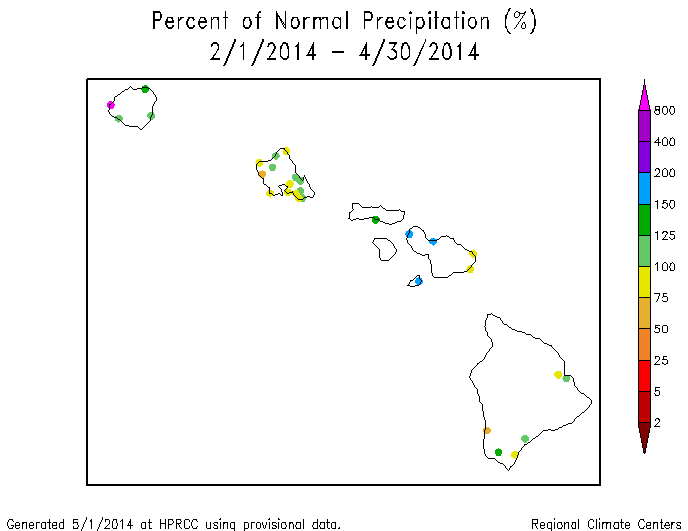
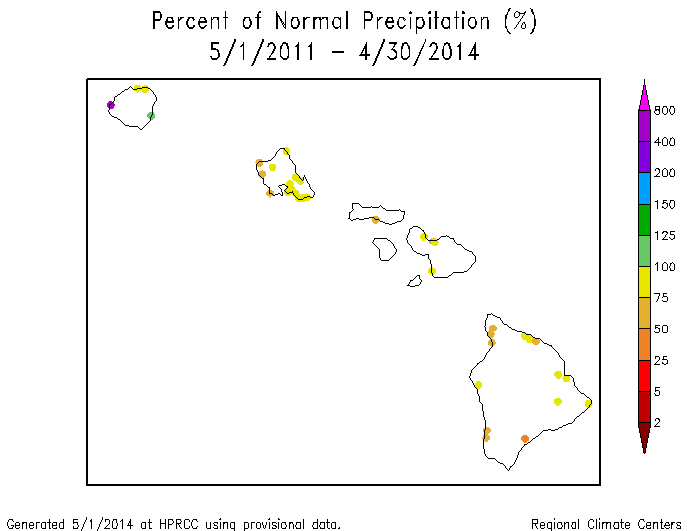
Hawaii: The precipitation pattern for April 2014 and the last two months was mixed across Hawaii, with wetter-than-normal conditions prevailing on the windward side of the islands and drier-than-normal conditions on the leeward sides. The mixed pattern continues for much of the last year (last 3, 4, 7, 10, and 12 months). Drier-than-normal conditions tended to dominate on most of the islands at the longer time scales (last 24 to 36 months). The wetter conditions in recent months, and improved Kualapuu Reservoir levels, resulted in the contraction of drought and deletion of severe to extreme drought. Water levels on the reservoir have risen to pre-drought levels, but a mandatory 20 percent cutback in water use remained in place as a precaution for now. On the USDM map, moderate drought covered less than one percent of the state this month compared to 14.4 percent in moderate to extreme drought last month.
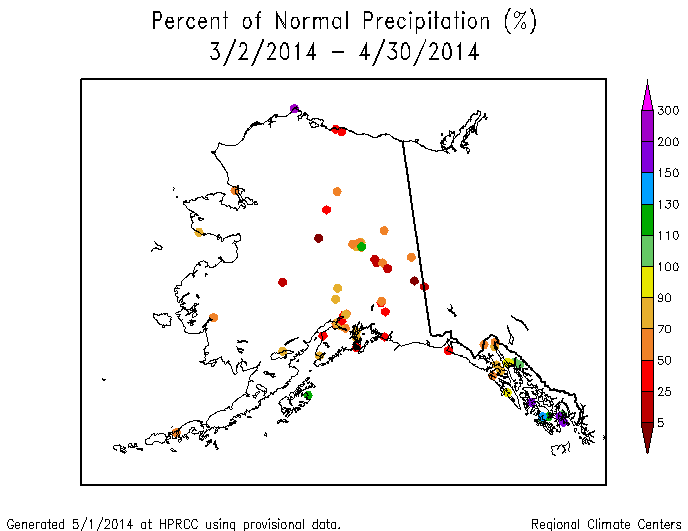
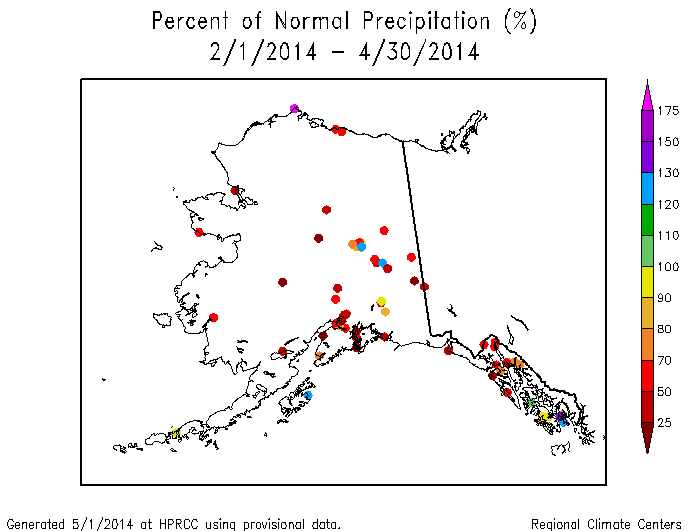
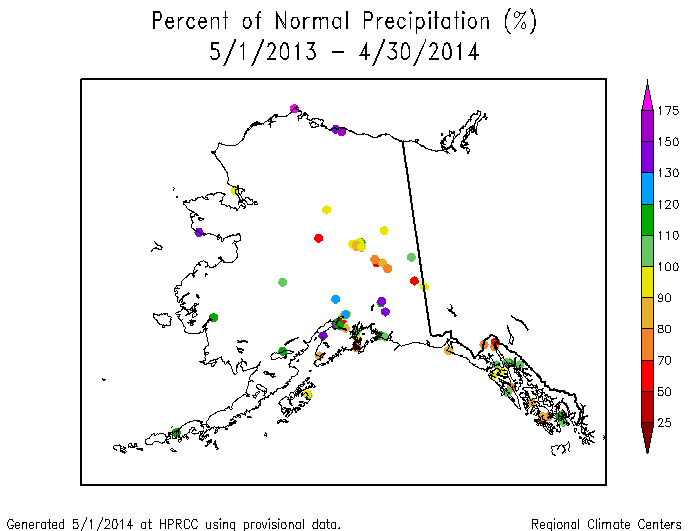
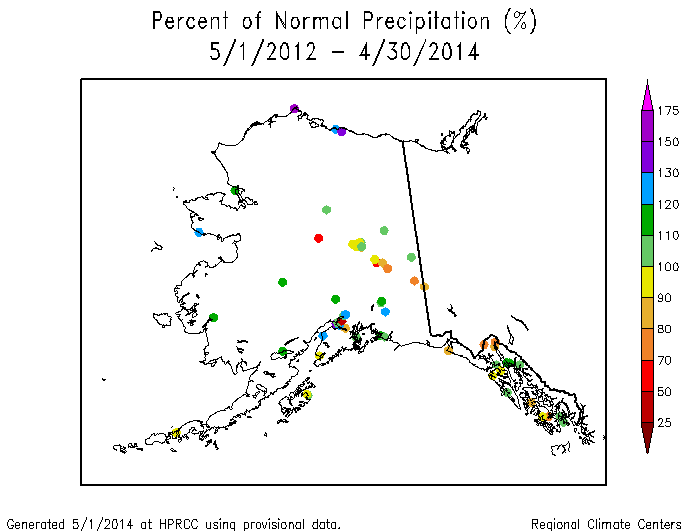
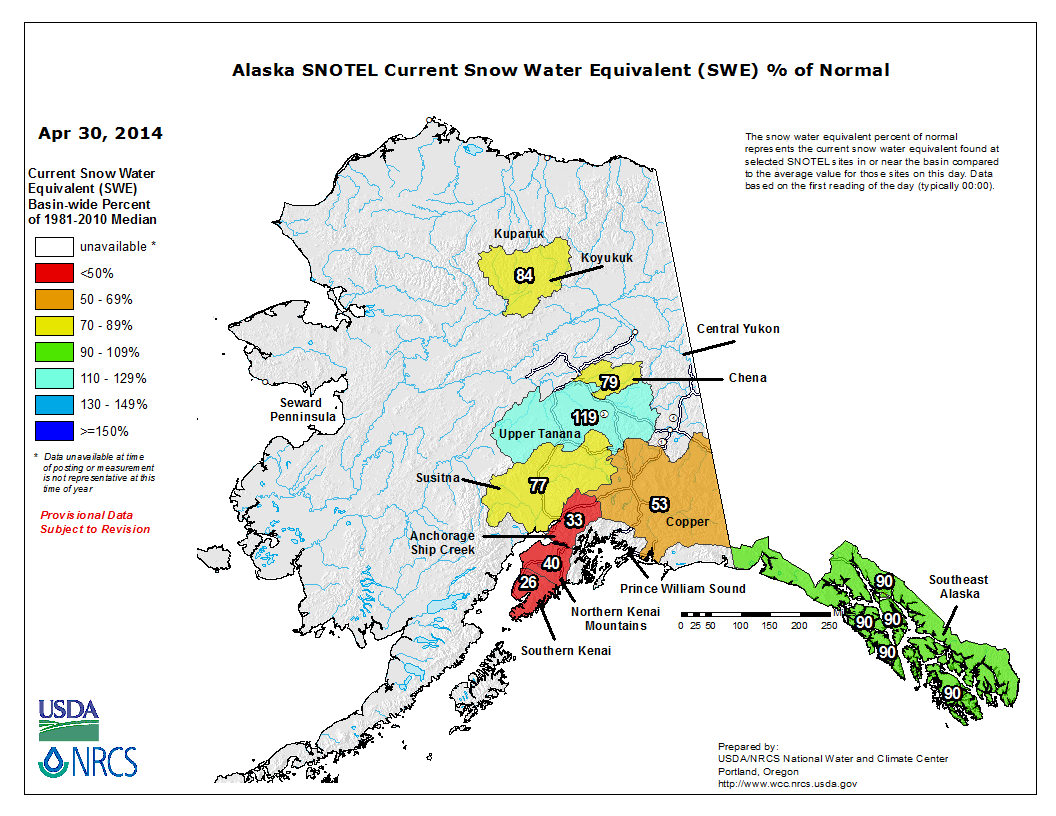
Alaska: April was drier than normal for most stations in Alaska, continuing a pattern in place for the last two to three months. Above-normal precipitation earlier in the winter gave a mixed pattern at the four, six, and seven month time scales. At longer time scales (last 10, 12, 24, and 36 months), dryness at the interior and some panhandle stations is evident. The water-year-to-date (October-April) wetness and April dryness are reflected in the high elevation (SNOTEL) stations, with April snow water content generally below normal. Abnormal dryness covered about two percent of the state on the USDM map, mainly reflecting water supply (reservoir) concerns in the southern panhandle.
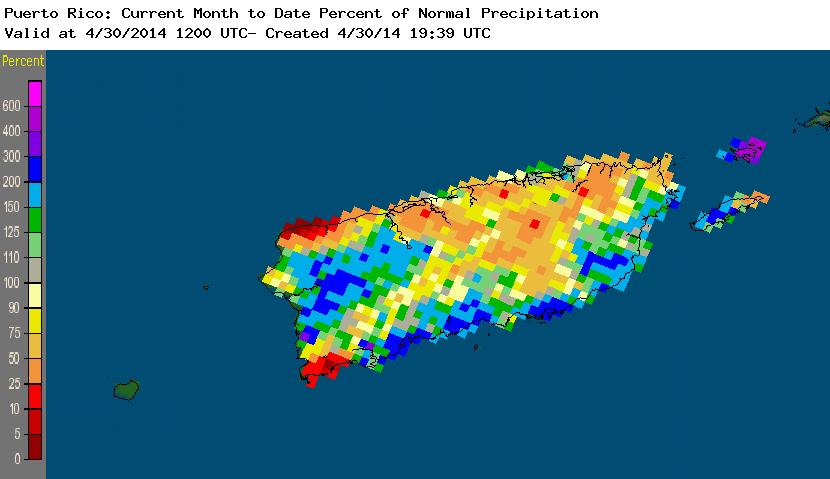
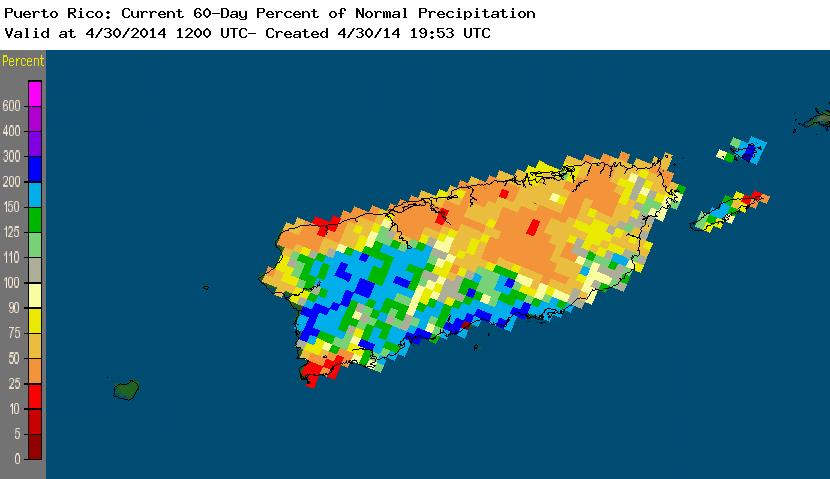
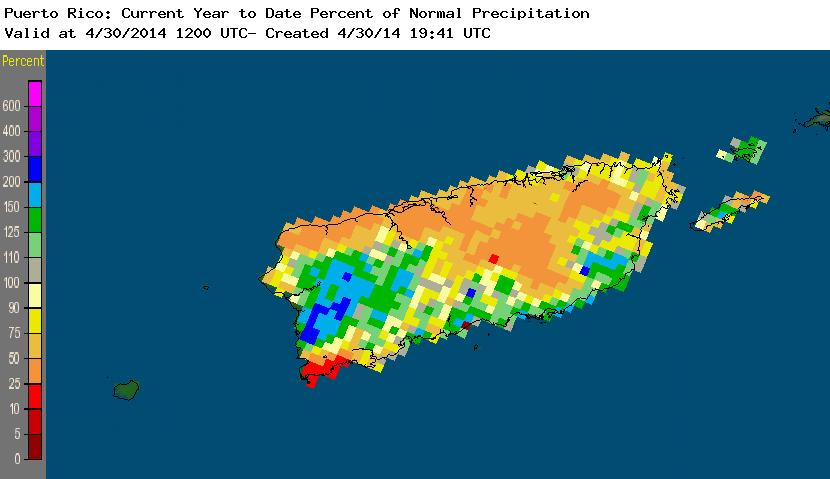
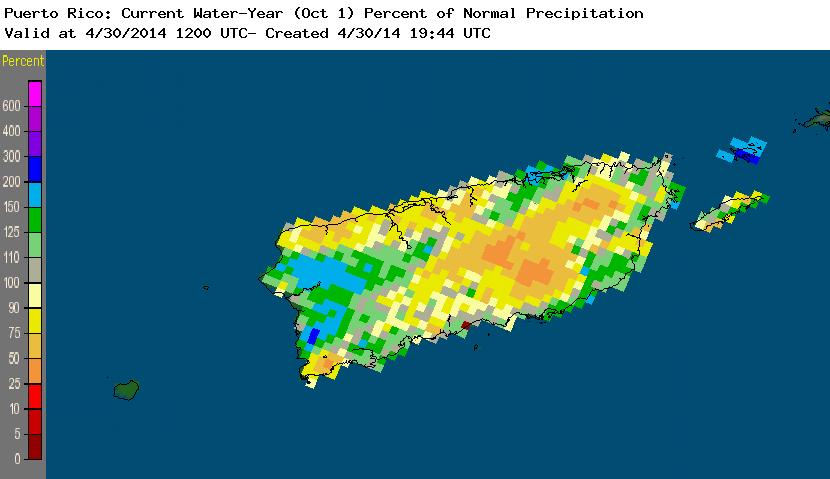
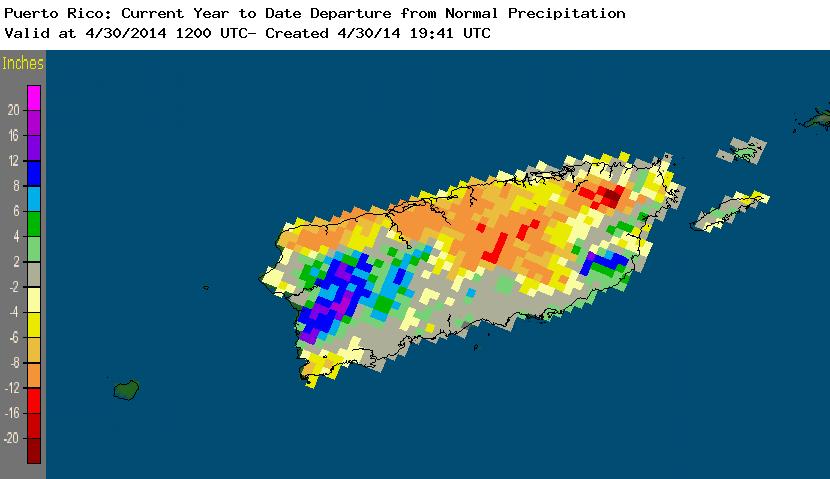
Puerto Rico: April 2014 was wetter than normal across the southern coast and west central portion of Puerto Rico but drier than normal across the rest of the island. A similar pattern is evident for much of the past year (last 2, 3, 4, 6, 7 months). Rainfall deficits in excess of twelve inches are evident in interior regions for the last four to seven months. April streamflows were below to much below normal at several stations. The abnormally dry area expanded slightly on the USDM map compared to last month, with nearly half (48 percent) of the island rated abnormally dry.
|
|

|
The April precipitation anomaly pattern of dryness in the Southwest, Great Plains, New England, and Central Appalachians was reflected in the state ranks, but enough pockets of wetness occurred in the dry areas to prevent any state from ranking in the top ten dry category. Only eight states had April precipitation ranks in the dry third of the historical record.
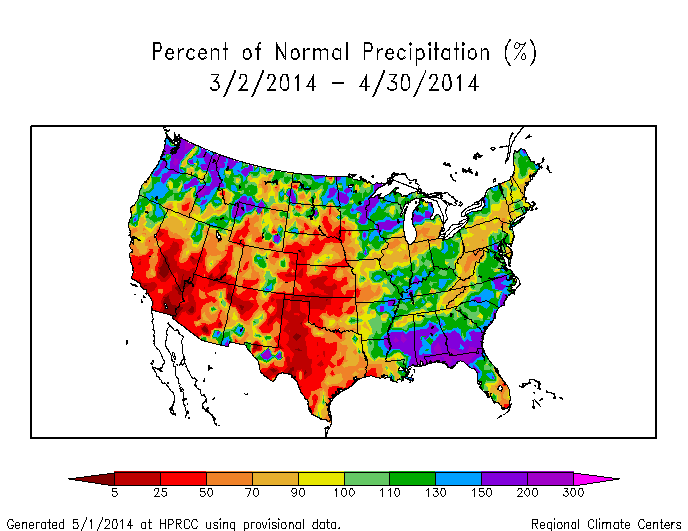
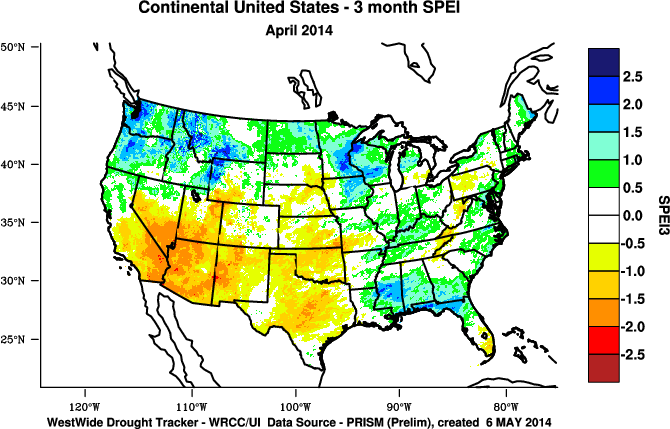
At the three-month time scale, persistent dryness in the Central to Southern Plains and Southwest resulted in three states (Kansas, Oklahoma, and Texas) having the tenth driest, or drier, February-April in 2014, and seven other states ranking in the driest third of the historical record. The SPI measures water supply (precipitation), while the SPEI (Standardized Precipitation Evapotranspiration Index) measures the combination of water supply (precipitation) and water demand (evapotranspiration as computed from temperature). The unusual warmth in the Southwest exacerbated the drought conditions as seen by more severe SPEI drought values when compared to the SPI values. Likewise, the unusually colder-than-normal temperatures in the Plains reduced water demand, as reflected by less severe SPEI drought values when compared to the SPI values.
|
|

|
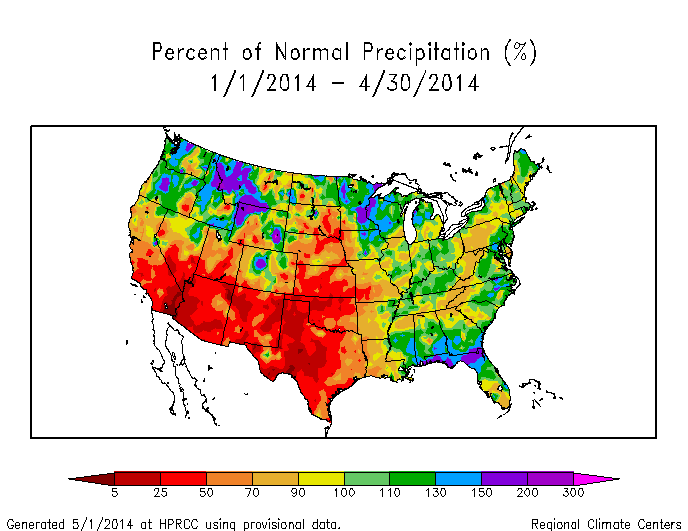
The January-April 2014 precipitation anomaly pattern of dryness in the Southwest, Great Plains, and Appalachians was reflected in the state ranks. Fifteen states ranked in the driest third of the historical record, with five of them having the tenth driest, or drier, year-to-date. These "top ten driest" states included Oklahoma (second driest January-April), Kansas and Texas (both fifth driest), Arizona (sixth driest), and New Mexico (seventh driest). The unusual warmth in the West, and coolness in the East, which persisted through the winter months, gave California and Arizona the warmest January-April on record. As with February-March, the year-to-date warmth in the Southwest exacerbated the drought conditions as seen by more severe SPEI drought values when compared to the SPI values, and the below-normal temperatures in the Plains reduced the SPEI drought values when compared to the SPI values.
|
|

|
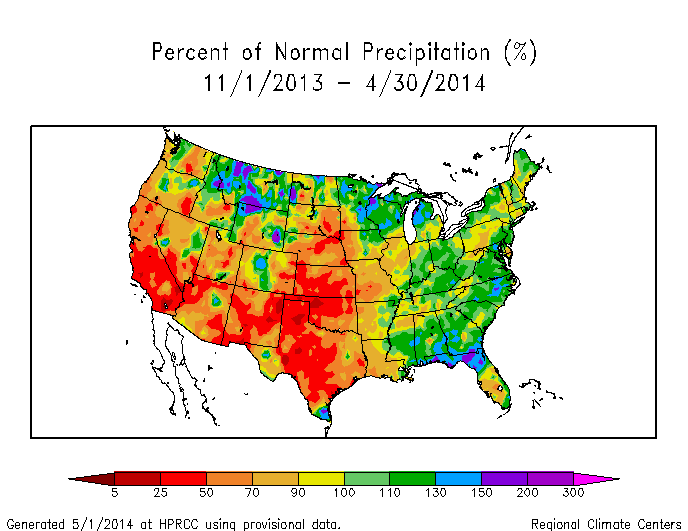
Most of the West and Great Plains were drier than normal during November 2013-April 2014, with three states (Kansas, Oklahoma, and California) having the tenth driest, or drier, November-April in the 1895-2014 record. Eleven other states ranked in the driest third of the historical record. The temperature anomaly pattern of unusual warmth in the West and coolness east of the Rockies was evident at the 6-month time scale, with California having the warmest November-April. Evapotranspiration is greatly reduced during winter, yet the temperature extremes still resulted in enhanced SPEI drought values in the Southwest and reduced SPEI values east of the Rockies when compared to the SPI values.
|
|

|

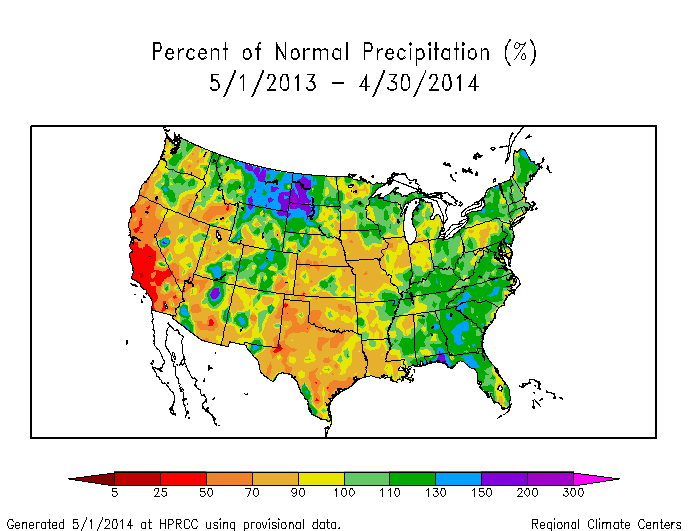
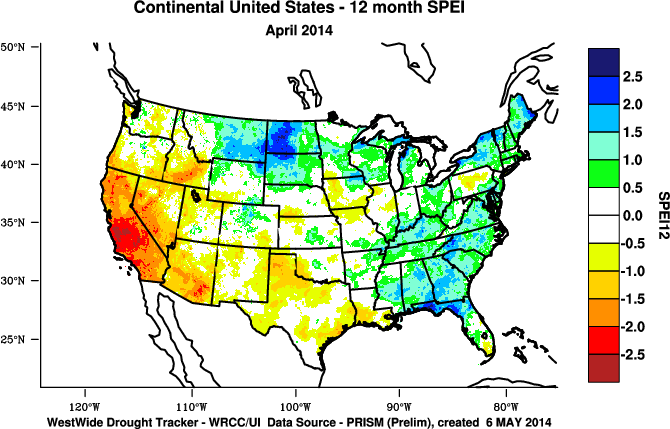
For the last twelve months (May 2013-April 2014), dryness dominated California, the Southern to Central Plains, and Midwest, with pockets of wetness in most of the dry areas. California was especially hard hit, having the hottest and third driest May-April on record, in spite of the February and March 2014 precipitation. Five other states ranked in the driest third of the historical record. States in the Southwest, Central Plains, and Midwest ranked near- to above-normal because of pockets of wetter-than-average weather which influenced the statewide ranks. The West has experienced unusual warmth for most of the last twelve months, with six states (including California) ranking in the warmest third of the historical record. The record warmth in California exacerbated the drought conditions as seen by more severe SPEI drought values when compared to the SPI values. This is the case across much of the West. Likewise, the persistent and unusually colder-than-normal temperatures east of the Rockies have reduced the severity of drought in the Plains as seen by less severe SPEI values when compared to SPI values.
 Percent area of the Western U.S. in moderate to extreme drought, January 1900 to present, based on the Palmer Drought Index. As noted above, dry weather has dominated the West for the last several months, resulting in reduced mountain snowpack and lake, reservoir, and stream levels. According to the USDM, 61.4 percent of the West was experiencing moderate to exceptional drought at the end of April, an increase of about 1.2 percent compared to the previous month. Beneficial precipitation improved conditions in the north, but continued dryness and increased water demand due to the unusually warm temperatures expanded and intensified drought in the south. This resulted in a net increase in drought area as measured by the USDM. The Palmer Drought Index percent area statistic was 57.0 percent, an increase of about 7 percentage points from the previous month. |

|

|
Parts of the West, especially the southern portions, have been in drought for the last several years, with the PDSI reaching record or near-record values at times. The lowest value in the 1900-2014 record for the South Coastal Drainage region of California (climate division 6) was reached in the last decade, with the April 2014 PDSI very close to the record low value. For the San Joaquin Drainage region of California (climate division 5), the April 2014 PDSI is very close to the record low value set in July 1977. Beneficial precipitation during the last three months has improved the PDSI values in northern California, but it has not erased deficits which have built up over several years. In the aggregate, the statewide PDSI for California was in the extreme drought category during April 2014, rivalling the droughts which peaked in 1924 and 1991 as well as the record drought which peaked in 1977. Similarly, Nevada has been in drought for much of the last 15 years.
|
 |
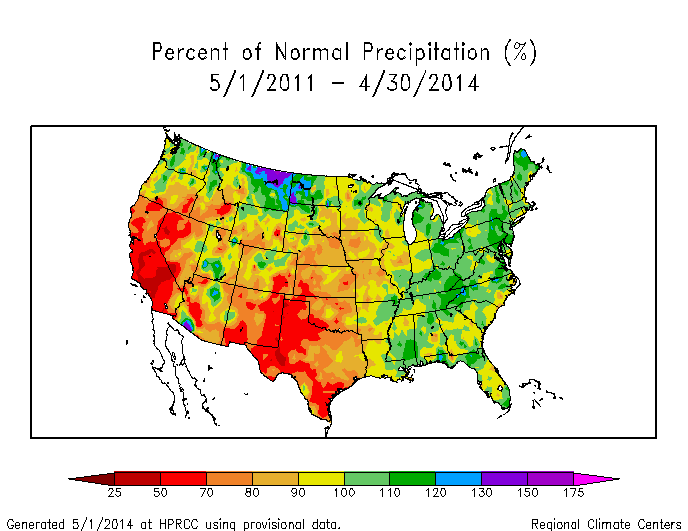
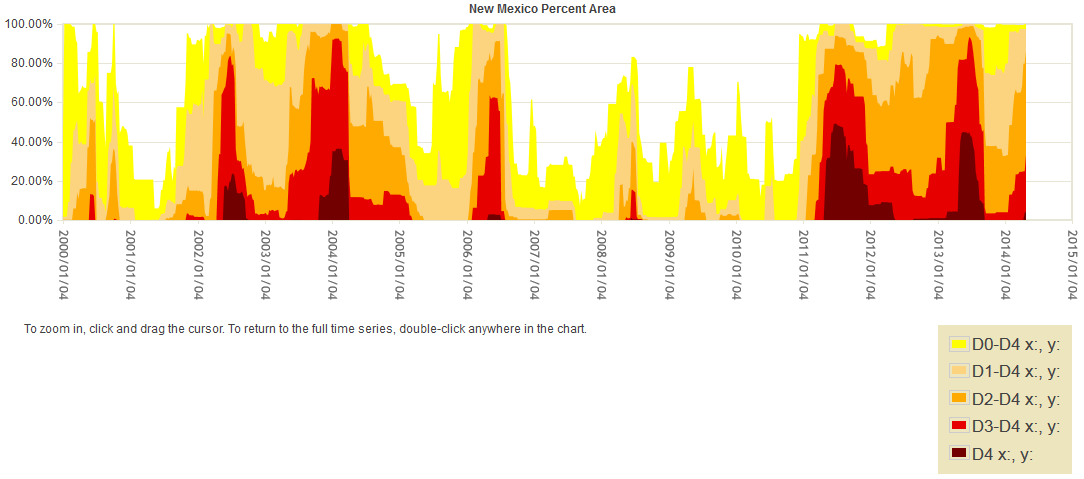
Likewise, New Mexico has been in drought for much of the last 15 years, but precipitation has tempered the PDSI value at times. Just last year, the severity of New Mexico's drought, statewide, approached the record low PDSI value set in September 1956. The Southwest drought includes the Southern Plains, where Texas has been in moderate to extreme drought since 2011, when the state set a record low PDSI, exceeding the previous record value set in September 1956. The persistence of drought over the last 15 years in California, New Mexico, and Texas is illustrated by the large and persistent percent area in moderate to exceptional drought as measured by the USDM.
|
 |
The April precipitation pattern for the Primary Hard Red Winter Wheat agricultural belt was much drier than normal, with April 2014 ranking as the 15th driest and 50th warmest April region-wide. The growing season to date (October 1-present) ranked as the eighth driest and 27th coolest October-April.
 Primary Hard Red Winter Wheat Belt PDSI, January 1900-present. The last two months have been persistently dry in the Primary Hard Red Winter Wheat belt, with March-April 2014 ranking as the sixth driest March-April in the 1895-2014 record. February-April and January-April 2014 also ranked as the sixth driest such periods on record. Regionwide, the PDSI has been in drought for just over three years (since April 2011), but the droughts of the 1930s and 1950s were more severe and lasted longer according to this index.
The growing season for the Primary Corn and Soybean agricultural belt got off to a dry start during March, but it was wet across much of the region during April 2014, with the month ranking as the 15th wettest and 56th coolest April on record. The growing season to date ranked as the 52nd wettest and 26th coolest March-April, regionwide. |
NOAA Regional Climate Centers:
A more detailed drought discussion, provided by the NOAA Regional Climate Centers and others, can be found below.
West — Pacific Islands
As described by the High Plains Regional Climate Center, April precipitation was varied across the High Plains region. Above normal precipitation fell across much of North Dakota and areas to the east such as Minnesota and Iowa. While only a few pockets of above normal precipitation fell in the other states in the region, large areas had precipitation totals which were at best 50 percent of normal. Notable areas included southeastern South Dakota, southern and western Kansas, southern and central Wyoming, and areas near the Nebraska/Colorado border. A few embedded areas even received as little as 25 percent of normal precipitation. Wichita, Kansas was one of these dry locations and had its 6th driest April on record with 0.53 inches (13 mm) of precipitation (period of record 1888-2014). This amount was only 20 percent of normal and just shy of the 1963 record of 0.22 inches (6 mm). After the second wettest August on record last year, precipitation has been lacking in the Wichita area. Water year to date precipitation (October-April) was only at 6.26 inches (159 mm), marking the 6th driest for this time period. On average, Wichita receives 12.70 inches (323 mm) from October to April. Interestingly, this has also been the driest start to a year in Wichita since the Dust Bowl year of 1936.
Although parts of the plains were dry, the mountain snowpack continued to be above average in Colorado, Wyoming, and Montana. The typical snowpack accumulation season has ended and snowmelt is underway. Widespread significant flooding due to mountain snowpack melting is not expected at this time. Some minor to moderate flooding could occur, however.
April 2014 was on the cooler side for the High Plains region, however temperature departures were not near as extreme as February or March. Below normal temperatures limited fieldwork in North Dakota as soil temperatures were too cool. As a result, all spring crops were behind the 5-year average, according to the National Agricultural Statistics Service. Cooler temperatures also hindered work in Colorado, as did high winds and scattered showers. Some crops were even damaged by the high winds which caused dust storms and uprooted winter wheat. Dust storms and freezing temperatures were a concern for the declining Kansas winter wheat crop as well.
In the High Plains region, there were only slight changes to the USDM this month as there were both improvements and degradations. By the end of the month, the total area in moderate (D1) to exceptional (D4) drought increased from 29 to 33 percent. In eastern Colorado, conditions worsened and D1 spread northward while extreme drought (D3) expanded eastward. Additionally, severe drought (D2) developed in the southwestern corner of the state. Meanwhile, D2 in Kansas spread eastward and two new areas of D3 emerged in the central part of the state. Nebraska had slight improvements where ample precipitation fell, but overall, there was a decline in conditions as D1 spread throughout the eastern part of the state. Abnormally dry conditions were reduced or eliminated in the Dakotas and Wyoming.
As explained by the Southern Regional Climate Center, April temperatures varied spatially across the Southern region, with the central portions of the region experiencing a slightly cooler than normal month. Precipitation totals for the month were plentiful in some parts of the region, while other portions experienced a very dry month. Most of Oklahoma and Texas remained very dry throughout the month. Stations in the southern tip of Texas averaged less than one fourth of normal precipitation. Similar departures from normal were also experienced in northern Oklahoma and in the west central counties of Texas.
Drought conditions in the Southern region worsened significantly over the past month. Most of the northern panhandle of Texas was now classified as exceptional drought (D4), the highest possible drought category that can be assigned by the USDM. The D4 drought also extends into western and northern Oklahoma. A second, but smaller area of D4 drought was also evident in the south of Texas, centered near Edwards County. Moderate drought was expanded to include a larger portion of eastern Texas. Elsewhere, drought conditions did not change too much, except for a small area in northern Mississippi that is now classified as moderate drought. In Texas, school districts in the Panhandle, such as Amarillo ISD, have begun to pay nearly double the water rate from a few years ago. In Wichita Falls, it is looking more and more likely that a Stage 5 drought declaration will be issued which will ban pools from being filled and close car washes two days a week. In all, 240 of the 252 counties in Texas qualified for federal drought disaster assistance by the end of April. In addition, agriculture did not fare well this month. Because of the continued lack of rain, a variety of other obstacles have struck the Panhandle's winter wheat crops. A late season freeze occurred over multiple days, dropping temperatures to the high 20s. Continued dust storms, sourced from several different locations, reduced visibility enough to cause several multi-car pile-ups and covering planting fields with several layers of dust. Crop watering has slowed due to water shortages in municipalities, meaning the wheat and cotton crops in the High Plains are in particular danger.
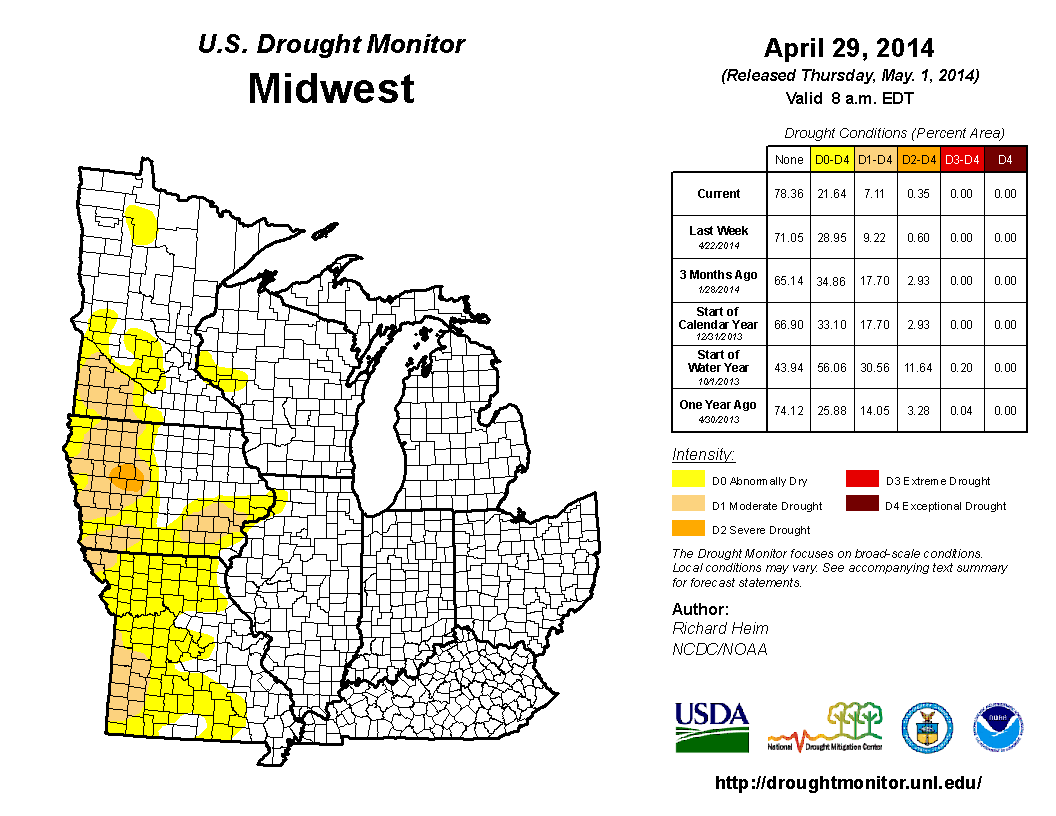
As summarized by the Midwest Regional Climate Center, April temperatures for the Midwest were below normal for the sixth straight month dating back to November 2013, while precipitation was above normal for most of the region, and well above normal for the northern states and also along the Ohio River. Some small areas of below normal precipitation were scattered around the Midwest (northwest Iowa, southwest Minnesota, southwest Missouri, and south central Michigan) with totals less than 75 percent of normal. Midwest drought coverage shrunk during April. Areas in the various drought categories all dropped to nearly half of the area affected early in the month. The driest areas remain in the western Midwest. Cool and wet weather has delayed spring planting somewhat. As of April 27th, Missouri is the only Midwest state that is ahead of its 5-year average for corn planting and just by a few percent. Illinois is just barely behind (1 percent) and the other seven Midwest states are between 9 and 26 percent behind for corn planting. Soybean planting is just beginning (0 to 2 percent) in the Midwest, putting it slightly behind the 5-year averages which are all under 10 percent as of April 27th.
As noted by the Southeast Regional Climate Center, mean temperatures were generally above average across the Southeast in April, and monthly precipitation was above average across much of the region. The driest locations were found along the Florida Peninsula, where monthly precipitation totals were generally between 1 and 2 inches (25.4 and 50.8 mm) below average. Monthly precipitation was variable across Puerto Rico and the U.S. Virgin Islands. For the second straight month, only small changes were noted in the USDM across the Southeast. Areas of moderate drought (D1) and abnormally dry conditions (D0) were eliminated across southern parts of Alabama and Georgia, while very small areas of D0 remained across extreme northern Georgia and northwest Alabama. Abnormally dry conditions also persisted across much of Puerto Rico. The heavy rains across northern Florida delayed the planting of row crops and vegetables, and forced some farmers to replant watermelons. In contrast, the warm and dry weather across South Florida aided in the harvesting of several fruit and vegetable crops. A colder than average winter across western North Carolina delayed the bloom of apples, which may have saved the crop from severe damage during the freeze near the end of the month. On the other hand, a lack of winter chill hours and cool spring temperatures contributed to a 2-3 week delay in blueberry production across Florida, resulting in up to a 30 percent increase in prices over last season.
As explained by the Northeast Regional Climate Center, while temperatures continued to be below normal for much of the Northeast, departures were not as large as in recent months. April was another drier-than-normal month in the Northeast. The region saw 3.55 inches (90.17 mm) of precipitation, 97 percent of normal. The states were split between above- and below-normal precipitation. Departures for the dry states ranged from 76 percent of normal in New Hampshire to 97 percent of normal in Connecticut. The wet states were actually drier than normal through most of April, but a late-month storm brought heavy rain that pushed departures above normal. Departures ranged from 101 percent of normal in Rhode Island to 131 percent of normal in Maryland. According to the USDM released April 3, part of northwestern Maine and a small area along the Vermont-New Hampshire border were abnormally dry. By April 24, the dryness near the Vermont-New Hampshire border expanded slightly and abnormally dry conditions were introduced in western Maryland, northeastern West Virginia, and a small part of southern Pennsylvania. While the dryness in Maryland, West Virginia, and Pennsylvania remained through month's end, the dryness in New England eased.
As summarized by the Western Regional Climate Center, conditions were variable across the West this month, fairly typical of the spring season. Temperatures were within a few degrees of normal across a majority of the West, though well above normal in California. Precipitation was characterized by pockets of both above and below normal precipitation scattered throughout the region. Although a majority of this month's storm systems favored the Pacific Northwest, some moisture made its way to parts of drought-stricken California and the Southwest, providing temporary irrigation support amid persistent drought. Most of this month's drier than normal areas were in the Southwest. Albuquerque, New Mexico, recorded only 0.01 in (less than 1 mm) this month, making it the 15th driest April since records began in 1897. For the second month in a row, Las Vegas received no precipitation. Las Vegas has only seen precipitation on one day (February 28, 0.3 in or 8 mm) since the start of the year, 16% of the normal 1.89 in (48 mm) for that period and only the 13th driest in a 67-year record. Coastal areas of southern California also saw below normal rainfall; Los Angeles recorded 0.35 in (9 mm), 38% of normal. In northern California, Arcata received 1.84 in (47 mm) of rain this month. This was 42% of normal, making this the 3rd driest April since records began for Arcata in 1945. Across the border in Oregon, light showers throughout the month in Klamath Falls accumulated to only 0.2 in (5 mm), 15% of normal and tie for the 5th driest April in a 67-year record. April saw further expansion of drought conditions in California, the Great Basin, Arizona and New Mexico. This is the first time in the 15-year history of the USDM that the entire state of California has been designated as D2-D4 (moderate to exceptional drought). Several municipalities in the West are in danger of running out of water in the near future, such as Montecito, in Southern California; Montague, in Northern California; and Monticello, Utah in the Four Corners area.
Outside the CONUS, average temperatures were above normal in western Alaska. Nome saw an April average of 28.4 F (-2 C), the 4th warmest since continuous records began in 1907. This was the 7th consecutive month of above normal average temperatures in Nome. Many locations in Interior and South Central Alaska were drier than normal this month. Anchorage recorded only 0.04 in (1 mm) precipitation, 9% of normal and the 5th driest April in the past 63 years. Further south, drought conditions improved for windward areas of Hawaii while leeward locations were drier than normal. On the windward side of the Big Island, Hilo received 13.37 in (340 mm) of rain, 116% of normal. This month saw the first time since June 2008 that the entire state of Hawaii has been free of D2 (severe drought) designation. In contrast, Lihue, Kauai, received 0.65 in (17 mm), 29% of normal and the 3rd driest April since records began in 1950.
Pacific Islands: According to reports from National Weather Service offices, the Pacific ENSO Applications Climate Center (PEAC), and partners, conditions varied across the Pacific Islands.
As noted by the National Weather Service office in Honolulu, the last area of severe drought, or the D2 category in the USDM map, was finally eased to moderate drought, or the D1 category, for the Kualapuu reservoir service area in west Molokai. This downgrade ended D2 conditions that had been present continuously in various locations in the state of Hawaii since June 2008. There were no other drought areas in the state.
Some drought impacts impacts in Hawaii include the following:
KAUAI...OAHU...LANAI...MAUI AND THE BIG ISLAND.
THERE ARE NO DROUGHT IMPACTS TO REPORT.  HOWEVER...DRIER THAN
AVERAGE CONDITIONS MAINLY ALONG THE LEEWARD SLOPES IN RECENT WEEKS
ARE SETTING THE STAGE FOR A QUICK RETURN OF SIGNIFICANT DROUGHT
CONDITIONS.

MOLOKAI.
THE WATER LEVEL IN THE KUALAPUU RESERVOIR HAS RISEN TO
PRE-DROUGHT LEVELS.  HOWEVER...THE STATE OF HAWAII DEPARTMENT OF
AGRICULTURE IS MAINTAINING THE MANDATORY 20 PERCENT CUTBACK IN
IRRIGATION WATER USE AS A PRECAUTION.
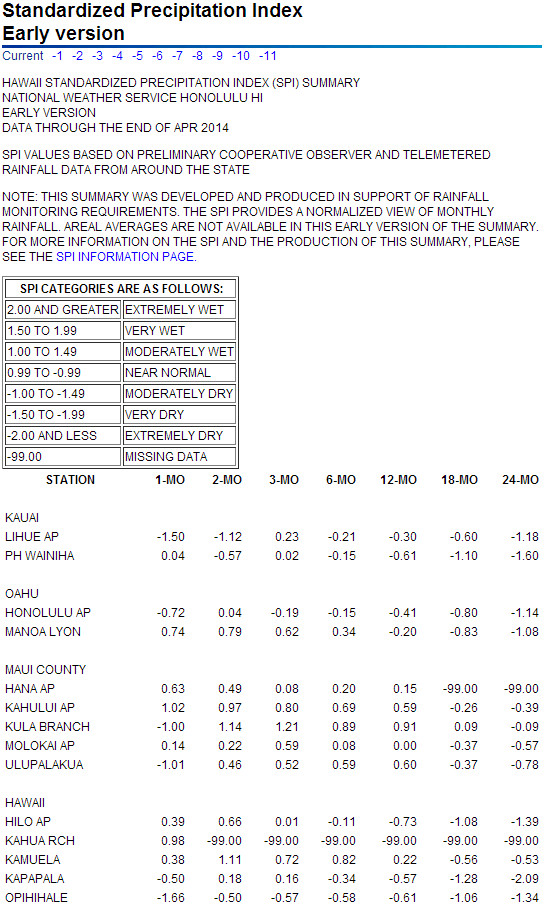
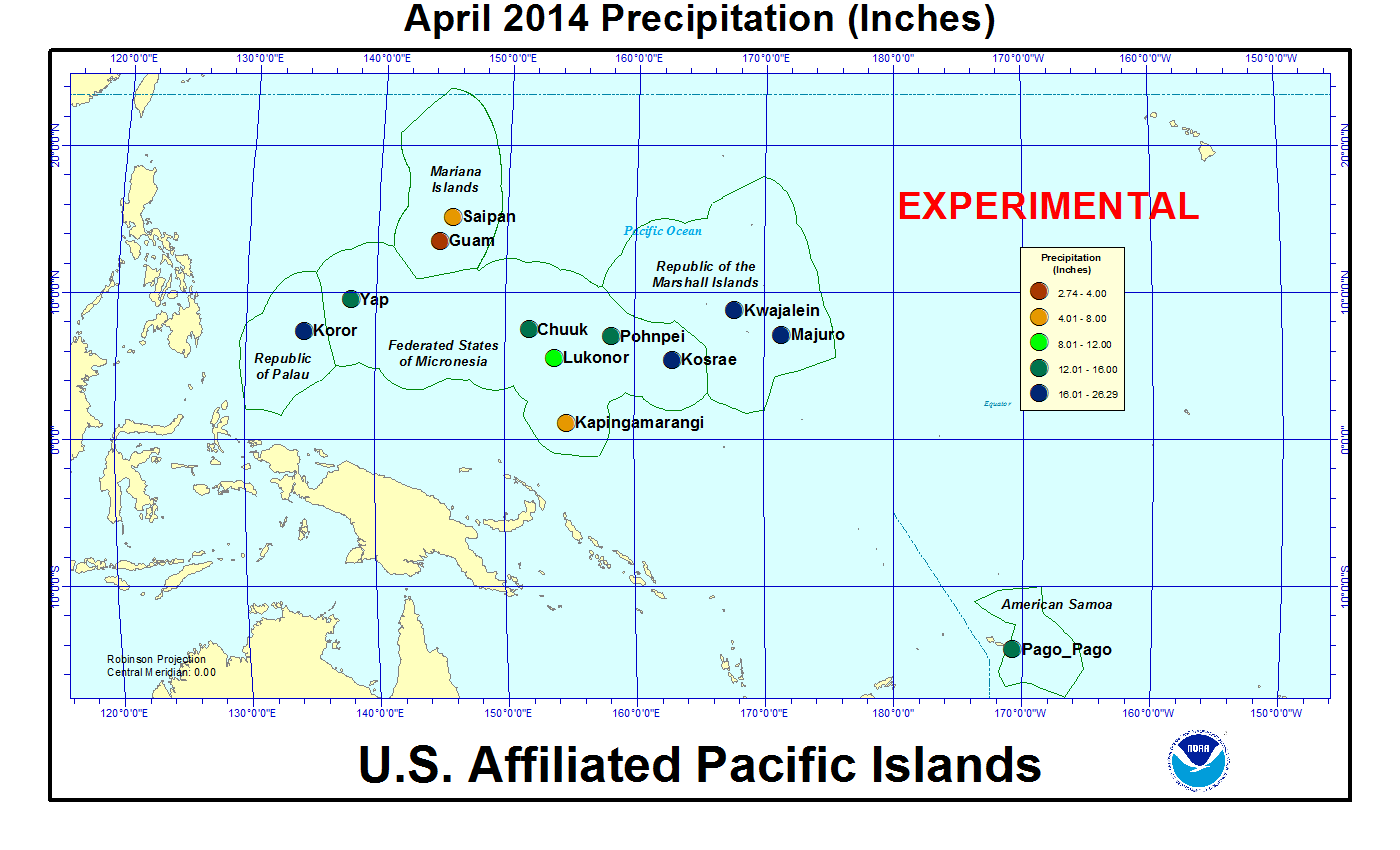
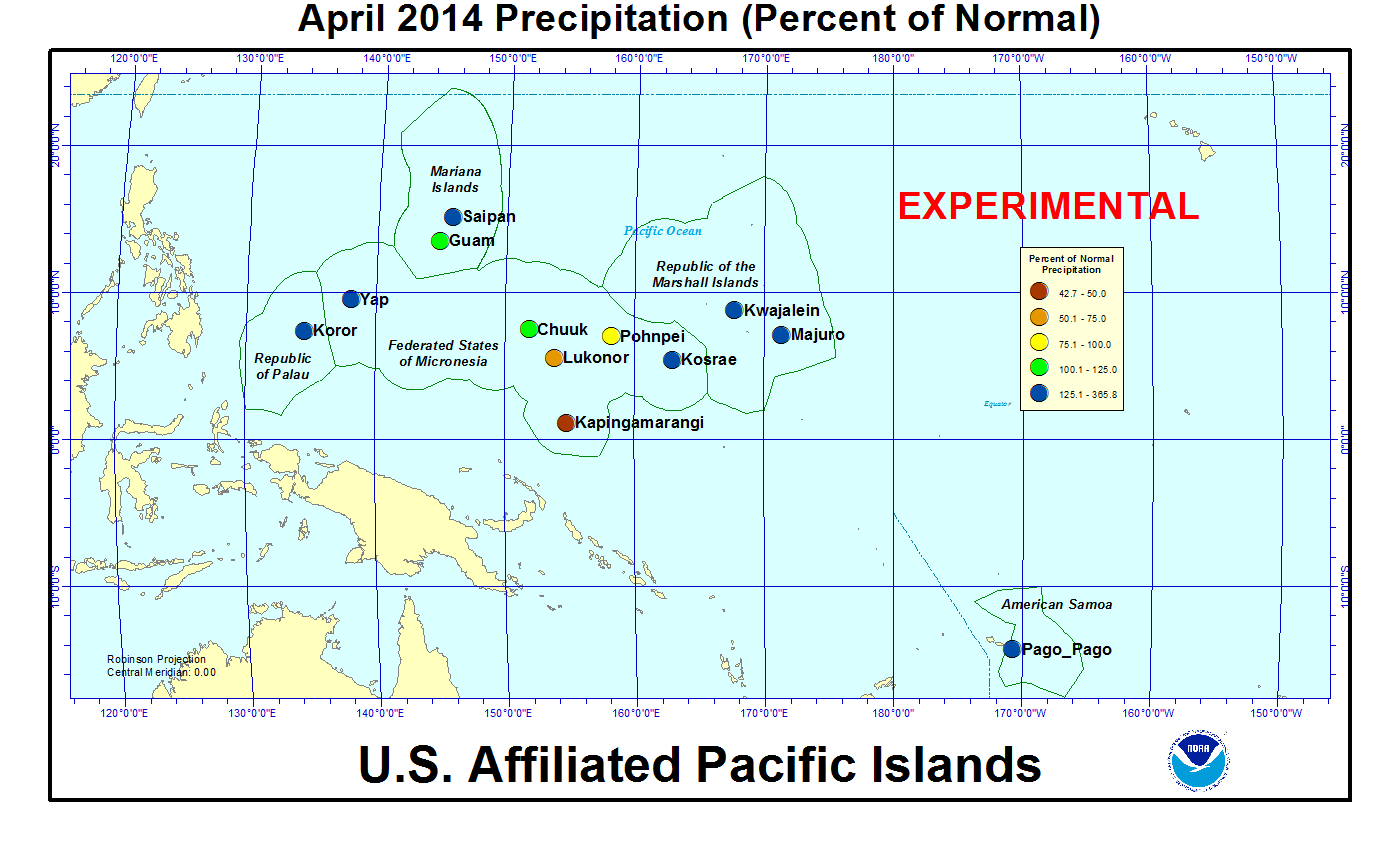
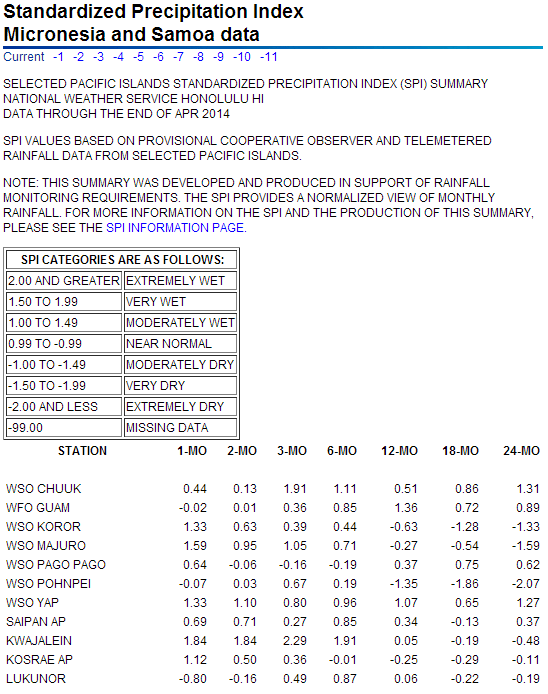
On other Pacific Islands (maps — Micronesia, Marshall Islands, basinwide), April 2014 was drier than normal at Kapingamarangi, Lukonor, and Pohnpei, and wetter than normal at the other reporting stations. The April rainfall amounts were below 4 inches (a critical threshold amount for the Mariana Islands) at Guam, below 8 inches (another critical threshold amount) at Kapingamarangi and Saipan, and above 8 inches at the other stations. The 4- and 8-inch thresholds are important because, if monthly precipitation falls below the threshold, then drought becomes a concern. Even though April 2014 rainfall was below these thresholds at Guam and Saipan, they were above normal because this is the dry season at these stations and their April normals are very low — well below the thresholds.
Well-above-normal rainfall from heavy showers has improved drought conditions across the Marshall Islands. Kwajalein has received 11 inches or more of rain each of the last three months, with April 2014 rainfall totalling 19.24 inches, filling water catchments. Majuro had 23.20 inches of rain during April. The northern Marshall Islands were still dry, but the nature of the drought has shifted, with it being a meteorological drought and having little impact on vegetation. The dry conditions in the Mariana Islands have resulted in scattered fires, but there were no reports of problems with the water supply on Guam or Saipan.
A few stations (Kapingamarangi, Koror, and Pohnpei) were drier than normal for the last twelve months (May 2013-April 2014), but wetter-than-normal conditions dominated at other time scales (November 2013-April 2014, January-April 2014, February-April 2014). Only Kapingamarangi was below normal so far this year.
| Station Name | May 2013 | Jun 2013 | Jul 2013 | Aug 2013 | Sep 2013 | Oct 2013 | Nov 2013 | Dec 2013 | Jan 2014 | Feb 2014 | Mar 2014 | Apr 2014 | May- Apr |
|---|---|---|---|---|---|---|---|---|---|---|---|---|---|
| Chuuk | 79% | 84% | 84% | 80% | 141% | 103% | 111% | 75% | 59% | 492% | 89% | 111% | 110% |
| Guam NAS | 103% | 102% | 53% | 74% | 255% | 198% | 56% | 65% | 421% | 170% | 141% | 108% | 117% |
| Kapingamarangi | 48% | 47% | 50% | 83% | 55% | 85% | 38% | 254% | 168% | 112% | 81% | 43% | 74% |
| Koror | 109% | 67% | 64% | 99% | 64% | 86% | 115% | 64% | 170% | 91% | 68% | 224% | 88% |
| Kosrae | 76% | 122% | 69% | 62% | 104% | 201% | 112% | 87% | 86% | 104% | 82% | 150% | 86% |
| Kwajalein | 29% | 67% | 98% | 57% | 82% | 37% | 121% | 39% | 121% | 523% | 475% | 366% | 110% |
| Lukonor | 92% | 64% | 37% | 62% | 117% | 118% | 125% | 90% | 257% | 206% | 138% | 72% | 93% |
| Majuro | 65% | 96% | 103% | 65% | 87% | 71% | 96% | 51% | 125% | 177% | 91% | 246% | 99% |
| Pago Pago | 66% | 220% | 153% | 337% | 125% | 62% | 58% | 99% | 146% | 97% | 65% | 152% | 103% |
| Pohnpei | 52% | 113% | 61% | 38% | 121% | 81% | 142% | 36% | 78% | 225% | 112% | 87% | 87% |
| Saipan | 203% | 157% | 50% | 53% | 167% | 109% | 52% | 71% | 546% | 55% | 167% | 168% | 112% |
| Yap | 69% | 134% | 53% | 86% | 181% | 144% | 74% | 65% | 340% | 91% | 153% | 226% | 118% |
| Station Name | May 2013 | Jun 2013 | Jul 2013 | Aug 2013 | Sep 2013 | Oct 2013 | Nov 2013 | Dec 2013 | Jan 2014 | Feb 2014 | Mar 2014 | Apr 2014 | May- Apr |
|---|---|---|---|---|---|---|---|---|---|---|---|---|---|
| Chuuk | 8.93" | 9.85" | 10.04" | 10.25" | 16.49" | 11.82" | 11.82" | 8.44" | 5.98" | 35.70" | 7.43" | 13.80" | 150.55" |
| Guam NAS | 3.51" | 6.32" | 5.39" | 10.84" | 32.25" | 22.66" | 4.13" | 3.33" | 16.89" | 5.14" | 2.91" | 2.74" | 116.11" |
| Kapingamarangi | 5.84" | 6.45" | 7.11" | 6.72" | 5.42" | 6.99" | 3.49" | 25.02" | 15.38" | 10.36" | 9.26" | 5.83" | 107.87" |
| Koror | 12.87" | 11.70" | 11.94" | 13.35" | 7.53" | 10.19" | 13.11" | 7.19" | 17.27" | 7.79" | 5.08" | 16.38" | 134.4" |
| Kosrae | 13.41" | 17.89" | 10.33" | 8.80" | 14.82" | 22.03" | 15.54" | 13.94" | 14.39" | 13.47" | 13.12" | 26.29" | 184.03" |
| Kwajalein | 1.97" | 4.66" | 9.71" | 5.51" | 8.81" | 4.17" | 13.63" | 2.62" | 3.81" | 13.82" | 11.17" | 19.24" | 99.12" |
| Lukonor | 10.77" | 7.51" | 5.88" | 8.64" | 11.92" | 13.34" | 11.38" | 10.11" | 21.65" | 18.42" | 12.76" | 8.18" | 140.56" |
| Majuro | 6.60" | 10.55" | 11.51" | 7.62" | 9.70" | 9.01" | 12.84" | 5.76" | 9.66" | 12.19" | 5.96" | 23.20" | 124.6" |
| Pago Pago | 6.35" | 11.75" | 8.48" | 18.14" | 8.14" | 5.71" | 5.91" | 12.71" | 19.54" | 11.65" | 6.95" | 14.29" | 129.62" |
| Pohnpei | 10.44" | 16.79" | 9.42" | 5.41" | 15.23" | 12.37" | 20.99" | 5.79" | 10.27" | 21.50" | 14.70" | 15.96" | 158.87" |
| Saipan | 4.82" | 5.68" | 4.42" | 6.99" | 16.87" | 11.60" | 2.91" | 2.74" | 13.81" | 1.43" | 3.16" | 4.41" | 78.84" |
| Yap | 5.41" | 16.16" | 8.01" | 12.69" | 24.39" | 17.60" | 6.56" | 5.56" | 21.74" | 4.72" | 6.99" | 12.72" | 142.55" |
| Station Name | May 2013 | Jun 2013 | Jul 2013 | Aug 2013 | Sep 2013 | Oct 2013 | Nov 2013 | Dec 2013 | Jan 2014 | Feb 2014 | Mar 2014 | Apr 2014 | May- Apr |
|---|---|---|---|---|---|---|---|---|---|---|---|---|---|
| Chuuk | 11.30" | 11.66" | 11.98" | 12.86" | 11.71" | 11.51" | 10.61" | 11.25" | 10.10" | 7.25" | 8.32" | 12.47" | 136.77" |
| Guam NAS | 3.40" | 6.18" | 10.14" | 14.74" | 12.66" | 11.44" | 7.38" | 5.11" | 4.01" | 3.03" | 2.07" | 2.53" | 99.09" |
| Kapingamarangi | 12.08" | 13.78" | 14.15" | 8.13" | 9.93" | 8.19" | 9.27" | 9.84" | 9.15" | 9.27" | 11.43" | 13.64" | 145.85" |
| Koror | 11.83" | 17.48" | 18.53" | 13.50" | 11.77" | 11.84" | 11.39" | 11.16" | 10.18" | 8.56" | 7.44" | 7.32" | 152.90" |
| Kosrae | 17.75" | 14.64" | 14.91" | 14.22" | 14.22" | 10.94" | 13.83" | 16.11" | 16.67" | 12.93" | 16.06" | 17.51" | 213.87" |
| Kwajalein | 6.72" | 6.93" | 9.87" | 9.74" | 10.74" | 11.18" | 11.28" | 6.66" | 3.16" | 2.64" | 2.35" | 5.26" | 90.41" |
| Lukonor | 11.69" | 11.65" | 15.93" | 14.04" | 10.15" | 11.32" | 9.08" | 11.27" | 8.41" | 8.93" | 9.26" | 11.31" | 151.36" |
| Majuro | 10.11" | 11.01" | 11.17" | 11.69" | 11.17" | 12.73" | 13.44" | 11.39" | 7.74" | 6.88" | 6.58" | 9.42" | 125.25" |
| Pago Pago | 9.66" | 5.33" | 5.55" | 5.38" | 6.53" | 9.26" | 10.14" | 12.84" | 13.34" | 12.00" | 10.68" | 9.39" | 125.57" |
| Pohnpei | 19.96" | 14.81" | 15.43" | 14.26" | 12.55" | 15.27" | 14.83" | 16.08" | 13.18" | 9.55" | 13.17" | 18.41" | 182.36" |
| Saipan | 2.38" | 3.62" | 8.91" | 13.13" | 10.09" | 10.62" | 5.61" | 3.85" | 2.53" | 2.59" | 1.89" | 2.63" | 70.25" |
| Yap | 7.85" | 12.04" | 15.08" | 14.82" | 13.50" | 12.18" | 8.83" | 8.51" | 6.39" | 5.19" | 4.56" | 5.63" | 120.31" |


[top]
State/Regional/National Moisture Status
A detailed review of drought and moisture conditions is available for all contiguous U.S. states, the nine standard regions, and the nation (contiguous U.S.):
| northeast u. s. | east north central u. s. | central u. s. |
| southeast u. s. | west north central u. s. | south u. s. |
| southwest u. s. | northwest u. s. | west u. s. |
| Contiguous United States |
[top]
Contacts & Questions