|
Contents Of This Report: |


|
Please note that the values presented in this report are based on preliminary data. They will change when the final data are processed, but will not be replaced on these pages.
National Drought Overview
|
|
[top]
Detailed Drought Discussion
Overview
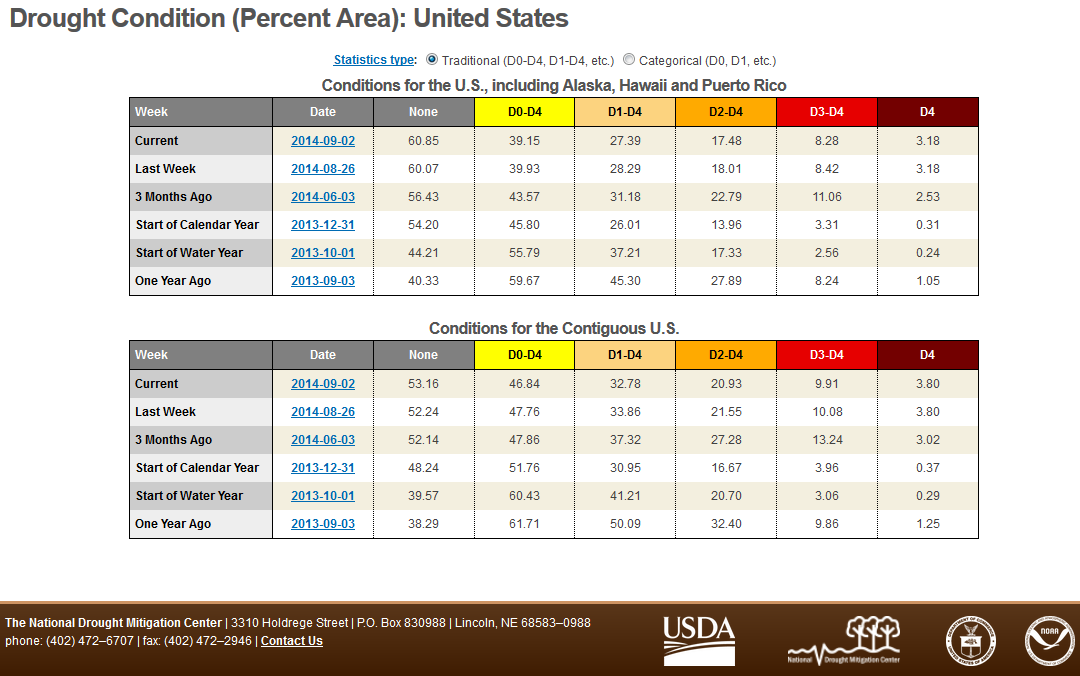
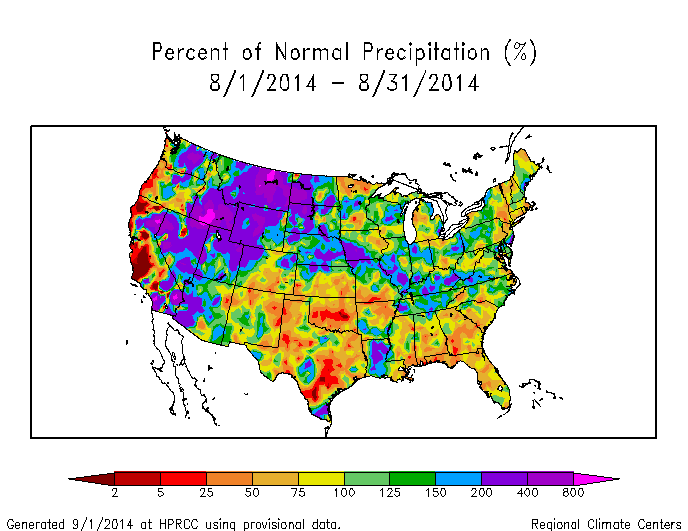
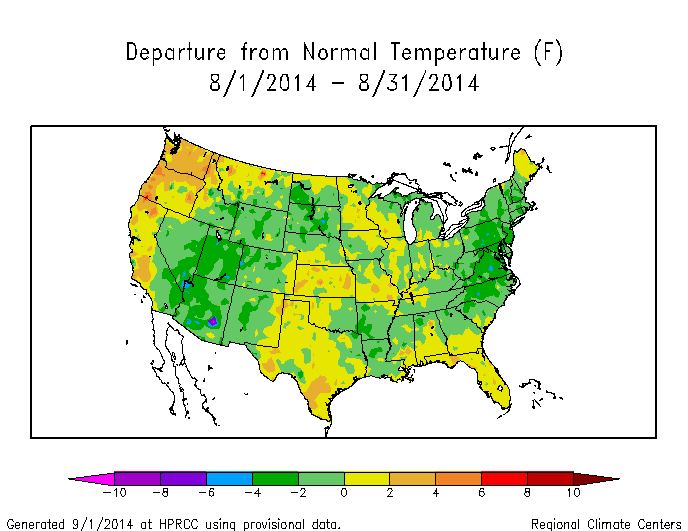
During August 2014, many vigorous short-wave troughs and ridges migrated through an active jet stream, dragging surface fronts and surface low pressure systems along with them. These systems brought above-normal precipitation to the Northern Rockies and Northern and Central Plains, and to parts of the Midwest to Mid-Atlantic states. Monsoon showers dumped above-normal moisture over parts of the southwestern U.S., while subsiding air from the subtropical Bermuda High kept precipitation below normal across much of the Southern Plains to Southeast. The busy parade of troughs and ridges dragged competing warm and cold fronts across the country, resulting in a temperature pattern that was near normal across much of the country, except for areas of cooler-than-normal weather in the Southwest associated with the monsoon rains, below-normal temperatures in the Mid-Atlantic region where troughing dominated, and warmer-than-normal temperatures along the West Coast and Gulf of Mexico coast. The above-normal rainfall helped reduce drought in the Central Plains and Southwest, but drought expanded or intensified in parts of the Southern Plains and Southeast where rainfall was lacking this month. Alaska was generally warmer than normal with a precipitation pattern that was drier than normal in the west and wetter than normal in the east. Hawaii had a mixed precipitation pattern. When integrated across the CONUS, August 2014 ranked as the eleventh wettest August in the 1895-2014 record. On balance, the national drought footprint contracted when compared to last month, decreasing to about 27.4 percent of the U.S. as a whole, according to USDM statistics. According to the Palmer Drought Index, which goes back to the beginning of the 20th century, about 24 percent of the CONUS was in moderate to extreme drought at the end of August, a decrease of about 2 percent compared to last month.
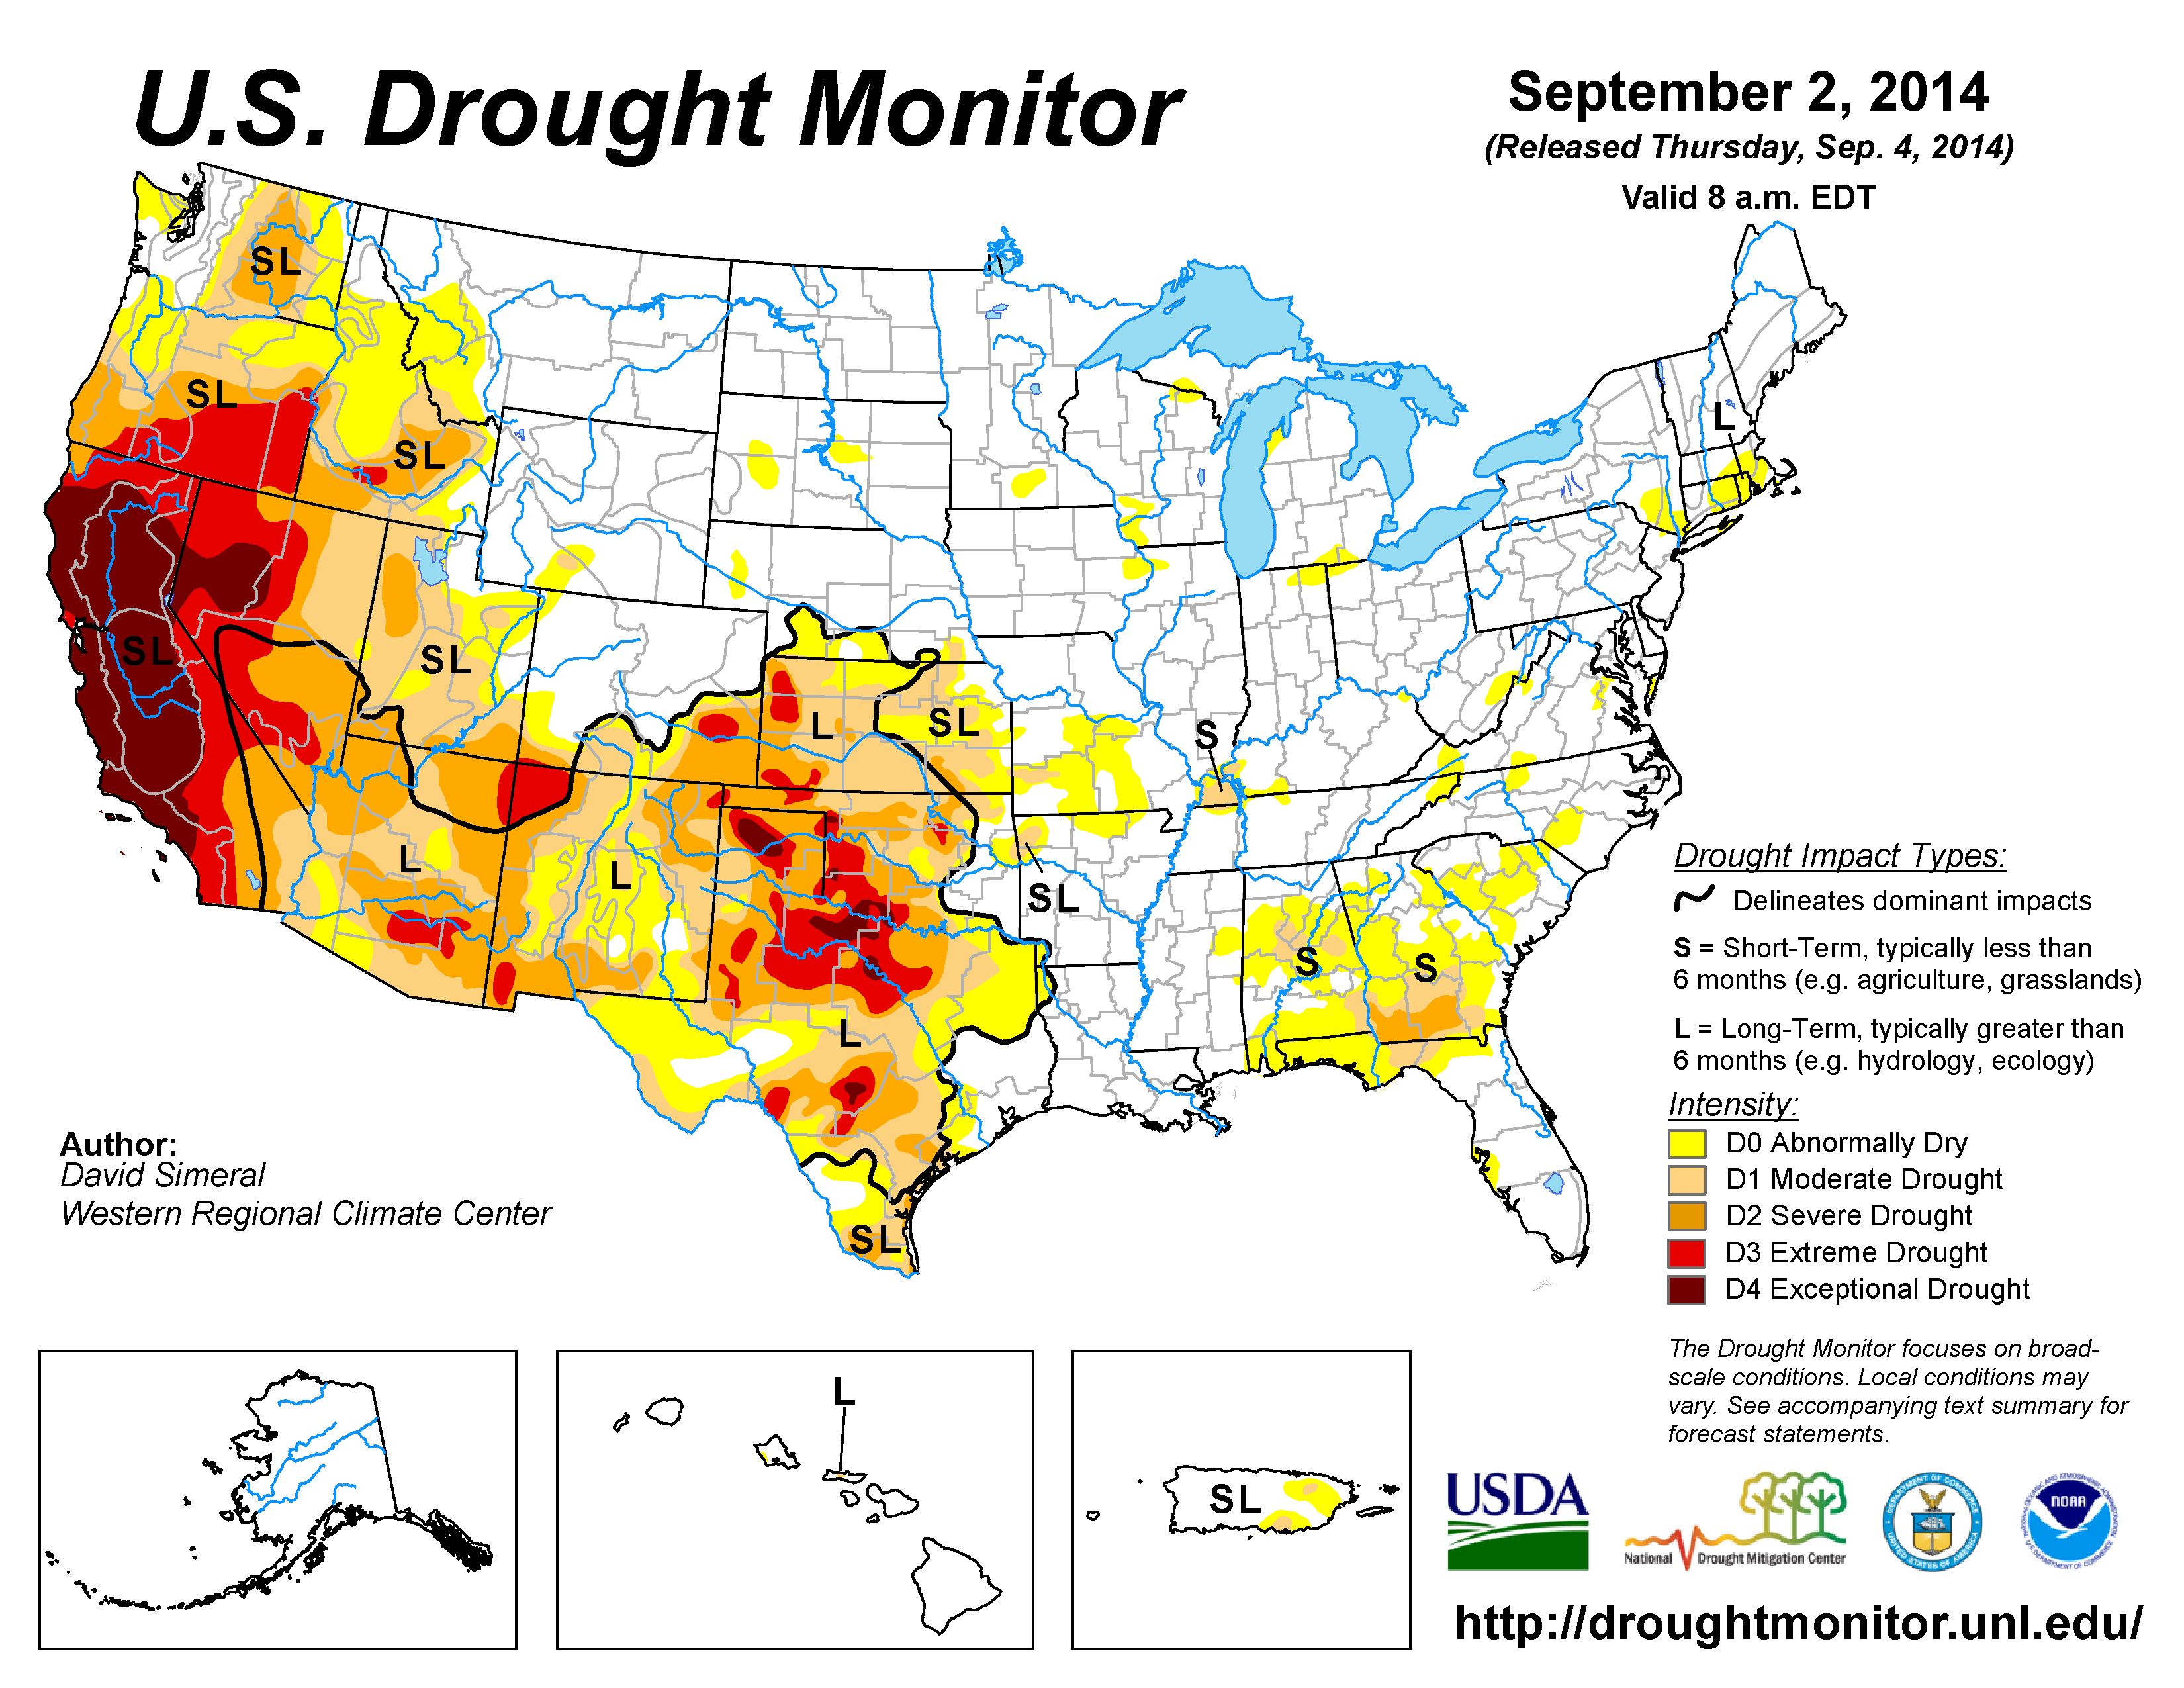
The U.S. Drought Monitor drought map valid September 2, 2014.
By the end of the month:
- moderate (D1) drought covered a large area of the U.S. from the West Coast to the Great Plains, connected across parts of New Mexico, with large areas of severe (D2) drought in the moderate drought area;
- there were two epicenters of extreme (D3) to exceptional (D4) drought, within this large moderate to severe drought area — one located in the California-Nevada-Oregon region and the other in the Southern Plains centered in northern Texas and adjacent Oklahoma;
- areas of moderate to severe drought were growing in the Southeast, with a small pocket of moderate drought lingering in the Ohio Valley;
- moderate drought (D1) and abnormally dry conditions (D0) lingered in Puerto Rico; and
- a small area of moderate drought (Molokai) and abnormal dryness (Oahu) lingered in Hawaii.

Percent area of the CONUS in moderate to exceptional drought, January 4, 2000 to present, based on the U.S. Drought Monitor.
Palmer Drought Index
The Palmer drought indices measure the balance between moisture demand (evapotranspiration driven by temperature) and moisture supply (precipitation). The Palmer Z Index depicts moisture conditions for the current month, while the Palmer Hydrological Drought Index (PHDI) and Palmer Drought Severity Index (PDSI) depict the current month's cumulative moisture conditions integrated over the last several months. While both the PDSI and PHDI indices show long-term moisture conditions, the PDSI depicts meteorological drought while the PHDI depicts hydrological drought. The PDSI map shows less severe and extensive drought in the West and parts of the Plains than the PHDI map because the meteorological conditions that produce drought are not as long-lasting as the hydrological impacts.
|
 |
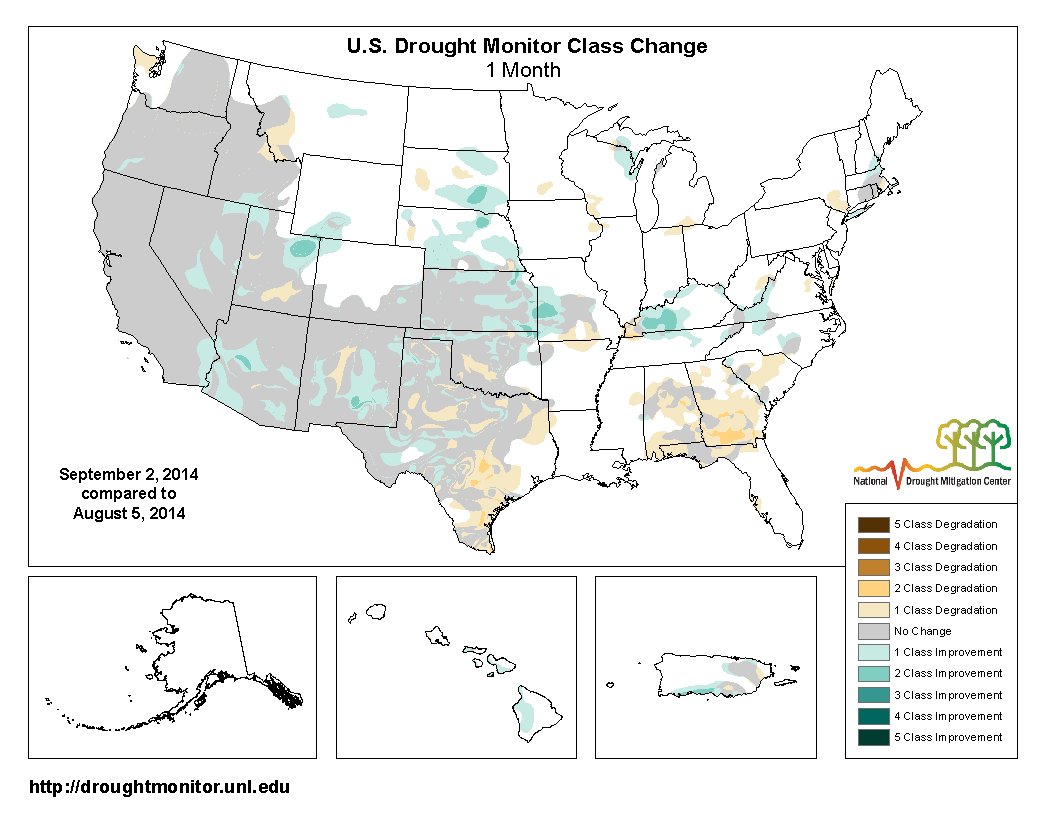
Used together, the Palmer Z Index and PHDI maps show that short-term wet or normal conditions occurred during August over much of the Southwest to Northern and Central Rockies which had areas in long-term drought during July, resulting in contraction of drought by the end of August. Short-term dry conditions occurred over parts of the Southwest to Southern Plains, which had areas in long-term drought during July, resulting in an intensification of drought by the end of August. Short-term dry conditions also occurred over parts of the Southeast, eliminating long-term wetness and introducing an area of moderate drought. Wet short-term conditions occurred over parts of the long-term near normal to wet areas of the Northern Plains to Northeast, resulting in expansion and intensification of the wet spell areas there.
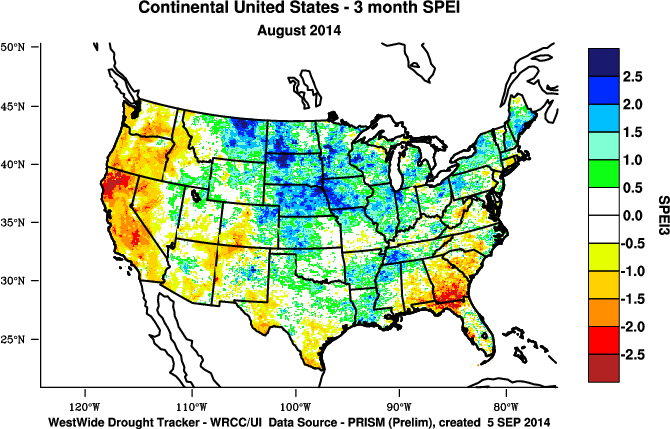
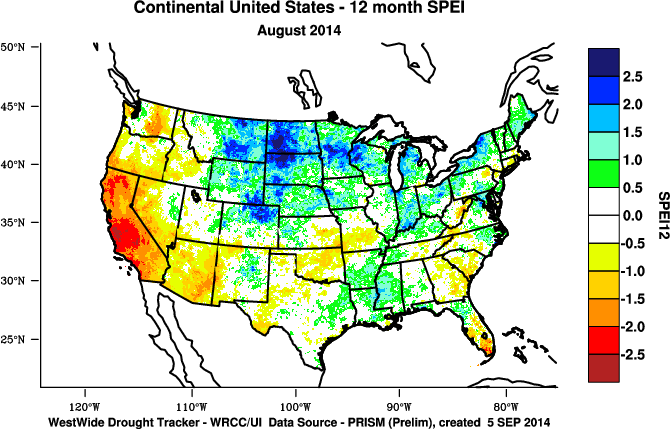
Standardized Precipitation Index
The Standardized Precipitation Index (SPI) measures moisture supply. The SPI maps here show the spatial extent of anomalously wet and dry areas at time scales ranging from 1 month to 24 months.
 |
 |
 |
The SPI maps illustrate how moisture conditions have varied considerably through time and space over the last two years. Monsoon rains brought above-normal precipitation to parts of the West during August and July, and these rains have been enough to neutralize dryness at the 2- to 3-month time scales, but it has not been enough to erase longer-term deficits, beginning at the 6-month time scale in the Southwest. Most of the West is neutral to dry beginning at the 9-month time scale. Dryness in the Southeast dominates at the 1- to 3-month time scales, and is evident in South Carolina at 9 months, but neutral to wet conditions are the rule at 9 to 24 months. The Southern Plains is characterized by mostly neutral to dry conditions at most time scales, except neutral to wet prevails at the 3 months. Neutral to dry conditions appear across parts of the Midwest, especially the Upper Mississippi Valley, at 2 months, and in the Northeast for August, but wet conditions dominate from the Northern Plains, across the Midwest, to the Northeast at most time scales.
 |
 |
 |
Agricultural, Hydrological, and Meteorological Indices and Impacts
 |
 |
Drought conditions were reflected in numerous agricultural, hydrological, and other meteorological indicators, both observed and modeled.
Modeled and observed topsoil moisture improved locally where it rained, especially in the Northern and Central Plains and Southwest, and topsoils dried out where it didn't. The weekly Palmer Crop Moisture Index (CMI) showed improving conditions throughout the month in the West, while crop moisture deteriorated in the Southern to Central Plains and Southeast (weeks 1, 2, 3, 4, 5). According to September 1st statistics from the U.S. Department of Agriculture (USDA), 50 percent or more of the topsoil was rated short or very short of moisture (dry or very dry) in California (80%), Delaware (79%), Texas (78%), Georgia (65%), Oregon (63%), New Mexico (60%), Alabama (58%), Washington (56%), Oklahoma (56%), and Arkansas (53%). Subsoil moisture continued to be dry to very dry across these states, with more than 50 percent of the subsoil moisture rated short or very short in California (85%), Texas (77%), Nevada (70%), Oklahoma (69%), Washington (64%), and Oregon (63%), New Mexico (62%), Georgia (59%), Alabama (57%), Kansas (56%), and Delaware (52%).
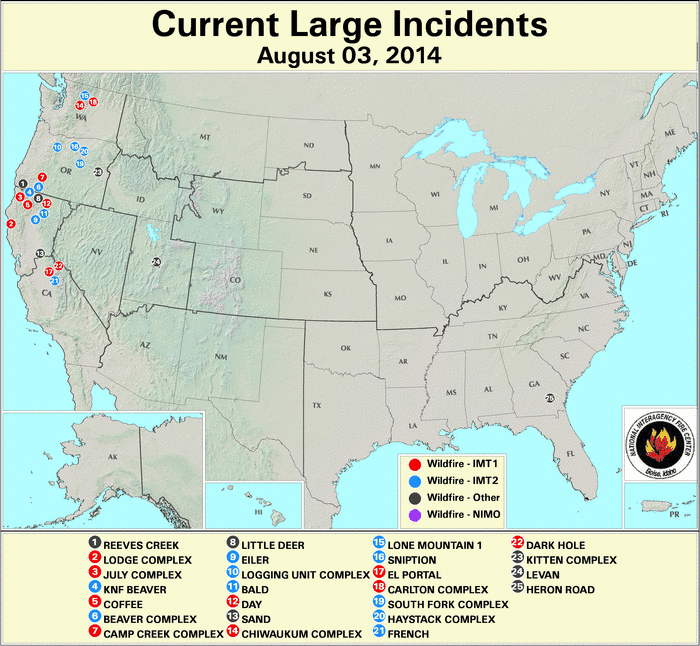
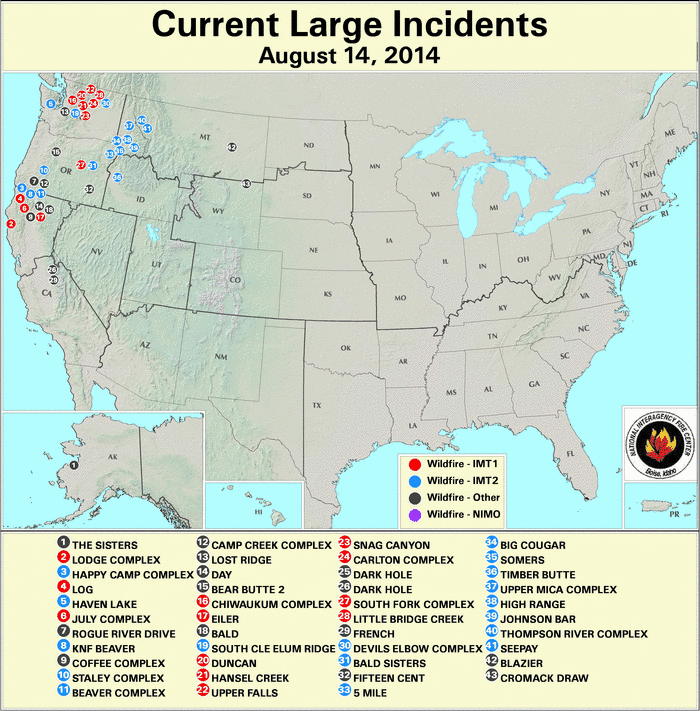
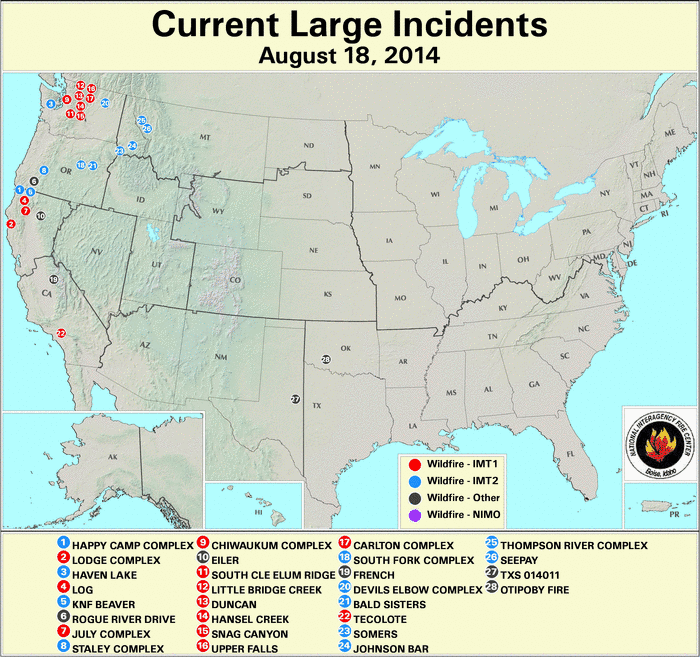
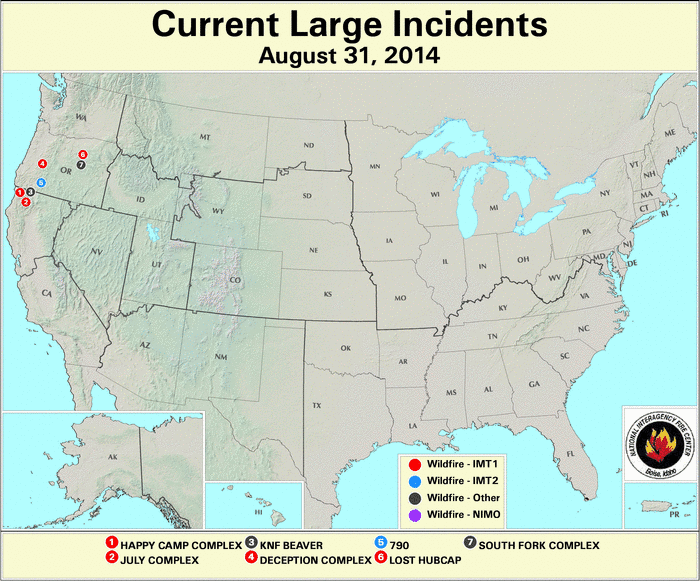
Vegetation continued to be stressed, especially across much of the Southern Plains to West. As of September 2nd, about 22 percent of hay was in drought (down 3 percent from four weeks ago), 7 percent of corn (down 1 percent), 3 percent of soybeans (down 2 percent), 33 percent of the cattle inventory (down 2 percent), and 42 percent of winter wheat (down 5 percent). September 2nd USDA reports indicated that eight percent of the nation's spring wheat crop was rated in poor to very poor condition, up three percent from a month ago, with 36 percent so rated in Washington state and 22 percent in Idaho. Six percent of the soybean crop and seven percent of the corn crop were rated in poor to very poor condition. Nationally, 20 percent of the pasture and rangeland was in poor to very poor condition, with statewide values over 50 percent in California (75%), but improving in New Mexico (45%) and Arizona (32%), and worsening in Oregon (46%) and Texas (37%). The hot temperatures, low humidities, and prolonged dryness contributed to the development of large wildfires in many parts of the West early in the month, but rain from low pressure systems and fronts at mid-month helped reduce the number of wildfires by the end of the month.

USDA West statewide reservoir status.
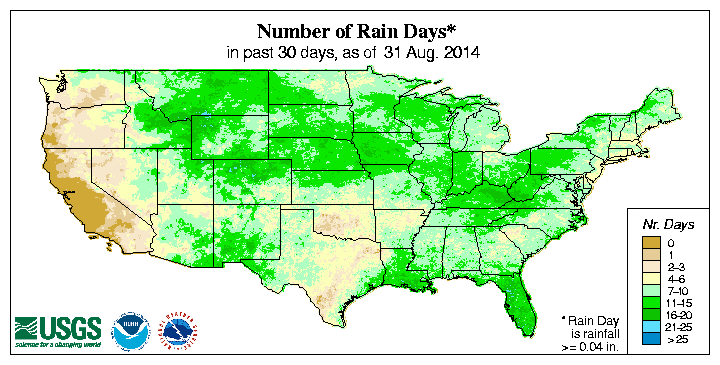
The subnormal precipitation in the Far West was reflected in below-normal monthly precipitation totals as well as lack of rain days and long runs of consecutive dry days. These indicators also showed dryness in parts of the Southern Plains.
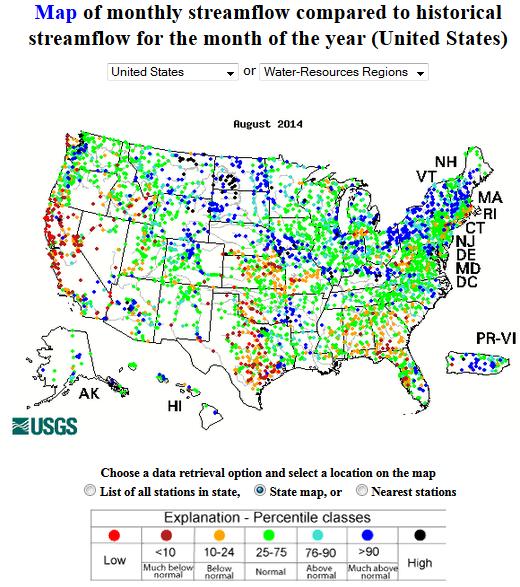
Streamflow and modeled runoff averaged below normal across parts of the West, Plains, and Southeast, with some basins averaging much below normal and some stream gauges measuring record low monthly values for August.
The monsoon precipitation in the Southwest during
Regional Discussion
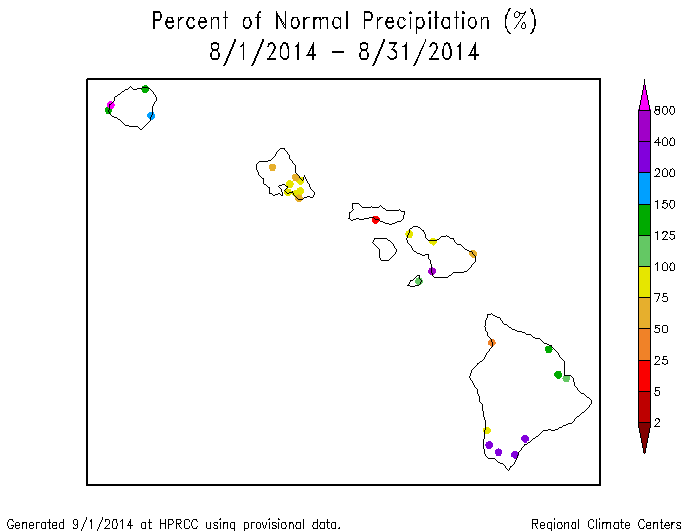
Hawaii: The August 2014 precipitation pattern was mixed across Hawaii, with the central islands generally drier than normal and the northern and southern main islands wetter than normal. Recent rains have brought predominantly wetter-than-normal conditions to most of the stations in the short term (last 2, 3, 5, 6, and 8 months), but drier-than-normal conditions dominate at the longer term (last 24 and 36 months), with a mixed pattern in between (last 11-12 months). On the USDM map, moderate drought continued to cover less than one percent of the state, reflecting the low reservoir situation in central Molokai. The area in abnormally dry conditions contracted due to widespread rains that occurred with Tropical Storm Iselle earlier in the month.
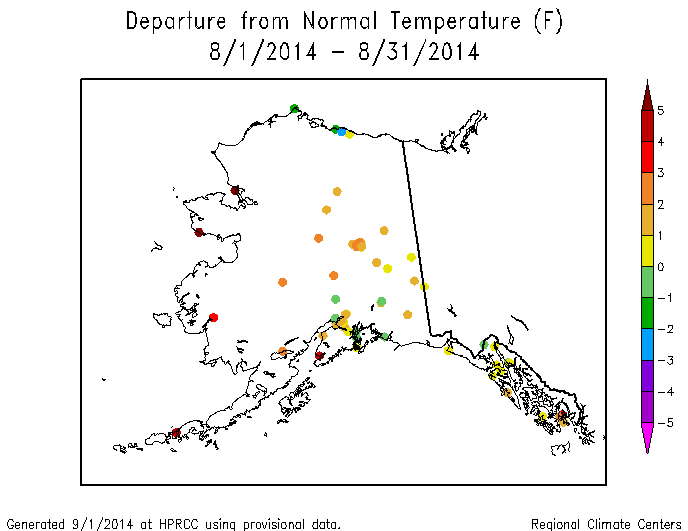
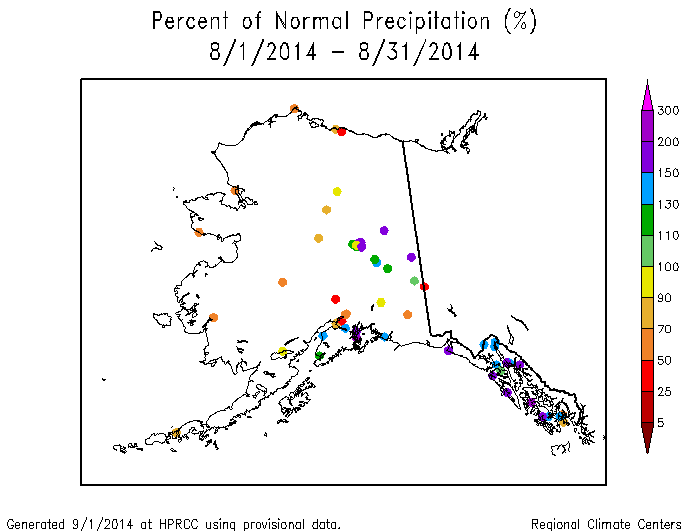
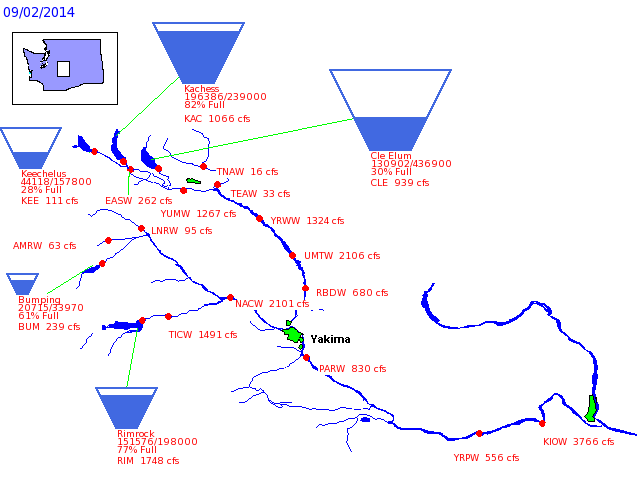
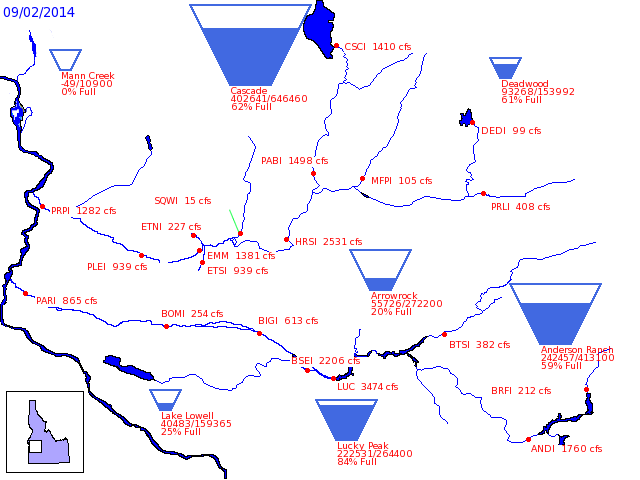
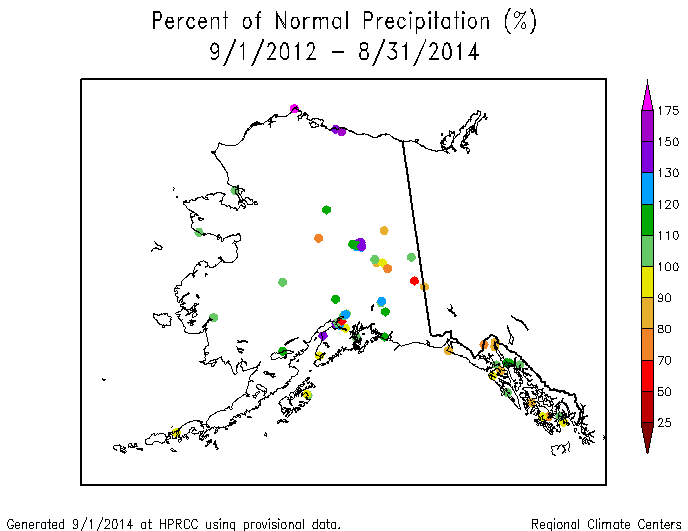
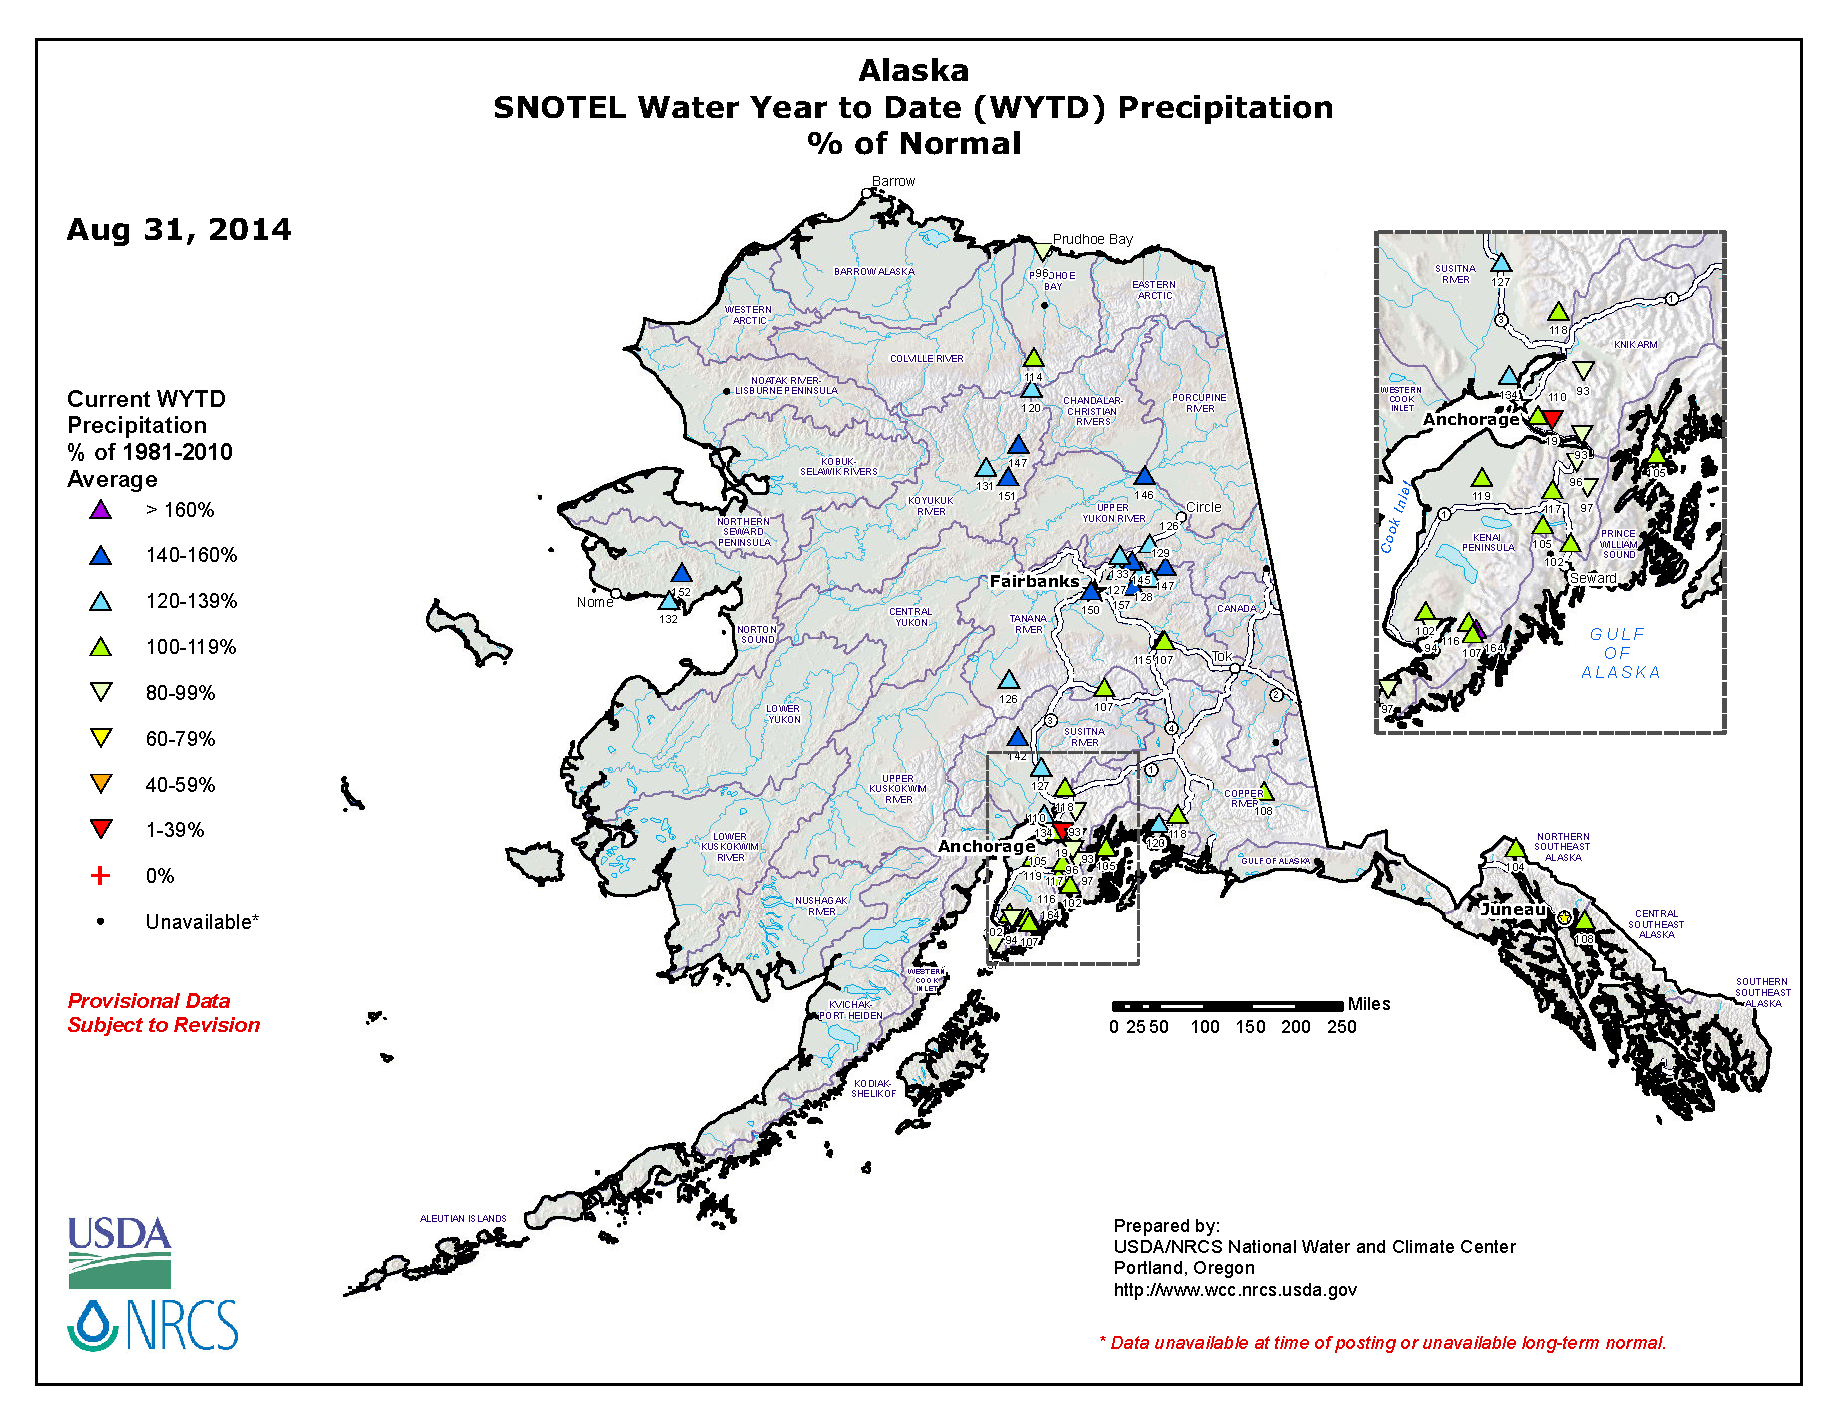
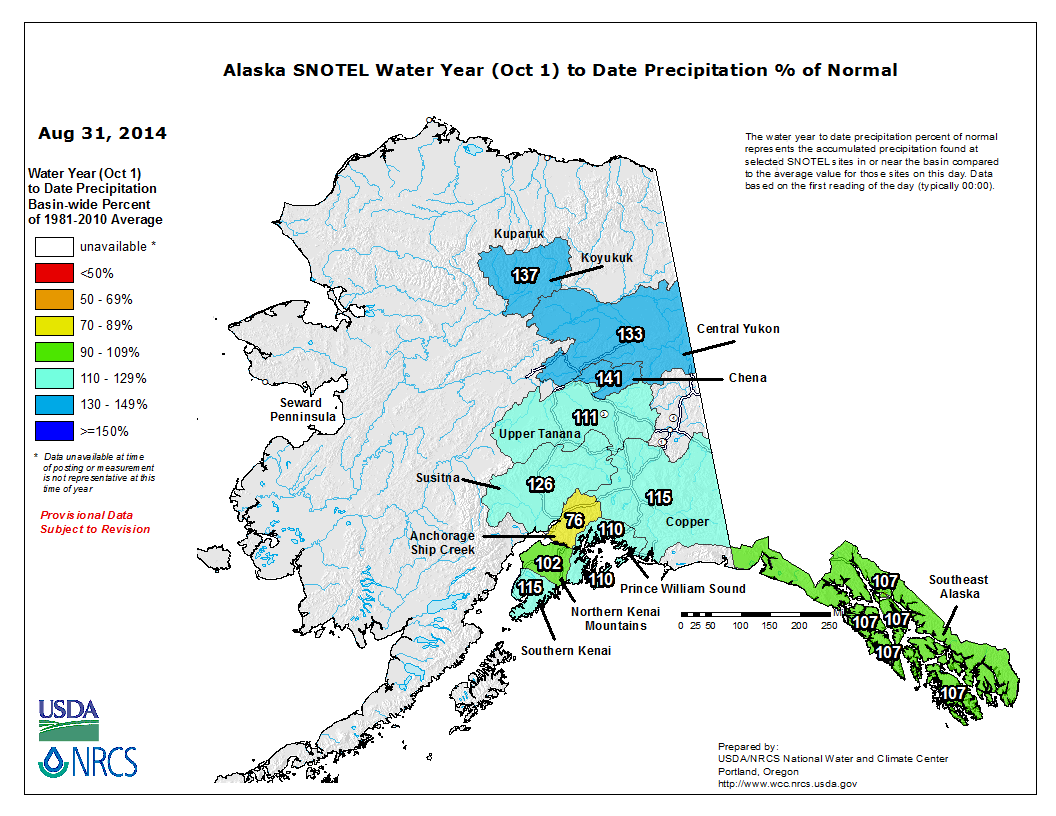
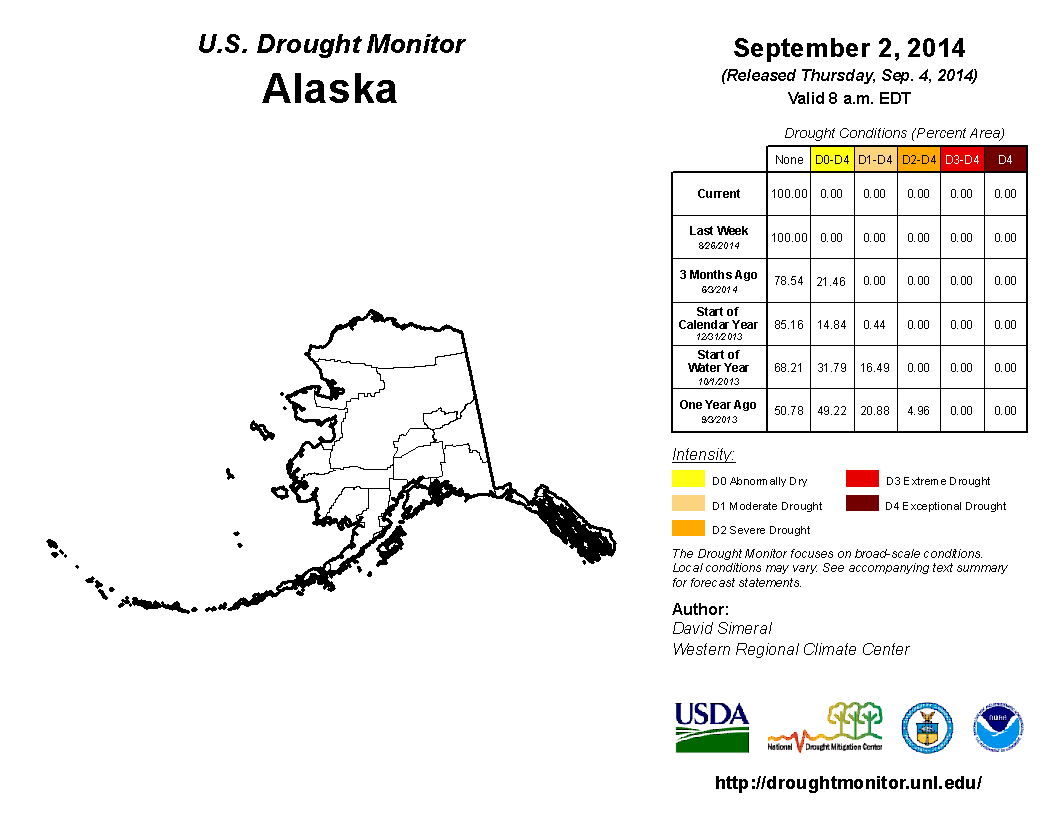
Alaska: Alaska was generally drier than normal in the west and wetter than normal in the east during August. This pattern generally holds for the short term (last 2, 3, 5, 6, and 8 months), except the wet conditions become a little more widespread and some dryness appears at interior southeast stations. The pattern reverses at the longer time scales (last 11, 12, 24, and 36 months), with wetter-than-normal conditions in the west and drier-than-normal stations scattered across the south and interior. The high elevation (SNOTEL) stations and basins were generally wetter than normal for the water year to date (October 1, 2013-present). The September 2nd USDM map was free of drought and abnormal dryness.
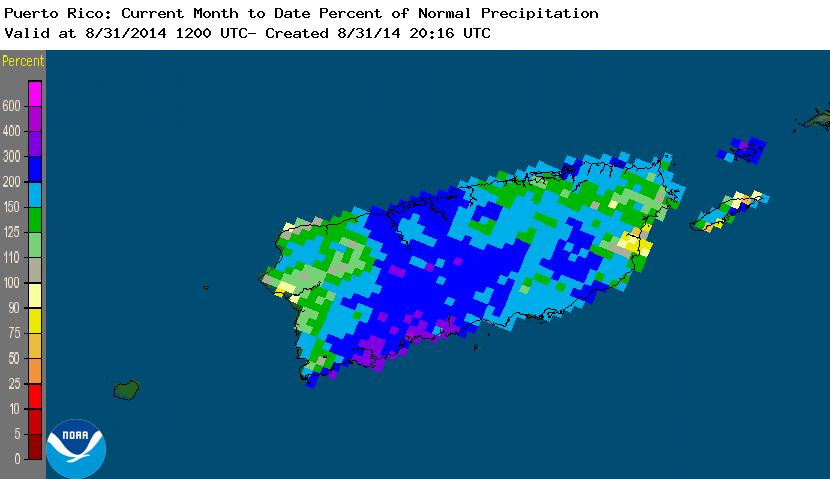
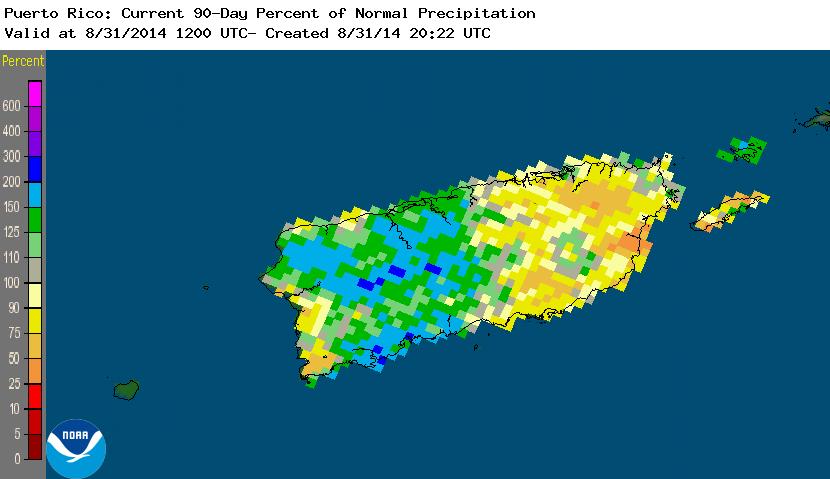
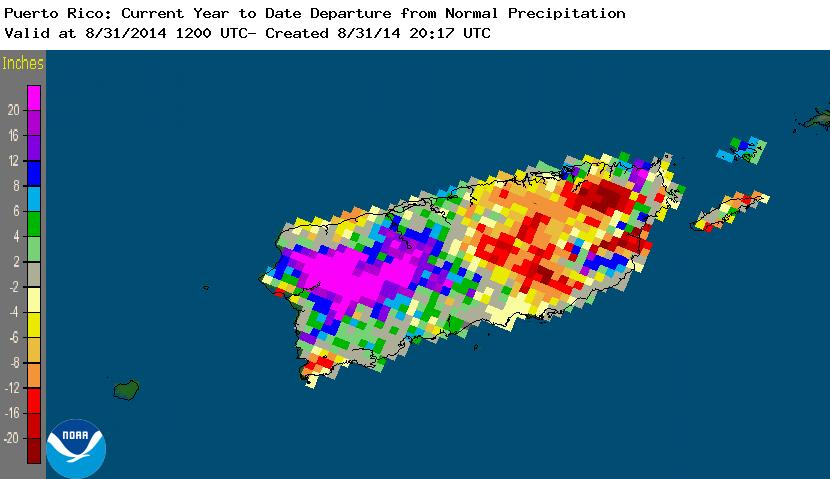
Puerto Rico: Locally heavy rains from the tropical systems that would become Hurricanes Bertha and Cristobal brought wetter-than-normal conditions across Puerto Rico during August and, for most of the island, extending to the 2-month period (July-August). But long-term rainfall deficits were evident at longer time scales (last 3, 6, 8, and 11 months), especially in the east and south. Rainfall deficits in excess of 8 inches were widespread for the last 8 months, and in excess of 12 inches were common for the last 11 months. The tropical rains helped contract the areas of drought and dryness, with 4 percent of the island in moderate drought and 22 percent abnormally dry on the September 2nd USDM map, compared to 18 and 59 percent, respectively, a month ago.
 |

|
The August precipitation anomaly pattern of dryness in the Southeast and Southern Plains was reflected in the state ranks, but the dryness in the Far West was not reflected in the state ranks due to localized heavy precipitation which masked the dry areas. Six states had August precipitation ranks in the dry third of the historical record, three of which were in the Southeast.
The summer was dry for most of California and much of Oregon, Texas, and the Southeast. But localized heavy rains masked the dry signal at the state level for the western and Southern Plains states. Four states in the Southeast and one in New England had precipitation ranks for June-August 2014 in the driest third of the historical record. These included Georgia which had their tenth driest June-August in the 1895-2014 record.
 |

|
For the longer time scales, as well, a mixed precipitation anomaly pattern masked the dryness at the state level for most states. Severe dryness occurred across parts of California, New Mexico, and Texas for March-August 2014, but the state ranks did not reflect this due to local areas of above-normal precipitation, with only two states ranking in the driest third of the historical record. Likewise for the year-to-date. Eight states ranked in the driest third of the historical record for January-August 2014, including states in the very dry Southwest to Southern Plains, but none ranked tenth driest or drier.
For the last twelve months (September 2013-August 2014), dryness dominated much of the West and the Southern Plains to Midwest, with pockets of wetness in most of the dry areas. California was especially hard hit, having the second hottest and third driest September-August on record. Only 1923-24 (driest) and 1976-77 (second driest) had a drier September-August in California. Seven other states ranked in the driest third of the historical record for the 12-month period.
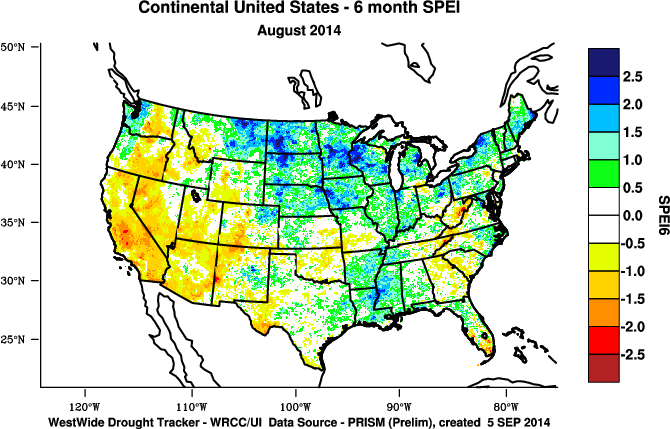
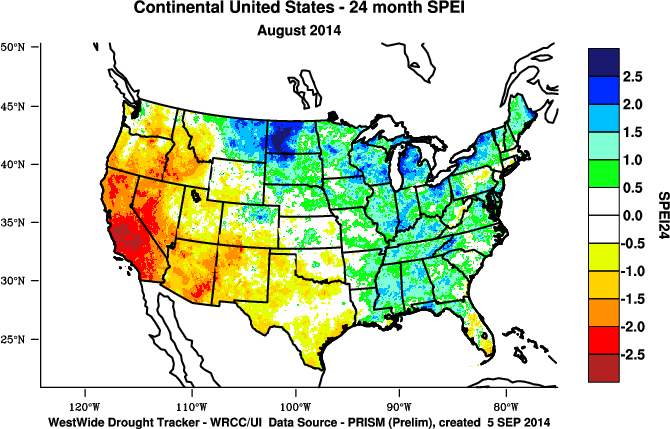
Standardized Precipitation Evapotranspiration Index:
The SPI measures water supply (precipitation), while the SPEI (Standardized Precipitation Evapotranspiration Index) measures the combination of water supply (precipitation) and water demand (evapotranspiration as computed from temperature). Warmer temperatures tend to increase evapotranspiration, which generally makes droughts more intense.
 |
 |
The parade of short-wave ridges and troughs, that moved across the CONUS during August, resulted in a mixed temperature anomaly pattern which reduced evapotranspiration across most areas except the extreme West. Consequently, the 1-month SPEI was more severe than the 1-month SPI only along the West Coast. But a circulation pattern with an intense long-wave ridge in the upper atmosphere, entrenched over the West, has persisted for much of the last one to two years. Unusually warm temperatures have been associated with the ridge, which has intensified evapotranspiration and resulted in more severe drought in the West as measured by the SPEI (last 3, 6, 12, 24, 36 months) when compared to the SPI (last 3, 6, 12, 24, 36 months). Conversely, the unusually colder-than-normal temperatures underneath an upper-level long-wave trough east of the Rockies reduced the severity of drought in the Midwest as seen by less severe SPEI values when compared to SPI values.
 Percent area of the Western U.S. in moderate to extreme drought, January 1900 to present, based on the Palmer Drought Index. As noted above, dry weather has dominated the West for much of the last several months, resulting in significant hydrological (low lake, reservoir, and stream levels) and agricultural impacts. According to the USDM, 57.7 percent of the West was experiencing moderate to exceptional drought at the end of August, which is about three percent less than the previous month. The Palmer Drought Index percent area statistic for the West was 47.8 percent, a decrease of about 17 percentage points from the previous month. |

|

|

|
 |
The growing season for the Primary Corn and Soybean agricultural belt has alternated between wetter-than-normal and drier-than-normal months. August 2014 was wetter than normal, ranking as the 13th wettest and 55th warmest August. The growing season to date (March-August 2014) ranked as the 19th wettest and 28th coolest March-August. Summer 2014 ranked as the sixth wettest and 27th coolest July-August.
NOAA Regional Climate Centers:
A more detailed drought discussion, provided by the NOAA Regional Climate Centers and others, can be found below.
West — Pacific Islands
As described by the High Plains Regional Climate Center, August 2014 was a cool and wet month for most of the High Plains region. Following a very dry July, the High Plains region was quite wet with large areas of the region and surrounding areas receiving over 200 percent of normal precipitation. The only widespread dry areas were located in central Kansas and central Colorado.
This summer, the High Plains region went from one precipitation extreme to the other. June was wet across the eastern side of the region with areas of the Dakotas, Nebraska, and Kansas receiving over 200 percent of normal precipitation. Localized areas experienced record-breaking precipitation which led to flooding issues. July on the other hand was quite dry. This contrast was illustrated well with the state-wide precipitation rankings. Take South Dakota for instance, which went from 4th wettest June to 6th driest July. Luckily, July was also fairly cool and this unusual combination of cool, dry conditions helped stave off impacts from the dryness. After a reprieve, wet conditions returned in August and many locations ranked in the top 10 wettest Augusts on record. Heavy rains led to improvements in drought status this month across the High Plains region. Although the total area of the region still in drought (D1-D4) remained about the same, there were some single category improvements in Kansas, Colorado, Nebraska, and South Dakota. The last remaining area of exceptional drought (D4) in eastern Colorado was downgraded to extreme drought (D3) and severe and extreme drought (D2 and D3, respectively) conditions improved in Kansas as well. The most significant decrease occurred in an approximate 10 percent reduction of D2 across Kansas. Additionally, a couple of areas of moderate drought (D1) improved in southeastern South Dakota and northeastern Nebraska. The only area to experience degradation was in extreme southeastern Nebraska and eastern Kansas where D1 emerged.
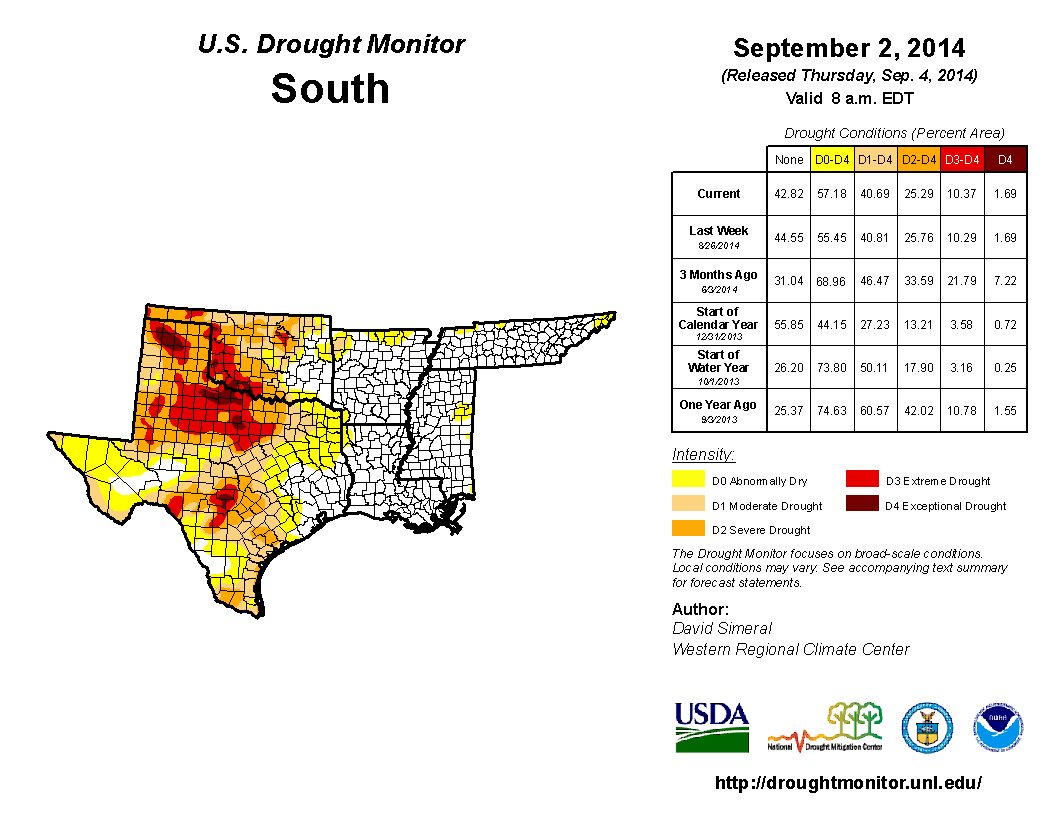
As explained by the Southern Regional Climate Center, August average temperatures varied spatially across the Southern region, but the August precipitation tells a tale of extreme values, with very few stations reporting near normal precipitation totals for the month. Much of Louisiana experienced a very wet month, with precipitation totals ranging from 150 to 200 percent of normal. Similar values were recorded throughout much of Tennessee and southern Arkansas. Small portions of Texas also observed high precipitation totals for the month. This includes the southern tip and west central counties of the state. In Oklahoma and northern Arkansas, however, conditions were quite dry, with most stations reporting less than a quarter of the monthly normal. This was also the case for many counties in the south eastern and north western counties of Texas. Oklahoma experienced its seventeenth driest August on record (1895-2014).
Drought conditions in the Southern region did not vary much over the past month. In northern Texas, dry conditions have led to a slight expansion of extreme drought, and there was also a slight expansion of severe and moderate drought in the central counties. Statewide, reservoirs continued to decline in Texas, dropping by nearly three percent. Several rural and industrial water supplies started new or updated existing water use restrictions, including Luling in Caldwell County, the Guadalupe-Blanco River Authority in Calhoun County, the Coolcrest and Fair Oaks Ranch Utilities in Bexar County, and Highland Park in Dallas County. Many suburbs of the Metroplex, including Lewisville, Allen, and Plano, have adjusted their restrictions to allow for outdoor watering on rotation through October. Groundwater out west is still a concern as well: the Edwards Aquifer J-17 test well dropped to 626 feet (191.11 m) above sea level during August, and springflows declined by over 10 percent. A new report out of Texas Tech estimates that the Ogallala Aquifer only has 15 years of usage at its current rate in west Texas, based on a decline of 100 feet (30.48 m) in the past 40 years, compared to roughly 40 feet (12.19 m) averaged across the whole aquifer; current estimates show that 30% of the High Plains economy — roughly $3 billion — could be impacted by the dropping aquifer levels. Crop progress through August was promising. Cotton, corn, sorghum, and rice all beat both last year's and their 5-year average marks for crop development, though they are behind in both in terms of harvesting. Soybeans, meanwhile, are behind their marks both compared to last year and the 5-year average. Cotton and peanuts have the highest percentage of poor to very poor report conditions, but most crops are fair to excellent overall. Continued dryness through central and south-central Texas has lead these areas to see few reports of adequate soil moisture, both at topsoil and subsoil levels. The High Plains have improved since the beginning of the summer, but still struggle with subsoil moisture shortages. Outside of the statistics, there are concerns over the future of the Texas rice belt, with new well drilling expected to drain groundwater at an unsustainable rate and ushering the end of rice crops in the Lower Colorado River Valley (Information provided by the Texas Office of State Climatology).
As summarized by the Midwest Regional Climate Center, August temperatures averaged within 1 to 2 degrees F (1 C) of normal across the Midwest and August precipitation was above average for much of the region. Statewide precipitation totals ranged from near normal in Michigan to more than two inches (51 mm) above normal in Kentucky. There were areas within several states with well below normal totals however. Northern Minnesota, southern Missouri, and portions of Michigan, Iowa, and Ohio received between 25% and 75% of normal precipitation during the month. Totals ranged from just over an inch (25 mm) to more than 10 inches (254 mm) so the local impacts varied considerably based on where the rain fell.
August rainfall helped to alleviate the few remaining areas of drought in the Midwest. With just 2.5 percent of the region in drought at the start of August, drought was not a major Midwest issue. The rains in August further reduced the impact on the region bringing the areal coverage to less than one percent by the end of the month. An additional seven percent of the region was classified as abnormally dry leaving 92 percent of the region unclassified by the USDM. The cool summer temperatures have meant there was little heat stress on row crops during the hottest season of the year. Spotty rainfall meant that some areas were still impacted by dry conditions, but with adequate rainfall for most in the region, many areas reported much of their corn and soybeans in good or excellent condition, with some areas even anticipating record yields when harvest comes around.
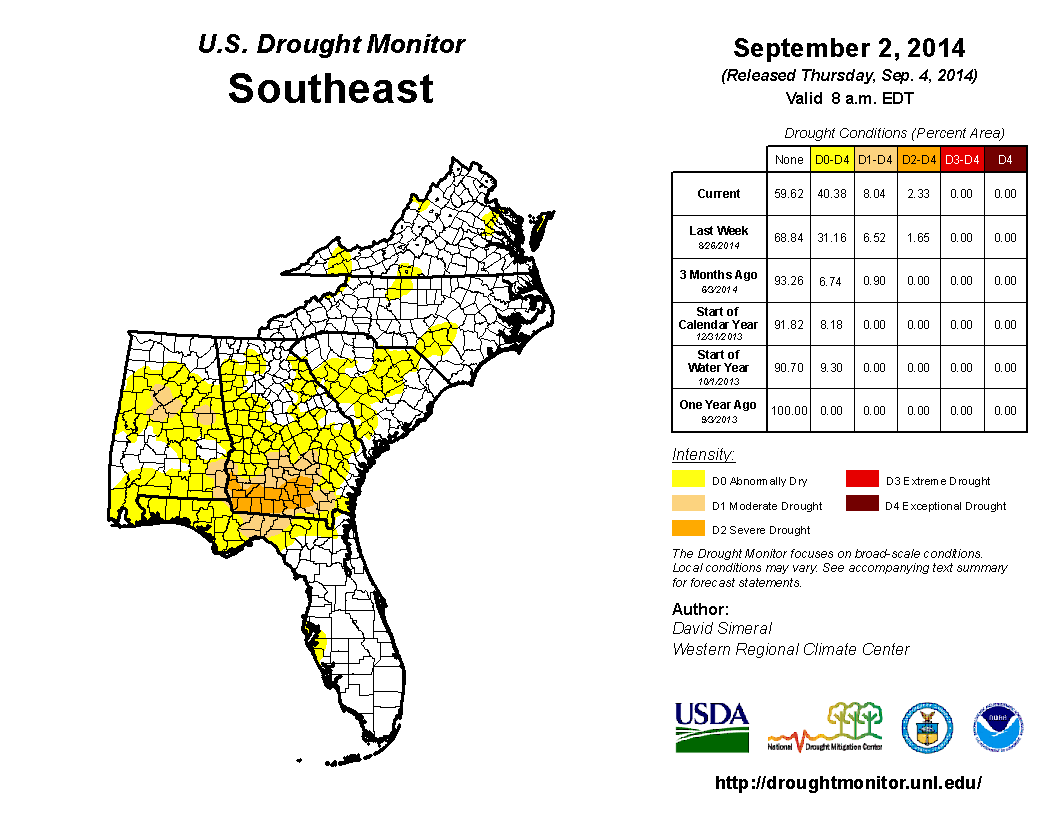
As noted by the Southeast Regional Climate Center, mean temperatures in August were variable across the Southeast region, and precipitation was highly variable. The driest locations were found across much of the southern portion of the region, including central and northern Florida, central and southern Alabama, central Georgia, and central South Carolina. The Florida Panhandle was especially dry, with Pensacola (1879-2014) and Tallahassee recording only 1.37 and 2.26 inches (34.8 and 57.4 mm) of precipitation, about 20 and 30 percent of normal during August, respectively. Macon, GA (1892-2014) observed its second driest August on record with only 1.05 inches (26.7 mm) of precipitation, which is approximately 25 percent of normal. Monthly precipitation totals were well above normal across Puerto Rico and the U.S. Virgin Islands. San Juan (1898-2014) recorded 9.79 inches (249 mm) of precipitation during August, which is about 180 percent of normal. Much of this precipitation occurred during the passage of tropical cyclones Bertha and Cristobal.
Most of the Southeast region remained drought-free (less than D1) during the month of August, but conditions continued to worsen across portions of southern Georgia and the Florida Panhandle. Areas of severe drought (D2) were introduced across extreme southwestern and south-central parts of Georgia during the latter half of the month, covering approximately 11 percent of the state. In addition, areas of moderate drought (D1) expanded across parts of the Southeast, particularly southern Georgia, the Florida Panhandle, and central Alabama. By the end of the month, moderate drought conditions covered about 6 percent of the Southeast region, an increase from less than 1 percent at the beginning of August. However, relatively low humidity during August aided in the reduction of foliar (leaf-related) diseases on some crops in Georgia.
As explained by the Northeast Regional Climate Center, the region was cooler and slightly drier than normal during August. The Northeast received 3.81 inches (96.77 mm) of rain, 97 percent of normal. Eight states were drier than normal, with departures ranging from 68 percent of normal in Rhode Island to 99 percent of normal in New Jersey. Five percent of the Northeast (parts of New England, Long Island, and West Virginia) was experiencing abnormally dry conditions at the start of August, according to the USDM. While conditions improved in some areas, abnormal dryness was introduced in other areas. By month's end, six percent of the region (parts of southern New England, southeastern New York, and West Virginia) was abnormally dry.
As summarized by the Western Regional Climate Center, an active monsoon circulation as well as the passage of several low-pressure systems produced above normal precipitation over much of the West this month. Temperatures were cooler than normal in a wide swath extending from southeastern California northeast to the Great Plains states while the Pacific Northwest and much of California experienced warmer than normal temperatures. High pressure dominated over the Pacific Northwest producing average temperatures 2-6 F (1-3 C) above normal. August's warm temperatures helped several locations in northern California and southwest Oregon achieve one of their top-10 hottest summers (June-August) on record. This month's precipitation improved drought conditions in southeastern California and western Arizona as well as parts of the central and northern Great Basin; however, large areas of extreme to exceptional drought remain in California, Nevada, and Oregon. As is typical for August, coastal locations saw little to no rainfall. Portions of New Mexico and Colorado saw drier than normal conditions as well.
In Hawaii, the windward side of the Big Island saw heavy precipitation in the beginning of the month associated with Tropical Storm Iselle. Hawaii Volcanoes National Park, at 3970 ft (1210 m) on the southeast side of the island, recorded 12.29 in (312 mm) of rainfall on August 8 alone. This was the 5th wettest day since the station began recording data in 1949. To the north, southeastern Alaska saw showery weather. Yakutat logged 23.17 in (589 mm) precipitation this month, 165% of normal and the 8th wettest August in a 98-year record. Temperatures were slightly above normal in Interior Alaska and considerably above normal in the far western portion of the state. Kotzebue saw an average temperature of 58.4 F (14.7 C) this month, 6.6 F (3.7 C) above normal and the 3rd warmest August on record. Records for Kotzebue began in 1897.
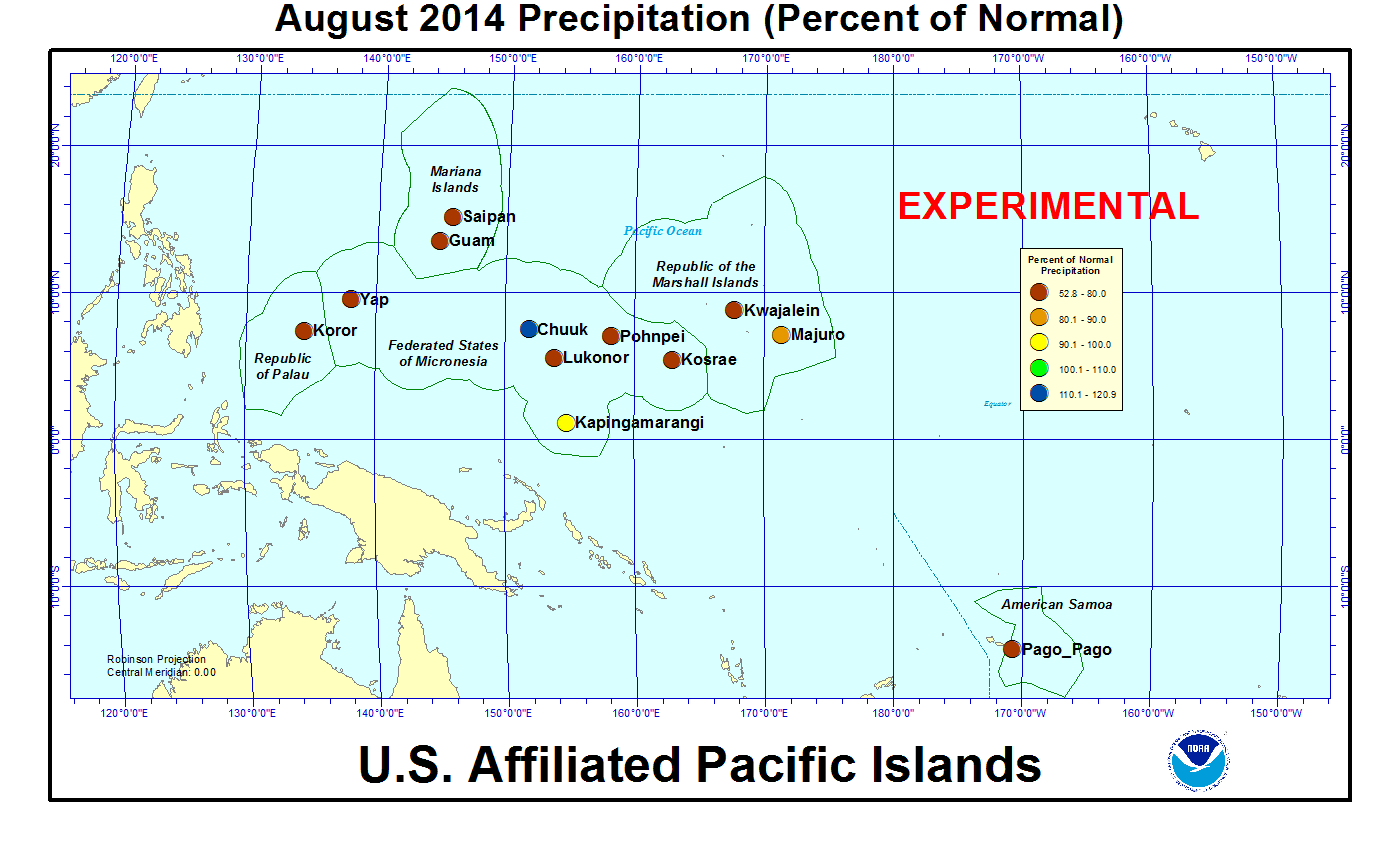
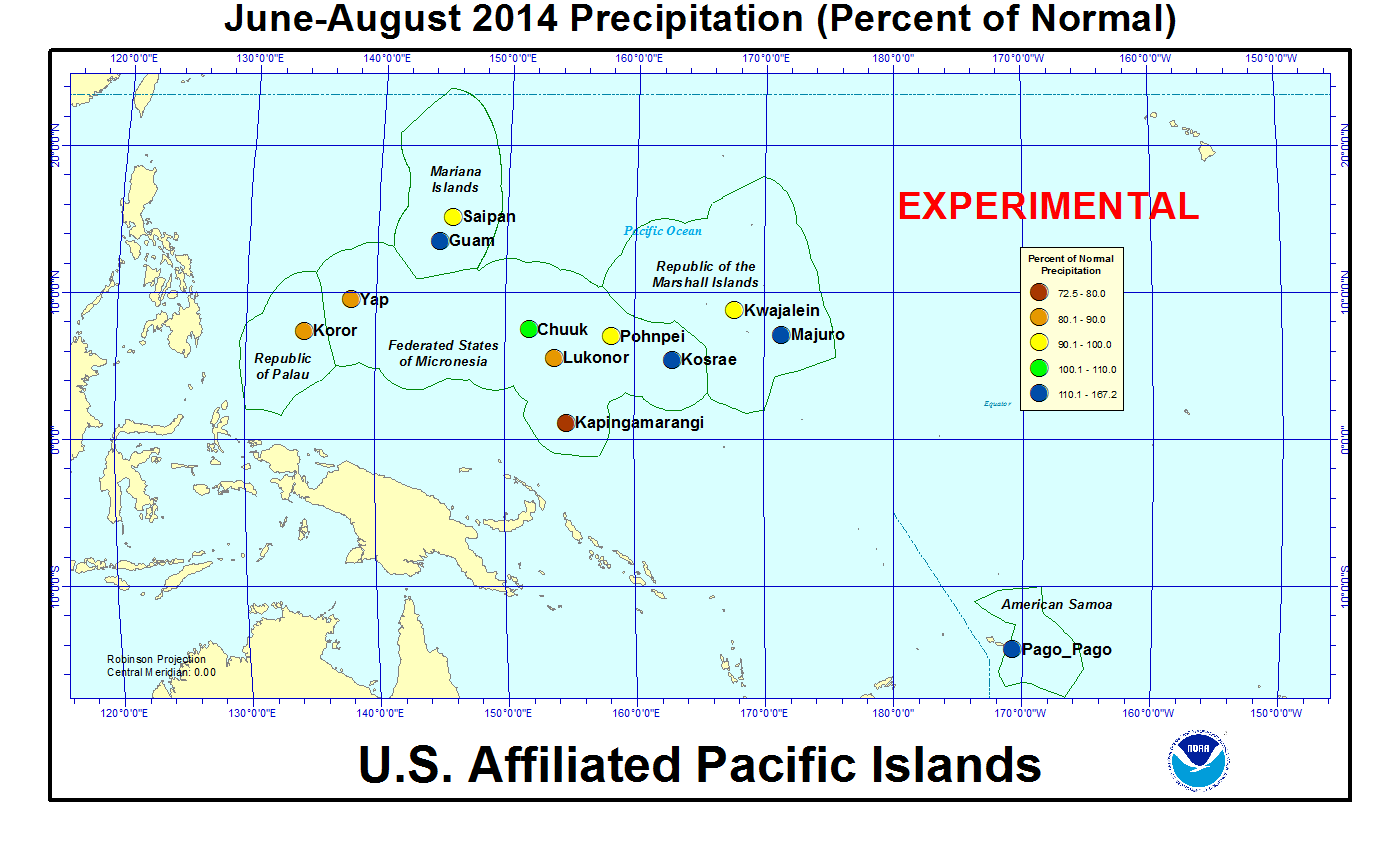
Pacific Islands: According to reports from National Weather Service offices, the Pacific ENSO Applications Climate Center (PEAC), and partners, conditions varied across the Pacific Islands.
Across the U.S. Affiliated Pacific Islands (maps — Micronesia, Marshall Islands, basinwide), August 2014 was drier than normal at most of the reporting stations with only Chuuk wetter than normal. This is the wet season at most of these stations so normals are high. Even though August was drier than normal, the rainfall amounts at most stations were above the minimum thresholds (4 or 8 inches) required to meet most monthly water needs. The 4- and 8-inch thresholds are important because, if monthly precipitation falls below the threshold, then drought becomes a concern. Kwajalein, with 5.61 inches of rainfall, and Pago Pago, with 3.22 inches, were below their 8-inch thresholds.
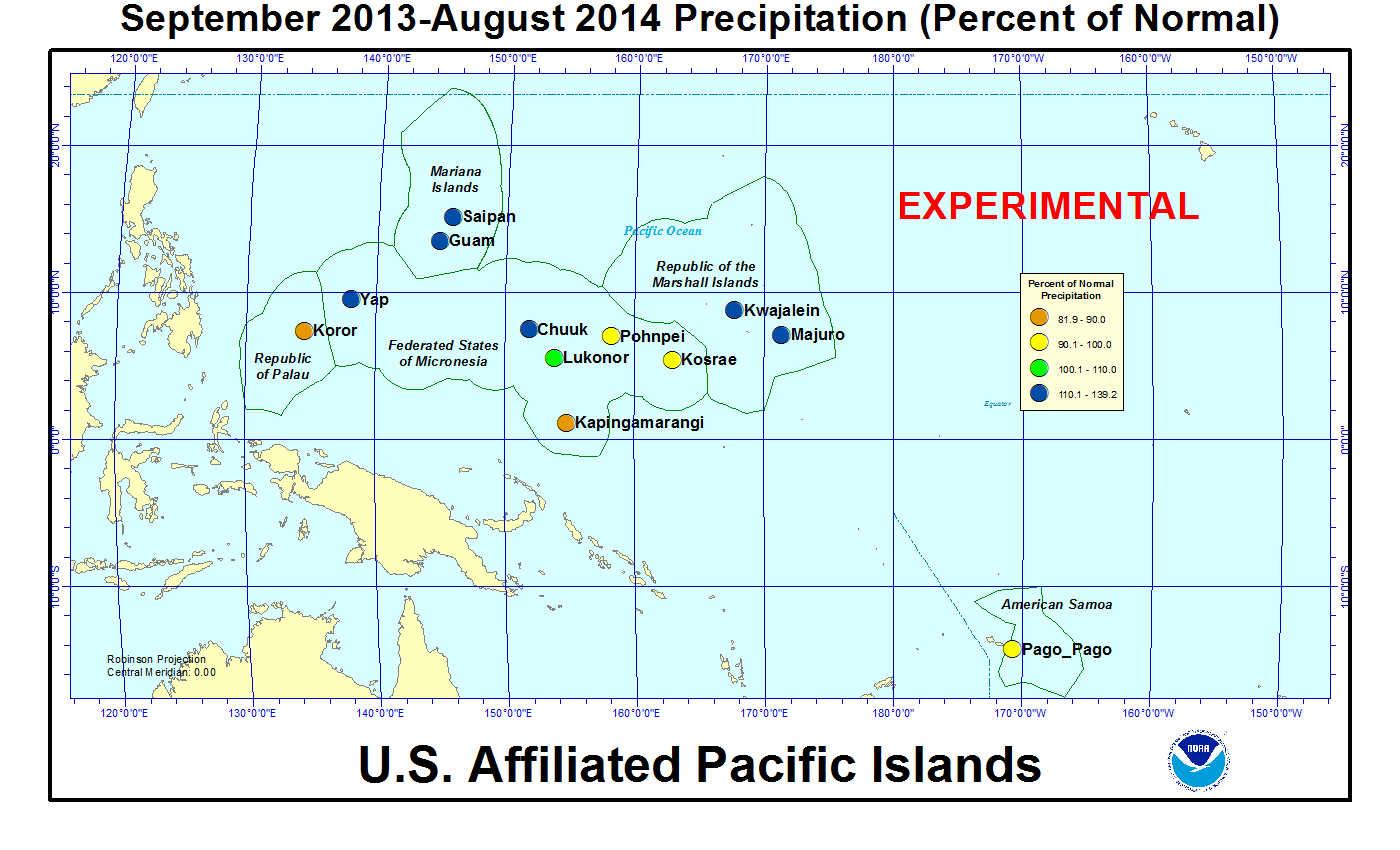
As measured by percent of normal precipitation, Saipan, Yap, and Lukonor have been drier than normal for recent months (August and June-August) but wetter than normal at the longer time periods (year to date [YTD] [January-August] and last 12 months [September 2013-August 2014]). Kosrae and Pago Pago have been drier than normal for August and the last 12 months as a whole, but wetter than normal for the intervening time scales. Kapingamarangi, Koror, and Pohnpei have been drier than normal at all four of these time scales.
| Station Name | Sep 2013 | Oct 2013 | Nov 2013 | Dec 2013 | Jan 2014 | Feb 2014 | Mar 2014 | Apr 2014 | May 2014 | Jun 2014 | Jul 2014 | Aug 2014 | Sep- Aug |
|---|---|---|---|---|---|---|---|---|---|---|---|---|---|
| Chuuk | 141% | 103% | 111% | 75% | 59% | 492% | 89% | 111% | 116% | 76% | 125% | 121% | 120% |
| Guam NAS | 255% | 198% | 56% | 65% | 421% | 170% | 141% | 108% | 99% | 98% | 290% | 62% | 139% |
| Kapingamarangi | 55% | 85% | 38% | 254% | 168% | 112% | 81% | 43% | 83% | 56% | 86% | 96% | 82% |
| Koror | 64% | 86% | 115% | 64% | 170% | 91% | 68% | 224% | 63% | 57% | 121% | 77% | 88% |
| Kosrae | 104% | 201% | 112% | 87% | 86% | 104% | 82% | 150% | 93% | 117% | 175% | 59% | 94% |
| Kwajalein | 82% | 37% | 121% | 39% | 121% | 523% | 475% | 366% | 80% | 104% | 120% | 58% | 119% |
| Lukonor | 117% | 118% | 125% | 90% | 257% | 206% | 138% | 72% | 116% | 110% | 78% | 77% | 104% |
| Majuro | 87% | 71% | 96% | 51% | 125% | 177% | 91% | 246% | 75% | 90% | 201% | 82% | 110% |
| Pago Pago | 125% | 62% | 58% | 99% | 146% | 97% | 65% | 152% | 81% | 154% | 333% | 60% | 98% |
| Pohnpei | 121% | 81% | 142% | 36% | 78% | 225% | 112% | 87% | 87% | 121% | 108% | 74% | 98% |
| Saipan | 167% | 109% | 52% | 71% | 546% | 55% | 167% | 168% | 205% | 92% | 113% | 71% | 120% |
| Yap | 181% | 144% | 74% | 65% | 340% | 91% | 153% | 226% | 39% | 83% | 110% | 65% | 116% |
| Station Name | Sep 2013 | Oct 2013 | Nov 2013 | Dec 2013 | Jan 2014 | Feb 2014 | Mar 2014 | Apr 2014 | May 2014 | Jun 2014 | Jul 2014 | Aug 2014 | Sep- Aug |
|---|---|---|---|---|---|---|---|---|---|---|---|---|---|
| Chuuk | 16.49" | 11.82" | 11.82" | 8.44" | 5.98" | 35.70" | 7.43" | 13.80" | 13.06" | 8.91" | 14.92" | 15.55" | 163.92" |
| Guam NAS | 32.25" | 22.66" | 4.13" | 3.33" | 16.89" | 5.14" | 2.91" | 2.74" | 3.36" | 6.08" | 29.39" | 9.08" | 137.96" |
| Kapingamarangi | 5.42" | 6.99" | 3.49" | 25.02" | 15.38" | 10.36" | 9.26" | 5.83" | 9.97" | 7.77" | 12.16" | 7.84" | 119.49" |
| Koror | 7.53" | 10.19" | 13.11" | 7.19" | 17.27" | 7.79" | 5.08" | 16.38" | 7.45" | 9.91" | 22.45" | 10.40" | 134.75" |
| Kosrae | 14.82" | 22.03" | 15.54" | 13.94" | 14.39" | 13.47" | 13.12" | 26.29" | 16.59" | 17.08" | 26.06" | 8.32" | 201.65" |
| Kwajalein | 8.81" | 4.17" | 13.63" | 2.62" | 3.81" | 13.82" | 11.17" | 19.24" | 5.36" | 7.22" | 11.88" | 5.61" | 107.34" |
| Lukonor | 11.92" | 13.34" | 11.38" | 10.11" | 21.65" | 18.42" | 12.76" | 8.18" | 13.58" | 12.85" | 12.50" | 10.80" | 157.49" |
| Majuro | 9.70" | 9.01" | 12.84" | 5.76" | 9.66" | 12.19" | 5.96" | 23.20" | 7.58" | 9.86" | 22.49" | 9.64" | 137.89" |
| Pago Pago | 8.14" | 5.71" | 5.91" | 12.71" | 19.54" | 11.65" | 6.95" | 14.29" | 7.84" | 8.22" | 18.48" | 3.22" | 122.66" |
| Pohnpei | 15.23" | 12.37" | 20.99" | 5.79" | 10.27" | 21.50" | 14.70" | 15.96" | 17.33" | 17.95" | 16.74" | 10.52" | 179.35" |
| Saipan | 16.87" | 11.60" | 2.91" | 2.74" | 13.81" | 1.43" | 3.16" | 4.41" | 4.87" | 3.32" | 10.04" | 9.33" | 84.49" |
| Yap | 24.39" | 17.60" | 6.56" | 5.56" | 21.74" | 4.72" | 6.99" | 12.72" | 3.07" | 9.95" | 16.62" | 9.58" | 139.5" |
| Station Name | Sep 2013 | Oct 2013 | Nov 2013 | Dec 2013 | Jan 2014 | Feb 2014 | Mar 2014 | Apr 2014 | May 2014 | Jun 2014 | Jul 2014 | Aug 2014 | Sep- Aug |
|---|---|---|---|---|---|---|---|---|---|---|---|---|---|
| Chuuk | 11.71" | 11.51" | 10.61" | 11.25" | 10.10" | 7.25" | 8.32" | 12.47" | 11.30" | 11.66" | 11.98" | 12.86" | 136.77" |
| Guam NAS | 12.66" | 11.44" | 7.38" | 5.11" | 4.01" | 3.03" | 2.07" | 2.53" | 3.40" | 6.18" | 10.14" | 14.74" | 99.09" |
| Kapingamarangi | 9.93" | 8.19" | 9.27" | 9.84" | 9.15" | 9.27" | 11.43" | 13.64" | 12.08" | 13.78" | 14.15" | 8.13" | 145.85" |
| Koror | 11.77" | 11.84" | 11.39" | 11.16" | 10.18" | 8.56" | 7.44" | 7.32" | 11.83" | 17.48" | 18.53" | 13.50" | 152.90" |
| Kosrae | 14.22" | 10.94" | 13.83" | 16.11" | 16.67" | 12.93" | 16.06" | 17.51" | 17.75" | 14.64" | 14.91" | 14.22" | 213.87" |
| Kwajalein | 10.74" | 11.18" | 11.28" | 6.66" | 3.16" | 2.64" | 2.35" | 5.26" | 6.72" | 6.93" | 9.87" | 9.74" | 90.41" |
| Lukonor | 10.15" | 11.32" | 9.08" | 11.27" | 8.41" | 8.93" | 9.26" | 11.31" | 11.69" | 11.65" | 15.93" | 14.04" | 151.36" |
| Majuro | 11.17" | 12.73" | 13.44" | 11.39" | 7.74" | 6.88" | 6.58" | 9.42" | 10.11" | 11.01" | 11.17" | 11.69" | 125.25" |
| Pago Pago | 6.53" | 9.26" | 10.14" | 12.84" | 13.34" | 12.00" | 10.68" | 9.39" | 9.66" | 5.33" | 5.55" | 5.38" | 125.57" |
| Pohnpei | 12.55" | 15.27" | 14.83" | 16.08" | 13.18" | 9.55" | 13.17" | 18.41" | 19.96" | 14.81" | 15.43" | 14.26" | 182.36" |
| Saipan | 10.09" | 10.62" | 5.61" | 3.85" | 2.53" | 2.59" | 1.89" | 2.63" | 2.38" | 3.62" | 8.91" | 13.13" | 70.25" |
| Yap | 13.50" | 12.18" | 8.83" | 8.51" | 6.39" | 5.19" | 4.56" | 5.63" | 7.85" | 12.04" | 15.08" | 14.82" | 120.31" |

[top]
State/Regional/National Moisture Status
A detailed review of drought and moisture conditions is available for all contiguous U.S. states, the nine standard regions, and the nation (contiguous U.S.):
| northeast u. s. | east north central u. s. | central u. s. |
| southeast u. s. | west north central u. s. | south u. s. |
| southwest u. s. | northwest u. s. | west u. s. |
| Contiguous United States |
[top]
Contacts & Questions