|
Contents Of This Report: |

|
Please note that the values presented in this report are based on preliminary data. They will change when the final data are processed, but will not be replaced on these pages.
National Drought Overview
|
|
[top]
Detailed Drought Discussion
Overview
During July 2013, the Bermuda High attempted to dominate the weather over the U.S., but an upper-level trough persisted over the north central states. In combination with an unusually  active jet stream, the trough sent cold fronts and weather systems propagating across central and eastern parts of the country. The result was a pattern of above-normal temperatures in the West and Northeast, below-normal temperatures from the Plains to the Southeast, and scattered areas of very heavy rain along with large areas of below-normal precipitation.
Drought expanded in Alaska, in Hawaii, in the Northwest beneath a hot and dry upper-level ridge, and into the Midwest and Lower Mississippi Valley which were missed by wet weather systems during the last couple of months. But heavy rainfall from mesoscale convective systems which developed along the cold fronts, and from a retrograding upper-level low, improved drought conditions over parts of the Central and Southern Plains, and above-normal monsoon rainfall benefited drought areas in the Southwest. Heavy rain also fell in the drought-free areas of the East.
When the temperature and precipitation are averaged across the CONUS for the entire month, July 2013 ranked as the 30th warmest and fifth wettest July in the 119-year record.
In spite of the very wet national rank, the lack of rain in the Northwest, Midwest, Lower Mississippi Valley, and Alaska expanded the national (all of the U.S.) drought footprint from 39.3 percent in moderate to exceptional drought last month to 41.5 percent at the end of July (per U.S. Drought Monitor statistics). The drought footprint similarly expanded for the CONUS from 44.1 percent last month to 45.6 percent this month.
According to the Palmer Drought Index, which goes back to the beginning of the 20th century, 32.7 percent of the CONUS was in moderate to extreme drought at the end of July, a decrease of about 7 percent compared to last month.
active jet stream, the trough sent cold fronts and weather systems propagating across central and eastern parts of the country. The result was a pattern of above-normal temperatures in the West and Northeast, below-normal temperatures from the Plains to the Southeast, and scattered areas of very heavy rain along with large areas of below-normal precipitation.
Drought expanded in Alaska, in Hawaii, in the Northwest beneath a hot and dry upper-level ridge, and into the Midwest and Lower Mississippi Valley which were missed by wet weather systems during the last couple of months. But heavy rainfall from mesoscale convective systems which developed along the cold fronts, and from a retrograding upper-level low, improved drought conditions over parts of the Central and Southern Plains, and above-normal monsoon rainfall benefited drought areas in the Southwest. Heavy rain also fell in the drought-free areas of the East.
When the temperature and precipitation are averaged across the CONUS for the entire month, July 2013 ranked as the 30th warmest and fifth wettest July in the 119-year record.
In spite of the very wet national rank, the lack of rain in the Northwest, Midwest, Lower Mississippi Valley, and Alaska expanded the national (all of the U.S.) drought footprint from 39.3 percent in moderate to exceptional drought last month to 41.5 percent at the end of July (per U.S. Drought Monitor statistics). The drought footprint similarly expanded for the CONUS from 44.1 percent last month to 45.6 percent this month.
According to the Palmer Drought Index, which goes back to the beginning of the 20th century, 32.7 percent of the CONUS was in moderate to extreme drought at the end of July, a decrease of about 7 percent compared to last month.

The U.S. Drought Monitor drought map valid July 30, 2013.
By the end of the month, the core drought areas in the U.S. included:
- a large area of moderate (D1) to severe (D2) drought, including spots of extreme (D3) to exceptional (D4) drought, stretching from the West, across the Central and Southern Plains, and into the Midwest and Lower Mississippi Valley, with a large area of intense extreme to exceptional drought lingering from the Southwest to the Southern and Central Plains states;
- Hawaii, where moderate to extreme drought largely persisted; and
- Alaska, where moderate drought expanded and severe drought was introduced.
Palmer Drought Index
The Palmer drought indices measure the balance between moisture demand (evapotranspiration driven by temperature) and moisture supply (precipitation). The Palmer Z Index depicts moisture conditions for the current month, while the Palmer Hydrological Drought Index (PHDI) and Palmer Drought Severity Index (PDSI) depict the current month's cumulative moisture conditions integrated over the last several months.
|
 |
Used together, the Palmer Z Index and PHDI maps show that July short-term dry conditions occurred over long-term dry conditions that existed at the end of June across parts of the Pacific Northwest, Great Basin, Northern to Central Rockies, and Central Plains, exacerbating the drought, and short-term wet conditions occurred over parts of the Central to Southern Plains and Southwest, improving long-term drought. Short-term dry conditions occurred over long-term wet conditions in parts of the Midwest. Short-term wet conditions occurred over long-term wet conditions in the Southeast and parts of the Northeast, reinforcing the wet spell there.
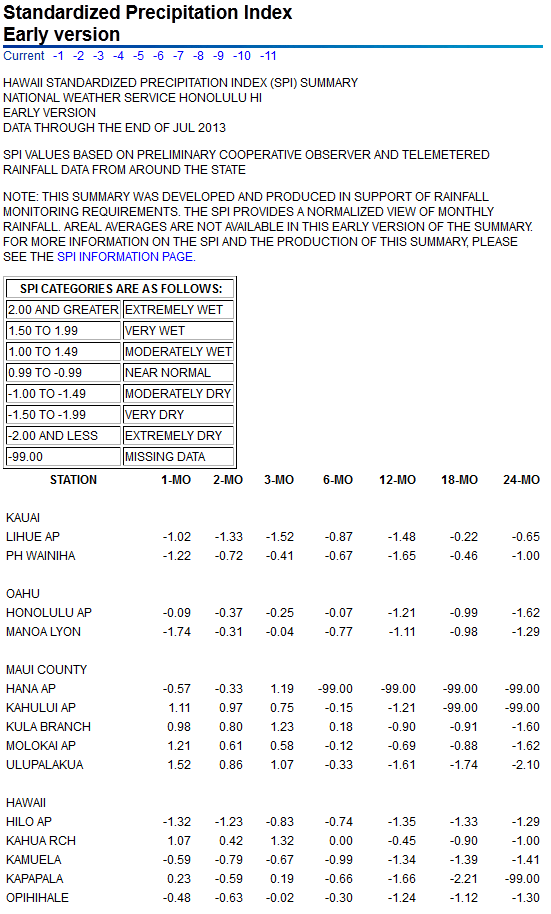
Standardized Precipitation Index
The Standardized Precipitation Index (SPI) measures moisture supply. The SPI maps here show the spatial extent of anomalously wet and dry areas at time scales ranging from 1 month to 24 months.
 |
 |
 |
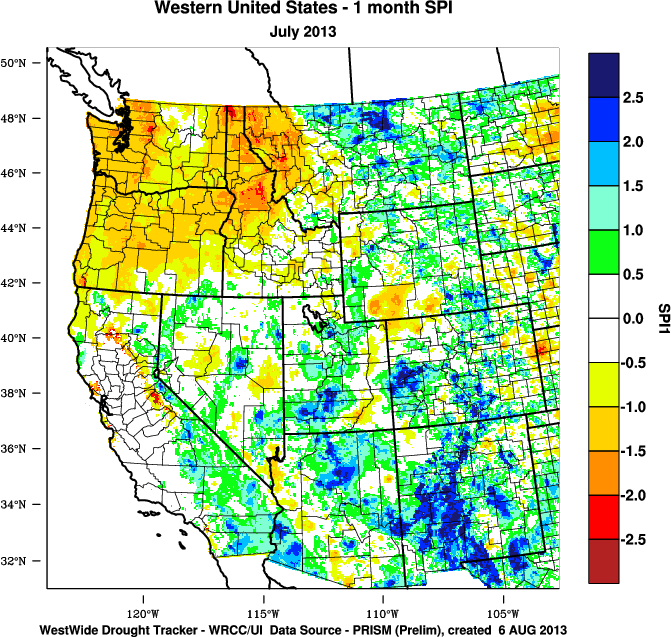
Shifting patterns of wetness and dryness during July 2013 resulted in SPI maps which show changing patterns of spatial precipitation anomalies over time. The 1-month SPI map shows dryness in the Pacific Northwest, parts of the Central and Northern Plains into the Midwest, and parts of the Lower Mississippi Valley, with widespread wetness from the Southwest to Southern Plains, and across most of the East. The dryness in parts of the Midwest and Lower Mississippi Valley extends out to 2 months. The wet July anomalies in Kansas and Oklahoma are large enough for these areas to show up as wet from the 2- to 9-month time scales, and the July wetness has neutralized the previous long-term dryness in local areas here out to even 24 months. The summer monsoon wetness in the Southwest is evident in some parts out to 3 months, with neutral conditions for a few climate divisions even out to 24 months. The 1-month wet conditions in California are supplanted by long-term very dry conditions by the 6-month time scale. Much of the West, as well as the Southern Plains, shows up dry by 6 to 9-months, and especially 12 to 24 months. Dryness in parts of the Central Plains is evident at all time scales. Much of the East is wet at most time scales.
 |
 |
 |
Agricultural, Hydrological, and Meteorological Indices and Impacts
 |
 |
Drought conditions were reflected in numerous agricultural, hydrological, and other meteorological indicators, both observed and modeled.
Agricultural:
According to the U.S. Department of Agriculture (USDA), as of July 30, 47 percent of cattle, 34 percent of hay, 19 percent of corn, and 11 percent of soybeans were in drought. These percentages are more than the corresponding percentages from a month ago. July 28 statistics reveal 28 percent of the nation's pasture and rangeland rated in poor to very poor condition, a slight increase compared to last month, with statewide values as high as 85 percent in California, 82 percent in New Mexico, 79 percent in Arizona, 61 percent in Nevada, 59 percent in Colorado, and 53 percent in Kansas. The statewide percentages were above average for this time of year for those states as well as Nebraska, Wyoming, Idaho, and Oregon. In spite of recent rains, topsoil continued short or very short of moisture for more than 50 percent of reporting districts in several Great Plains and Midwest states as well as most of the western states. More than 70 percent of the topsoil moisture was short or very short in New Mexico, Colorado, and Oregon.

Map showing NOAA/NCEP NLDAS modeled monthly soil moisture anomalies.
- USDA (U.S. Department of Agriculture) observed soil moisture conditions, comparison to 5-year average and 10-year average, percentiles, and departure from median;
- the Palmer Crop Moisture Index (CMI), which reflected worsening drought in the Northwest and Northern Rockies, but improvement in the Southwest, Southern Rockies, and Southern Plains, as the month progressed (weeks 1, 2, 3, 4);
- NOAA Climate Prediction Center (CPC) modeled soil moisture anomalies and percentiles for the end of the month, and soil moisture anomaly change compared to previous month;
- NLDAS (North American Land Data Assimilation System) modeled soil moisture percentiles for the top soil layer and total soil layer;
- VIC (University of Washington Variable Infiltration Capacity macroscale hydrologic model) modeled soil moisture percentiles, and soil moisture percentile change compared to previous month;
- USDA percent of pasture and rangeland in poor to very poor condition and comparison to average (anomalies, percentiles);
- Vegetation Drought Response Index (VegDRI);
- the NOAA/NESDIS satellite-based Vegetation Health Index (VHI);
- the USGS agro-hydrologic model (Soil Water Index, Water Requirement Satisfaction Index);
Hydrological:

Map showing NOAA NLDAS model streamflow percentiles.
- USGS (U.S. Geological Survey) observed streamflow percentiles (just those basins below average);
- VIC 1-, 2-, 3-, and 6-month runoff percentiles;
- NLDAS model runoff anomalies and percentiles;
- NLDAS modeled streamflow anomalies and percentiles;
- USGS groundwater observations (real-time network, climate response network, total active network, just the below-normal observations) and spring water observations;
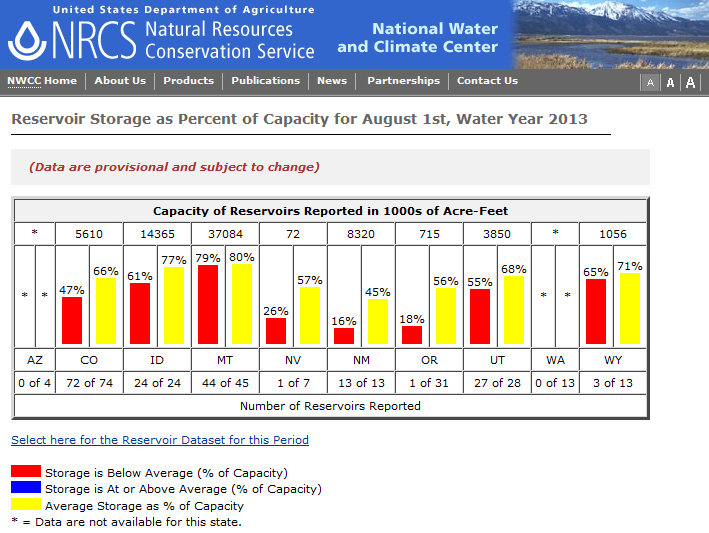
- USDA statewide reservoir storage as percent of capacity;
Meteorological:
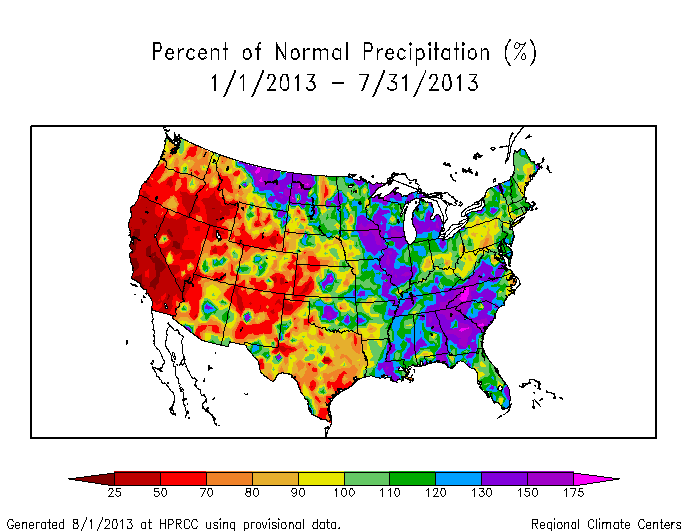
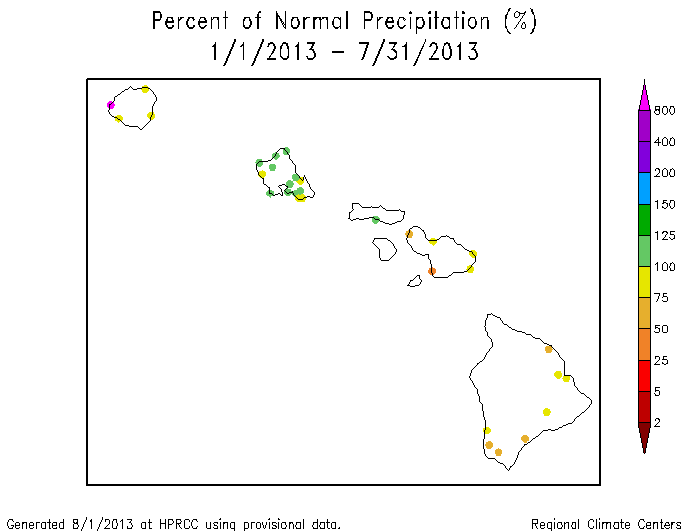
Map showing year-to-date percent of normal precipitation.
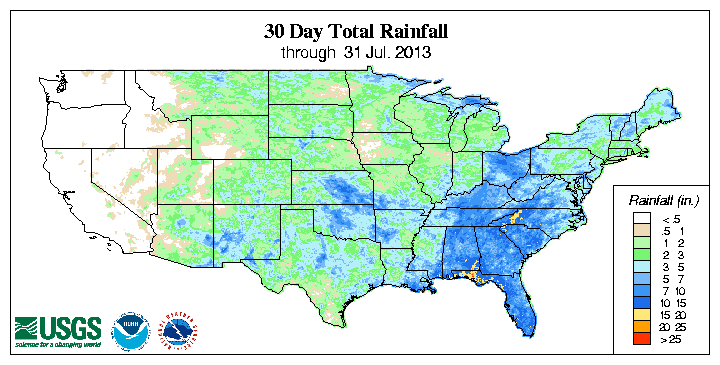
- monthly total precipitation (plotted by the USGS, NOAA National Weather Service [NWS], and NOAA High Plains Regional Climate Center [HPRCC]);
- monthly percent of normal precipitation and precipitation percentiles (NWS, HPRCC station observations, West SNOTEL and ACIS stations, West basins, Alaska SNOTEL stations, CPC, Oregon State University PRISM Climate Group) and precipitation anomalies (CPC);
- NCDC monthly statewide precipitation ranks;
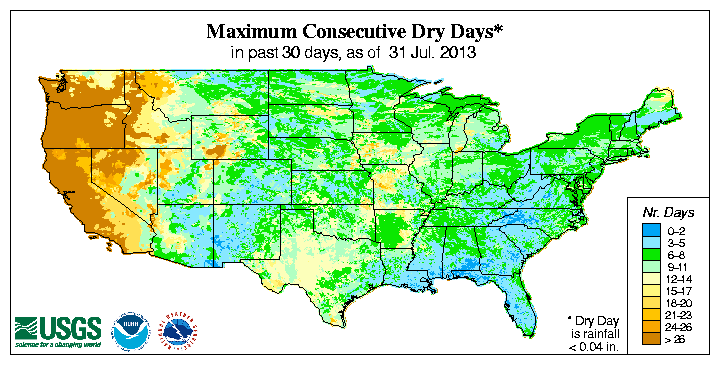
- USGS 30-day number of days with precipitation and maximum number of consecutive dry days;
- water-year-to-date (October-present) percent of normal precipitation (NWS, HPRCC station observations, West SNOTEL and ACIS stations, West basins, Alaska stations, Alaska basins), percent of average (West basins), and precipitation percentiles (West SNOTEL stations);
- monthly temperature departures from normal (CPC, HPRCC) and temperature percentiles (CPC),
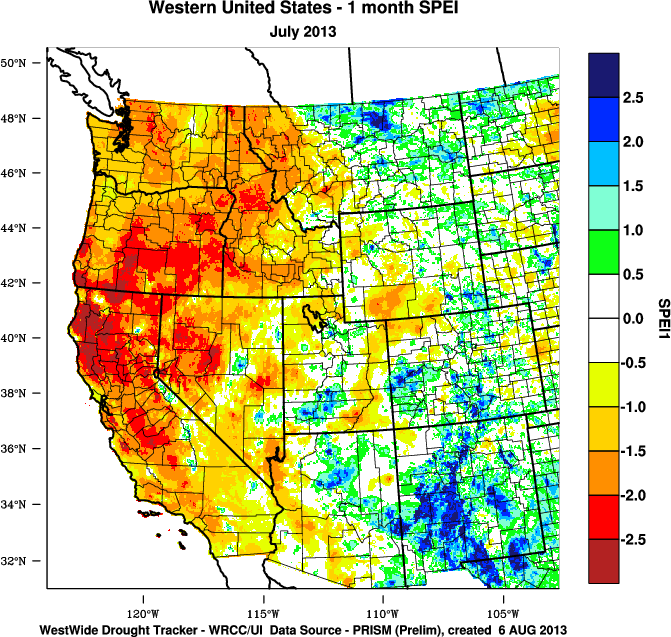
- NOAA Western Regional Climate Center monthly Standardized Precipitation Evaporation Index (SPEI);
- NCDC monthly standardized temperature departures and statewide temperature ranks; and
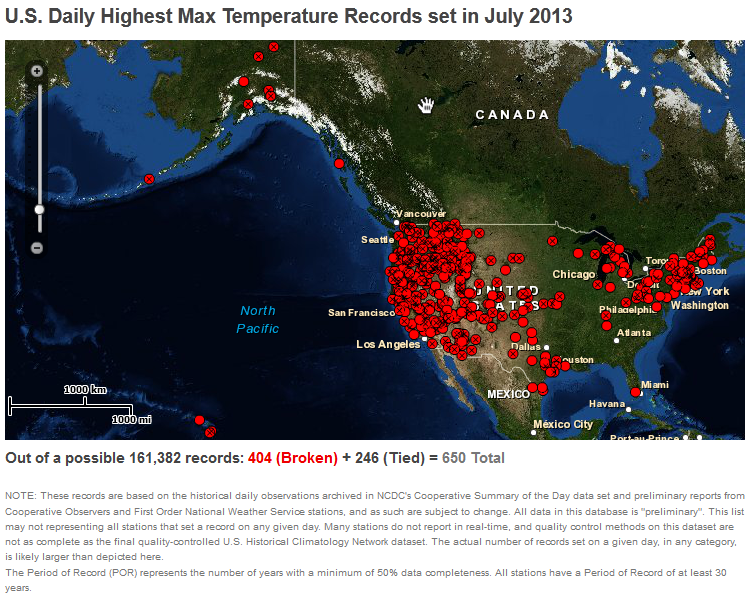
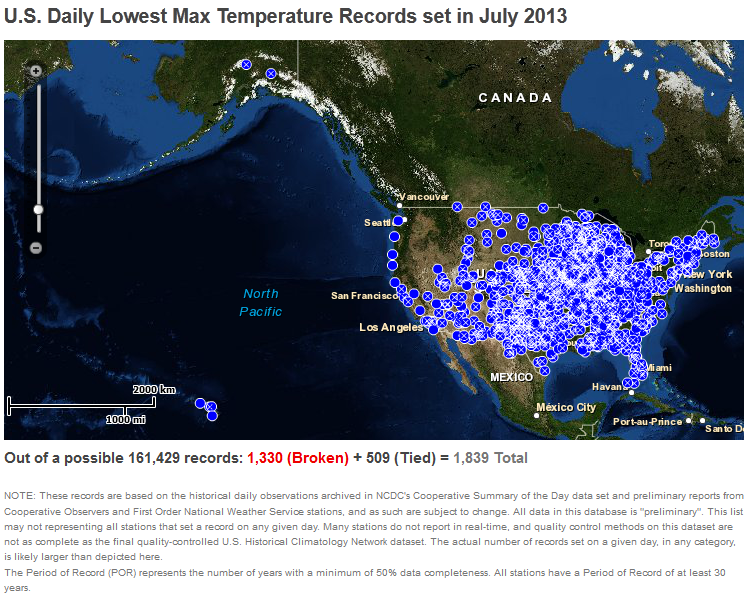
- number of record warm daily low temperatures, record daily high temperatures, record daily low temperatures, and record cool daily high temperatures, set during the month (from NCDC's daily records analysis) — about as many record cool high and low temperatures occurred as record warm highs and lows (1.1 times as many).
![NOAA National Weather Service [NWS]](/monitoring-content/sotc/drought/2013/07/noaa-nws-ahps-pcp-amt-us-mtd-0731.jpg)
![NOAA High Plains Regional Climate Center [HPRCC]](/monitoring-content/sotc/drought/2013/07/noaa-hprcc-pcp-amt-us-1m-0731.png)
Regional Discussion
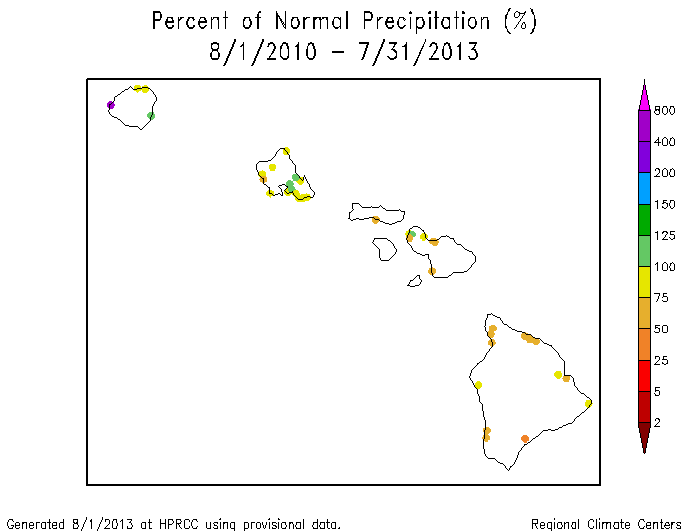
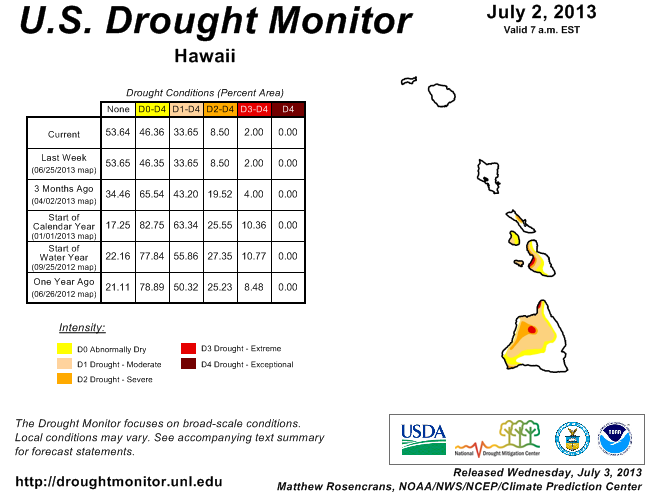
Hawaii: Precipitation for July 2013 was below normal for most stations in the Hawaiian Islands. But when rainfall from previous months is considered, the precipitation pattern is mixed with the Big Island and Maui generally drier than normal (last 2, 3, 4, 6, and 7 months). At longer time scales, dryness is more widespread across the islands (last 10, 12, 24, and 36 months). Streamflow averaged much below normal for July on the Big Island and Maui. The percent of the state experiencing moderate to extreme drought this month (33.1 percent) was about the same as last month.
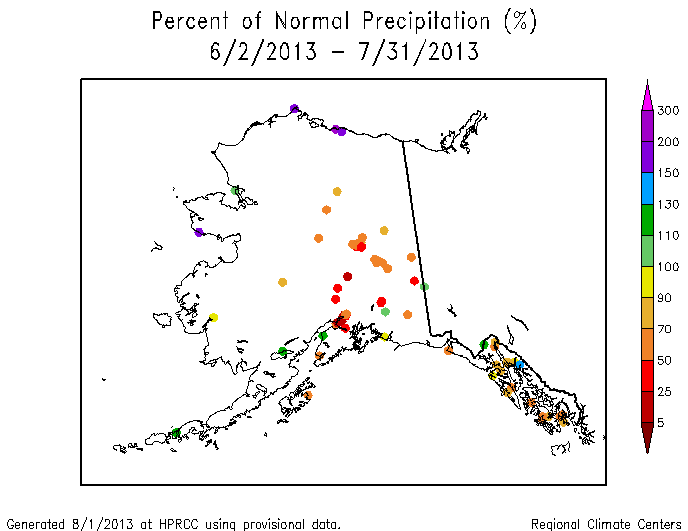
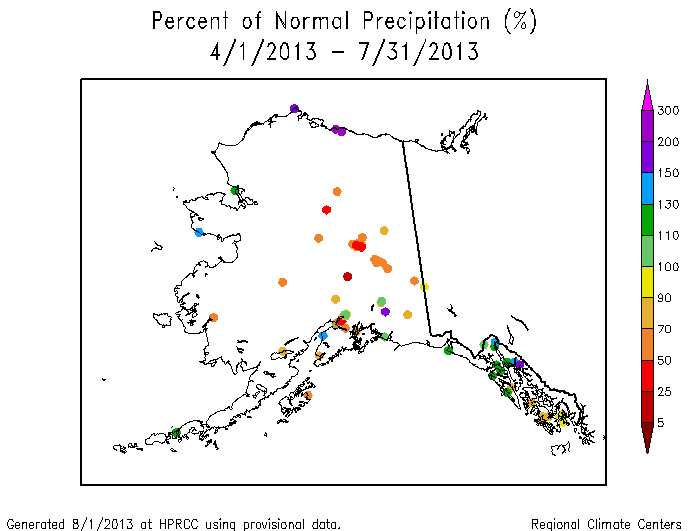
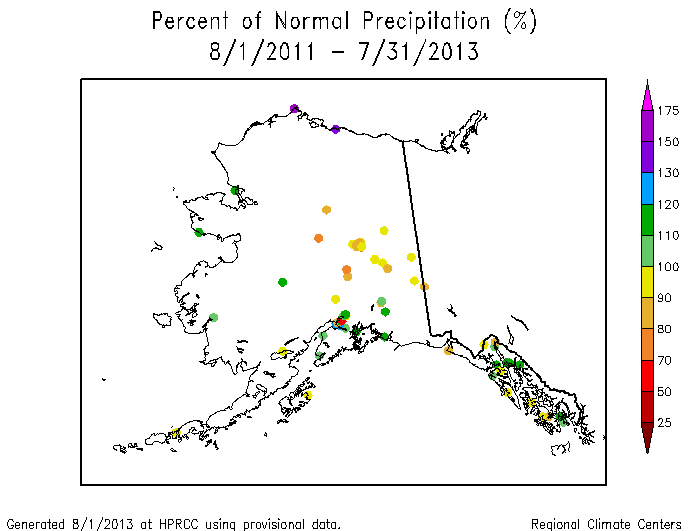
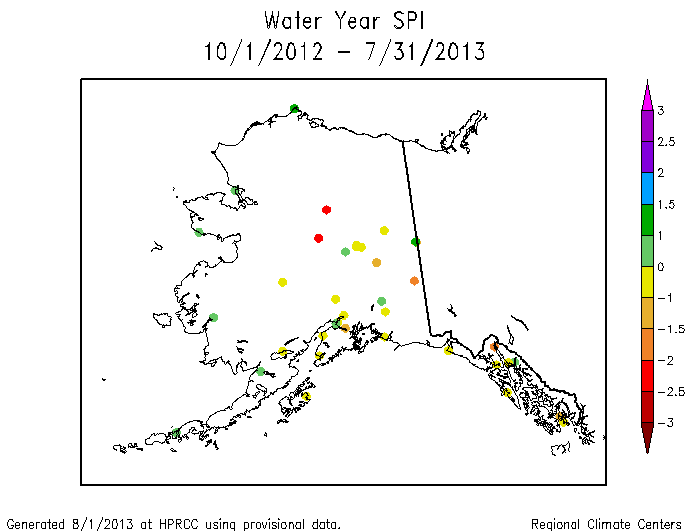
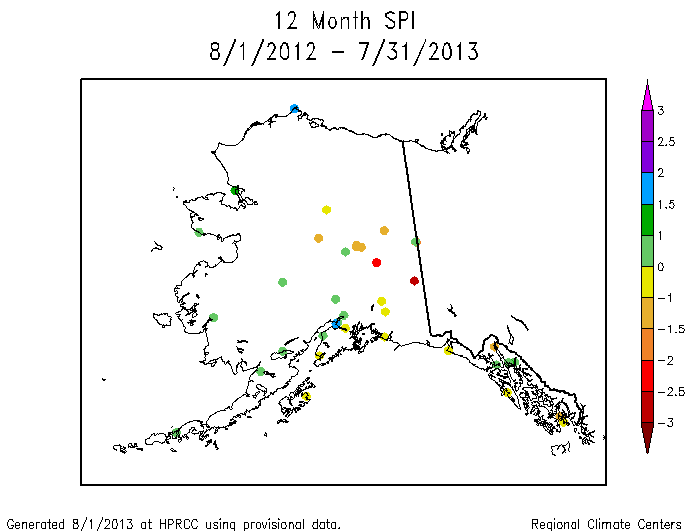
Alaska: Much of Alaska was drier than normal during July, especially the interior and southern locations. The dryness, coupled with record hot temperatures at some stations, set the stage for numerous wildfires. The dryness has been especially severe in the last year (last 2, 3, 4, 6, 7, 10, and 12 months), especially for the interior locations, but is also evident for the last two to three years. Moderate drought on the USDM map expanded, and severe drought was added to that interior region having the most severe precipitation deficits (based on SPI at 3, 6, 7, 10, and 12 months), with moderate to severe drought covering about 20 percent of the state compared to 15 percent last month. The drought expansion is also reflected in below-average streamflow.
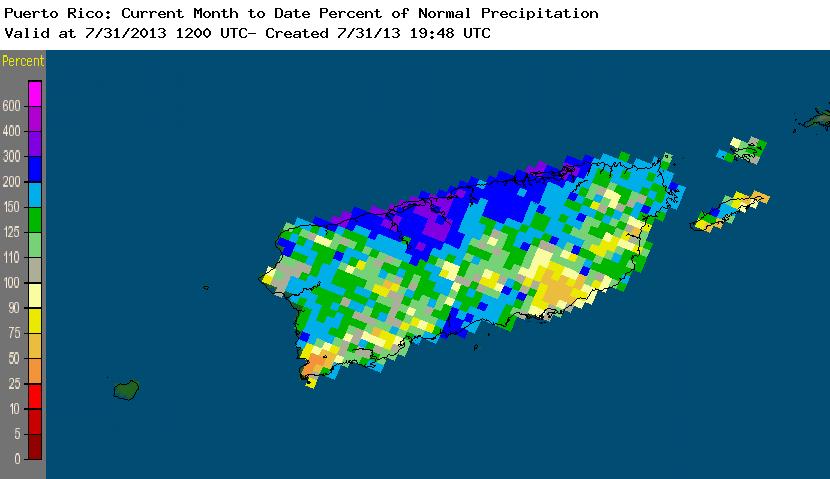
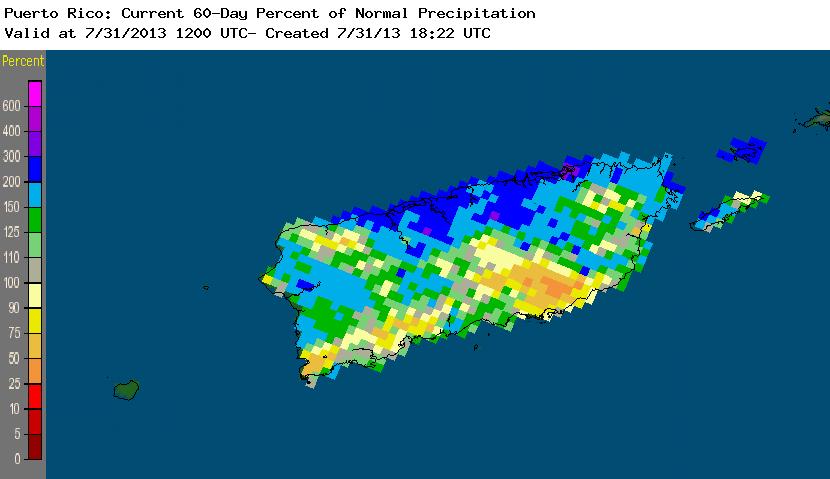
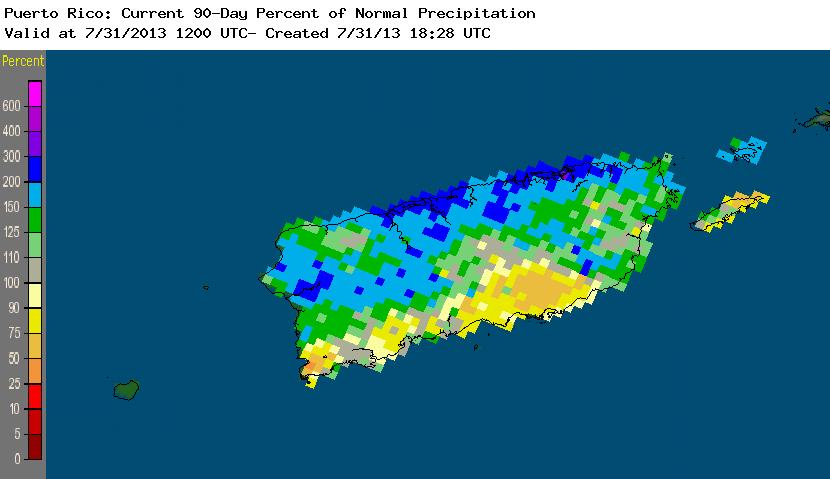
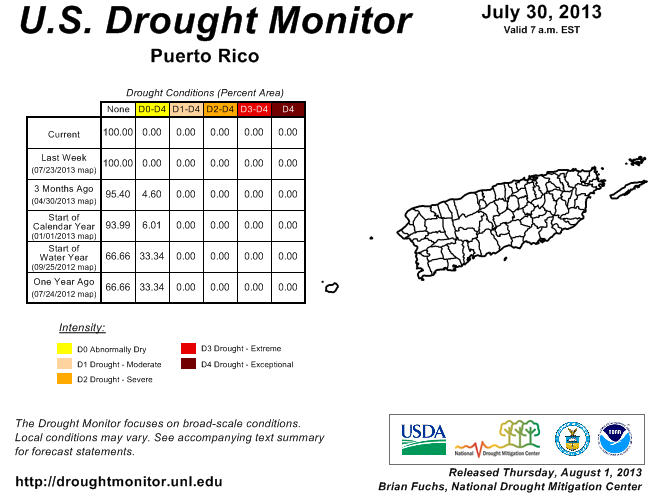
Puerto Rico: Most of Puerto Rico had normal to above-normal rainfall during July, with just a few areas along the southern coast drier than normal. However, the dryness is more evident and consistent at longer time scales (2, 3, 6, 7, and 10 months), especially along the south central coast. Streamflow averaged above normal and there was no drought or abnormal dryness on the USDM map.
 |

|
The July precipitation anomaly pattern of dryness in the Pacific Northwest, Upper Midwest, and Lower Mississippi Valley was reflected in the state ranks, with Oregon, Washington, and Iowa ranking in the top ten driest category, and six other states (including Louisiana) falling in the driest third of the historical record. Even though summer is the dry season for the Pacific Northwest, July 2013 ranked as the driest July in the 1895-2013 record for Oregon. The July 2013 dryness for Iowa is about as severe as it was for July 2012. Dryness for the last three months was centered in the West — along the Northern to Central Rocky Mountain states — although the summer monsoon has helped keep the statewide precipitation ranks from being too dry for many western states.

|

|
At the six-month time scale, dryness was widespread across the West while wet conditions dominated the Midwest and East. February-July 2013 ranked in the top ten driest category for four states (California, Idaho, Nevada, and Oregon) and in the driest third of the historical record for four additional western states plus one in the Southern Plains (Texas). The same four states ranked in the top ten driest category for the year-to-date (January-July 2013), with California having the driest January-July on record.

|

|
The last twelve months were the third driest August-July on record for Wyoming, ninth driest for Colorado, and tenth driest for Nebraska, and ranked in the driest third of the historical record for eight other states in the West and Plains. California had a wet start to its wet season (in late 2012), but the 2013 year-to-date has been so dry that it pulled the 12-month (August-July) precipitation rank down to twelfth driest. On the other hand, the monsoon season has been wet enough to pull New Mexico's 12-month precipitation rank up to twelfth driest and their 24-month (August 2011-July 2013) precipitation rank up to seventh driest. Near-record dryness has occurred in Wyoming for the past two August-July 12-month periods. This has resulted in the third driest 24-month period (August 2011-July 2013) for the state in the 1895-2013 record.
Percent area of the Western U.S. in moderate to extreme drought, January 1900 to present, based on the Palmer Drought Index.
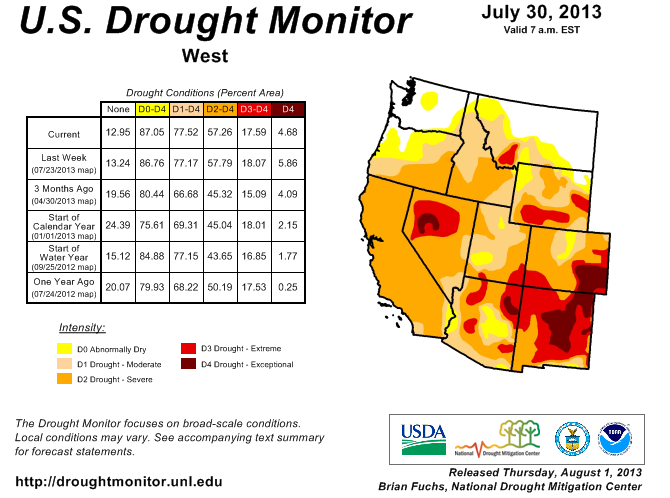
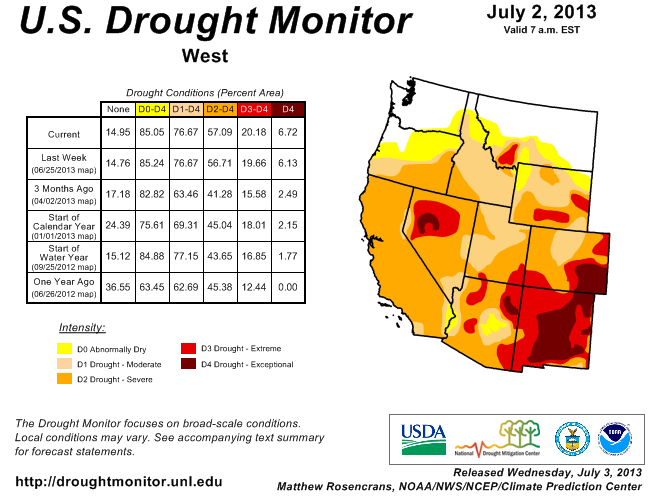
Monsoon showers brought above-normal precipitation to southern portions of the West during July 2013, but the northern portions were much drier than normal, especially the Pacific Northwest, with record dry conditions in places. As noted earlier, Oregon had the driest July on record. Unusually hot temperatures exacerbated the drought conditions. The SPI measures water supply and indicated dry (stressful) moisture conditions limited mostly to the Pacific Northwest. But when temperature is incorporated into the index (as the Standardized Precipitation Evaporation Index, or SPEI), moisture stress covers a much larger area. The SPEI for January-July 2013 indicates most of the West has experienced stressful conditions. The last seven months have had record dry conditions, especially in California (as noted above). Water year-to-date (October-present) precipitation was below normal for much of the West, especially the southern portions. Only a few areas, primarily the northern basins, averaged near to above normal. This pattern is evident in both the high elevation (SNOTEL) station percentiles and basin averages, as well as in low elevation station observations. The monsoon showers were reflected in above-normal streamflows in the southern basins, but many other western basins had below-normal streamflow. Reservoir storage was near to below average in most states. Integrated satellite and ground observations of vegetation condition (VegDRI), modeled vegetation condition (Soil Water Index, Water Requirement Satisfaction Index), and USDA observations indicated widespread stress on vegetation across the West, especially the Southwest. Several large wildfires developed across the West, especially during the latter half of the month. According to the USDM, 77.5 percent of the West was experiencing moderate to exceptional drought at the end of July, an increase over last month. The Palmer Drought Index percent area statistic was 62.5 percent, a decrease from last month.
Corn and Soybean Agricultural Belt
|
 |
The Primary Corn and Soybean agricultural belt was drier than normal in most sections but wet along the eastern edges this month. For the region as a whole, July 2013 ranked as the 48th driest and 24th coolest July in the 1895-2013 record. For the growing season thus far (March-July), the region ranked fifth wettest and tenth coolest. But when just the last four months are examined, April-July 2013 ranks as the third wettest and 21st coolest such four-month period. In fact, five of the last six years have had unusually wet April-July periods (2012 being a very dry exception).
NOAA Regional Climate Centers:
A more detailed drought discussion, provided by the NOAA Regional Climate Centers and others, can be found below.
West — Pacific Islands
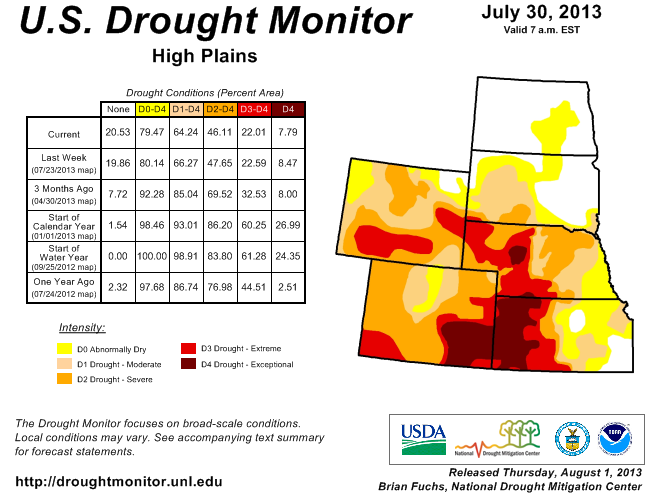
As described by the High Plains Regional Climate Center, average temperatures were generally below normal in the east and above normal in the west across the High Plains region this month. July precipitation was hit or miss across the High Plains region. Areas receiving at least 150 percent of normal precipitation included central Kansas, central South Dakota, central and western Colorado, and scattered pockets in eastern Wyoming, north central Nebraska, southwestern South Dakota, and northern North Dakota. While rain was needed to help alleviate ongoing drought conditions, some storms brought heavy rain which caused mudslides in fire burn scars in Colorado and flash flooding in parts of Colorado, Kansas, and Wyoming. Areas which missed out included eastern and central Nebraska, eastern and central North Dakota, and central Wyoming. These areas received less than 50 percent of normal precipitation. Because of the wide range in precipitation, there were stations which ranked in the top 10 driest or wettest Julys on record. With only 11 percent of normal precipitation, Omaha, Nebraska had its 2nd driest July on record with 0.44 inch (11 mm) of precipitation (period of record 1871-2013). The driest on record occurred only last year with 0.01 inch (0 mm). Meanwhile, precipitation in central Kansas helped alleviate drought conditions there, although long-term deficits were still high. For instance, Wichita, Kansas had measurable precipitation on 17 days in July, which broke the old record of 16 in 1950 (period of record 1888-2013). On average, Wichita has about 8 days with measurable precipitation in July. By the end of the month, Wichita received 7.69 inches (195 mm) of precipitation making this July its 4th wettest. Although 232 percent of normal, this was not nearly enough to beat the top spot of 13.37 inches (340 mm) in 1950.
The latest USDM showed both improvements and degradations over the past month. At the end of July, approximately 64 percent of the region was in moderate (D1) to exceptional (D4) drought — down just slightly from 67 percent at the end of June. An expansion of abnormally dry conditions (D0) occurred in east-central North Dakota and eastern parts of Kansas, Nebraska, and South Dakota. In addition, two new areas of D1 were introduced in far southeastern South Dakota and northeastern Kansas. One-category improvements were made in some areas of north-central and eastern Colorado. There was quite a bit of jostling of drought conditions in Kansas where some areas had improvements, while others had degradations. By the end of the month, 25 percent of the state remained in the D4 designation, however. Wyoming had an increase in severe (D2) and extreme (D3) drought coverage, going from about 47 percent of the state to 52 percent of the state.
As explained by the Southern Regional Climate Center, for the Southern region, the month of July proved to be a cooler than normal month across the board. For some parts of the region, July was a much wetter than normal month, while other areas in the region experienced a much drier than normal month. The drier than normal areas extended over much of the Texas and Louisiana gulf coast zones, and through eastern Arkansas and northern Mississippi. The wettest areas included much of central Tennessee, central Texas, and Oklahoma, where precipitation totals ranged from one and a half to over three times the monthly normal.
Drought conditions changed little over the month of July. Dryness throughout much of Arkansas led to the introduction of some moderate drought. This was also the case for some parishes in west central Louisiana. Drought conditions in Texas and western Oklahoma were relatively unchanged, despite anomalously high precipitation in central Texas.
In Texas, the cooler and wetter weather has helped farmers and ranchers across the state. East Texas vineyard owners are predicting one of their best harvests in years due to perfect conditions. Corn and cotton farmers in central Texas believe the July rains saved several million dollars of crops after the dry June. Still, problems for ranchers persist, but efforts to help the continually hurting herd numbers are taking place, including hay planting in 197 counties across the state to provide food for cattle. Not all of the rainfall was beneficial, however. Many rainstorms brought flooding, slowing down commuters in Houston, filling up a jail in Hale County, and flooding neighborhoods in El Paso. The rains also brought lightning, which sparked several house fires and small grassfires across the state. Damages greater than $260,000 were reported in Austin, more than 5,000 people lost power in El Paso, and several lightning-caused grassfires burned hundreds of acres across much of the central portions of the state (Information provided by the Texas State Climate Office).
Unfortunately, reservoirs throughout Texas continue to decline. Many regions across the state have ramped up their water restrictions, including Stage 2 restrictions in Austin and Victoria, Stage 3 in Galveston, and Stage 4 in Marlin after Dow Chemical claimed senior water rights along the Brazos River. To combat this, water reclamation projects are gaining steam in Austin, with an estimated 8.5 billion gallons of reused water possible, and a new pipeline in Dallas from Lake Palestine, costing an estimated $2.3 billion (Information provided by the Texas State Climate Office).
As summarized by the Midwest Regional Climate Center, July temperatures in the Midwest ranged from near normal to 3 degrees F (2 C) below normal. The near normal temperatures stretched across the upper Midwest and then southward into Ohio. Slightly cooler than normal temperatures were recorded in Iowa, Missouri, Illinois, Indiana, and Kentucky. The month began with cool temperatures and then warmed to well above normal mid-month before cooling to well below normal in the last week of July. July precipitation ranged from less than 25 percent of normal in western Iowa to about twice normal in parts of southern Missouri, southern Illinois, Kentucky, Ohio, Upper Michigan, and in the arrowhead of Minnesota. A few cities in western Iowa set new July precipitation records with less than a quarter inch (6 mm). The dryness in Iowa was a drastic change from the wettest spring on record for the state.
The Midwest began the month nearly drought free but dryness in the western states (Minnesota, Iowa, and Missouri) led to expanding areas of moderate drought and abnormally dry conditions in the USDM. Moderate drought expanded only slightly from under one percent to just over two percent of the region. Abnormally dry conditions grew much more going from about two percent to nearly 19 percent of the region. The dryness has started to show in crop condition reports but has been mitigated somewhat by the moist soils from earlier rains and cooler than normal conditions. The cooler weather in July has been good because the crops have seen little heat stress but the accumulation of growing degree days has been slowed. Because planting was later than normal and degree day accumulation has also behind normal, concerns about a damaging fall freeze are increasing because the crops will likely mature and dry down later than normal in 2013.
As noted by the Southeast Regional Climate Center, mean temperatures were variable across the Southeast in July and, for the second consecutive month, there was a relative absence of extreme heat across much of the region. Also, for the second consecutive month, precipitation was much above average across a large portion of the region. The wettest locations were found across the western Panhandle of Florida, the Upstate of South Carolina, and western North Carolina, where monthly totals exceeded 20 inches (508 mm) in places, or more than 300 percent of normal. Precipitation was also above average across Puerto Rico and much of the U.S. Virgin Islands. Several locations recorded their wettest July on record. While most of the region observed above average rainfall for the month, parts of eastern North Carolina were relatively dry in July. Cape Hatteras, NC recorded just 1.88 inches (48 mm) of rain for the month, which was more than 3 inches (76 mm) below normal.
July marked the first time in over three years that the Southeast region was free of any USDM drought or abnormally dry designation. However, the persistent wet pattern continued to cause problems for farmers. Heavy rains and standing water prevented many farmers from harvesting their crop, cutting hay, spraying chemicals and applying treatments, and preparing fields for fall and winter crops. Mold and other fungal diseases were reported across the region, particularly on crops such as corn, tomatoes, peanuts, and forage. The excess moisture has also degraded the quality and flavor of many crops, including watermelons, tobacco, and peaches, and has hampered the growth of cotton and corn by limiting the amount of oxygen available to the roots. In some locations across northern Florida and southern Georgia, the corn crop reached only half its normal height. Agricultural officials have predicted that losses across much of the region could be in the billions of dollars.
As explained by the Northeast Regional Climate Center, the Northeast continued to be warmer than normal in July, and the wet conditions of June spilled over into July for most Northeast states. The region ended the month with 5.14 inches (130.6 mm) of precipitation, 121 percent of normal, making it the 15th wettest July since 1895. At the start of July, lingering abnormal dryness was located along the Pennsylvania-West Virginia border, but by mid-month, ongoing abundant precipitation eased dryness in that area.
As summarized by the Western Regional Climate Center, the North American Monsoon was very active this month, bringing much needed precipitation to the Southwest. As is typical for July, dry conditions dominated in the Pacific Northwest. The Great Basin and Intermountain West saw record high July temperatures, while temperatures in coastal regions were moderated by persistent marine stratus and temperatures in the Southwest curbed by frequent thunderstorms. Persistent ridging produced record monthly temperatures in the northern Great Basin.
Monsoon precipitation brought spotty and minor drought relief to Arizona and New Mexico, with many locations recording above normal precipitation. After consecutive below normal monsoon seasons, the Albuquerque, New Mexico airport recorded 2.77 in (70 mm) this month, the 9th wettest July in a 117-year record. This rainfall came in deluges, with nearly half (1.36 in/35mm) on the 26th, resulting in some flooding. In Arizona, Flagstaff tied 1919 for the wettest July on record at 7.58 in (193 mm). Phoenix, Yuma, and Tucson all saw an excellent start to the monsoon season as well, receiving above normal precipitation for the month. Cedar City, Utah logged 5.25 in (133 mm) of monsoon rain, 625% of normal and easily surpassing the previous July record of 4.37 in (111 mm) set in 1975. Los Angeles, California typically receives no precipitation in July, so that a mere 0.09 in (2.3 mm) led to the 3rd wettest July in a 108-year record.
In contrast, the Northwest experienced its typical dry July weather. Seattle, Washington received a trace of precipitation this month, tying 1958 and 1960 for driest July. Normal there is 0.7 in (18 mm). Quillayute, Washington averages 1.98 in (50 mm) for July, but saw only 0.01 in (0.25 mm) on the last day of the month, beating out 2010 (0.35 in/9 mm) for driest July in its 48-year record. Locations throughout Northern California, such as San Francisco and Sacramento stayed dry this month. July 6 brought the first rainfall to Las Vegas since April 16. This 80-day dry stretch is the 4th longest on record.
Quiescent conditions prevailed in Hawaii for most of July until the remnants of Tropical Storm Flossie brought high winds and locally heavy precipitation near the close of the month. Storm totals were highest around Maui County, helping stations in that area surpass their July normals. Kahului recorded 0.86 in (22 mm) for the month, 238% of normal. Of this, 0.79 in (20 mm) fell on the 29th associated with Flossie. Further north, warm temperatures continued in Alaska this month. Anchorage set a record of 14 consecutive days above 70 F (21.1 C) July 17th-30th. This beats the previous record of 13 days set in August of 2004 and helped to make this the 4th warmest July on record in Anchorage. On July 31, Fairbanks tied its all-time record for number of 80 F or greater (26.7 C) days in a summer at 30 days. So far, this is the second warmest summer on record at Fairbanks behind the summer of 2004.
Pacific Islands: According to reports from National Weather Service offices, the Pacific ENSO Applications Climate Center (PEAC), and partners, conditions varied across the Pacific Islands.
As noted by the National Weather Service office in Honolulu, most of July was very dry across the state and some sites were heading toward a record dry month. However, tropical cyclone Flossie passed just to the north of the main Hawaiian islands on July 29 and 30 with associated rain bands boosting rainfall totals as they swept westward across the state. The rainfall appeared to have prevented a worsening of drought status in some areas but did not do enough to show significant improvements. Thus, extreme drought, or the D3 category in the USDM map, remained in place over portions of the Big Island and the island of Maui. The D3 area in the Pohakuloa region of the Hamakua district expanded a bit during early July with additional expansion stalled by Flossie?s rainfall. Extreme drought over the northwestern portion of the north Kohala district did not change and for the most part missed out on the tropical cyclone?s precipitation. Severe drought, or the D2 category, returned to the north-facing slopes of the north Kona district and portions of the south Kohala district, and maintained its presence over the lower elevations of the southern Kau district near south point. Drought conditions in Maui County also remained in place with extreme drought continuing over the lower southwest slope of Haleakala in the Kihei and Ulupalakua areas. Severe drought also persisted over the lower leeward slopes of the west Maui Mountains from Lahaina to Maalaea. Molokai had ongoing restrictions to irrigation water use which kept the severe drought designation in place.
Some drought impacts impacts in Hawaii include the following:
KAUAI.
THERE ARE CURRENTLY NO DROUGHT AREAS ON KAUAI.

OAHU.
THERE ARE CURRENTLY NO DROUGHT AREAS ON OAHU.

MOLOKAI.
THE STATE OF HAWAII DEPARTMENT OF AGRICULTURE MAINTAINED A MANDATORY
REDUCTION IN IRRIGATION WATER CONSUMPTION OF 20 PERCENT FOR FARMERS
SERVED BY THE KUALAPUU RESERVOIR.  THE RESTRICTION WAS REDUCED FROM
30 PERCENT TO 20 PERCENT ON APRIL 2 2013.

RAINFALL AND SATELLITE-BASED VEGETATION HEALTH DATA INDICATED SOME
DRYNESS OCCURRING BUT NO DROUGHT IMPACTS HAVE BEEN REPORTED SO FAR
OUTSIDE OF THE AREAS SERVICED BY THE KUALAPUU RESERVOIR.

LANAI.
SATELLITE-BASED VEGETATION HEALTH DATA SHOW LITTLE CHANGE IN
CONDITIONS OVER THE PAST MONTH.  NO RECENT GROUND-BASED OBSERVATIONS
HAVE BEEN RECEIVED TO CONFIRM THIS.

MAUI.
INFORMATION FROM RANCHERS AND CROP PRODUCERS INDICATED THAT TROPICAL
CYCLONE FLOSSIE DID NOT PROVIDE MUCH BENEFIT IN THE EXISTING EXTREME
DROUGHT AREA.  PASTURE CONDITIONS REMAIN VERY DRY.  HEAVY RAINFALL
DURING THE AFTERNOON OF JULY 29 EITHER MISSED THE WORST DROUGHT
AREAS OR OCCURRED TOO QUICKLY TO SUBSTANTIALLY INCREASE SOIL
MOISTURE.  BREEZY AND DRY TRADE WIND CONDITIONS FOLLOWING FLOSSIE
ALSO HELPED LIMIT MOISTURE BENEFITS.

THE MAUI COUNTY DEPARTMENT OF WATER SUPPLY HAS MAINTAINED THEIR
LONG-STANDING REQUEST FOR A 10 PERCENT REDUCTION IN WATER USE BY
CENTRAL AND SOUTH MAUI RESIDENTS.

BIG ISLAND.
THE CONSENSUS FROM PRODUCERS ACROSS THE ISLAND WAS THAT FLOSSIE WAS
A BIG DISAPPOINTMENT IN TERMS OF RAINFALL.  THE MOISTURE  INCREASE
WAS QUICKLY OFFSET BY THE QUICK RETURN OF DRY AND GUSTY TRADE WINDS
IN THE PRIMARY DROUGHT AREAS.  ON THE EAST-FACING SLOPES...CORN...
GINGER...AND SWEET POTATO FARMERS HAVE INDICATED THAT RAINFALL...
WHILE BELOW NORMAL IN AMOUNTS...HAVE BEEN SUFFICIENT SO FAR TO MEET
NEEDS.
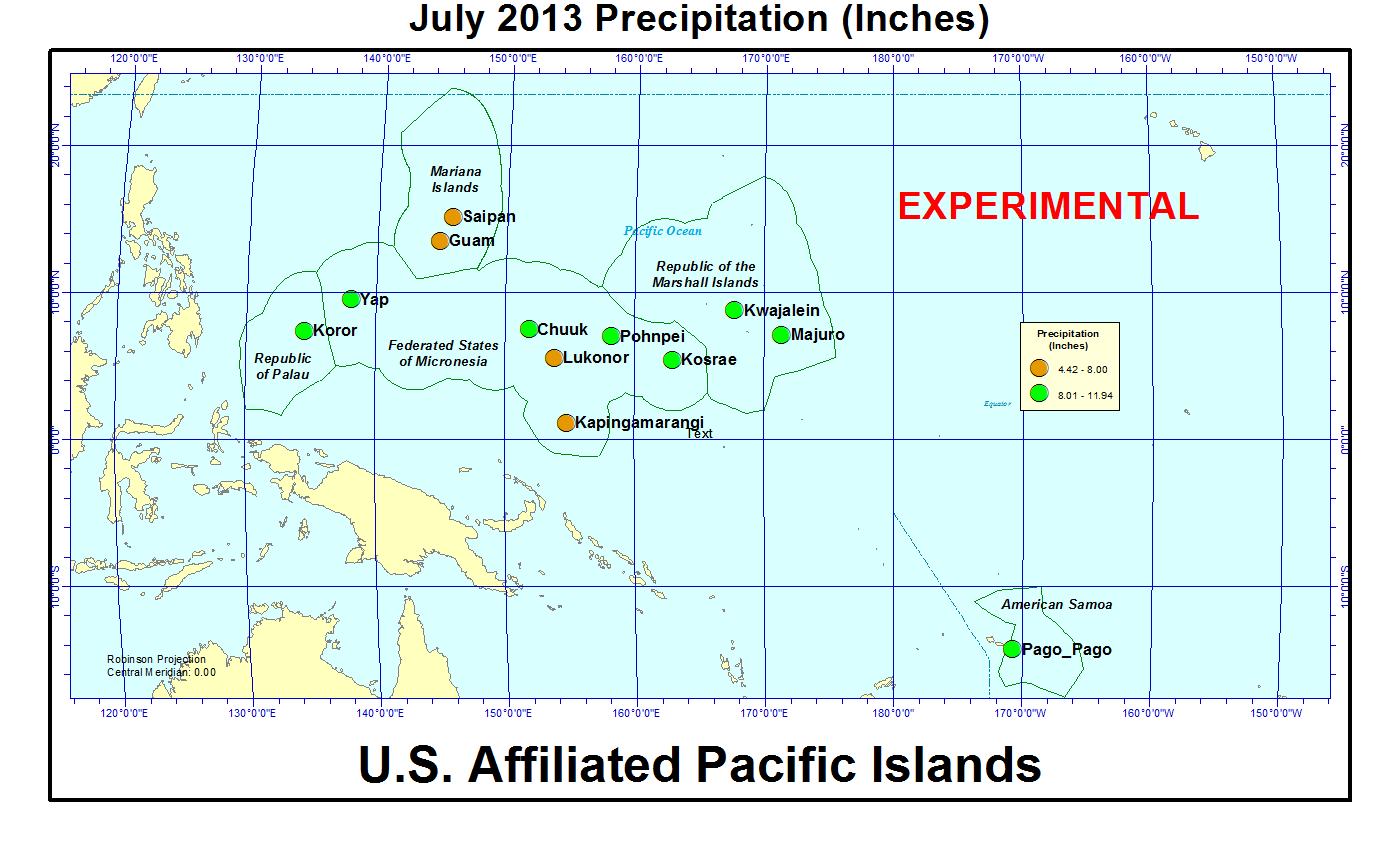
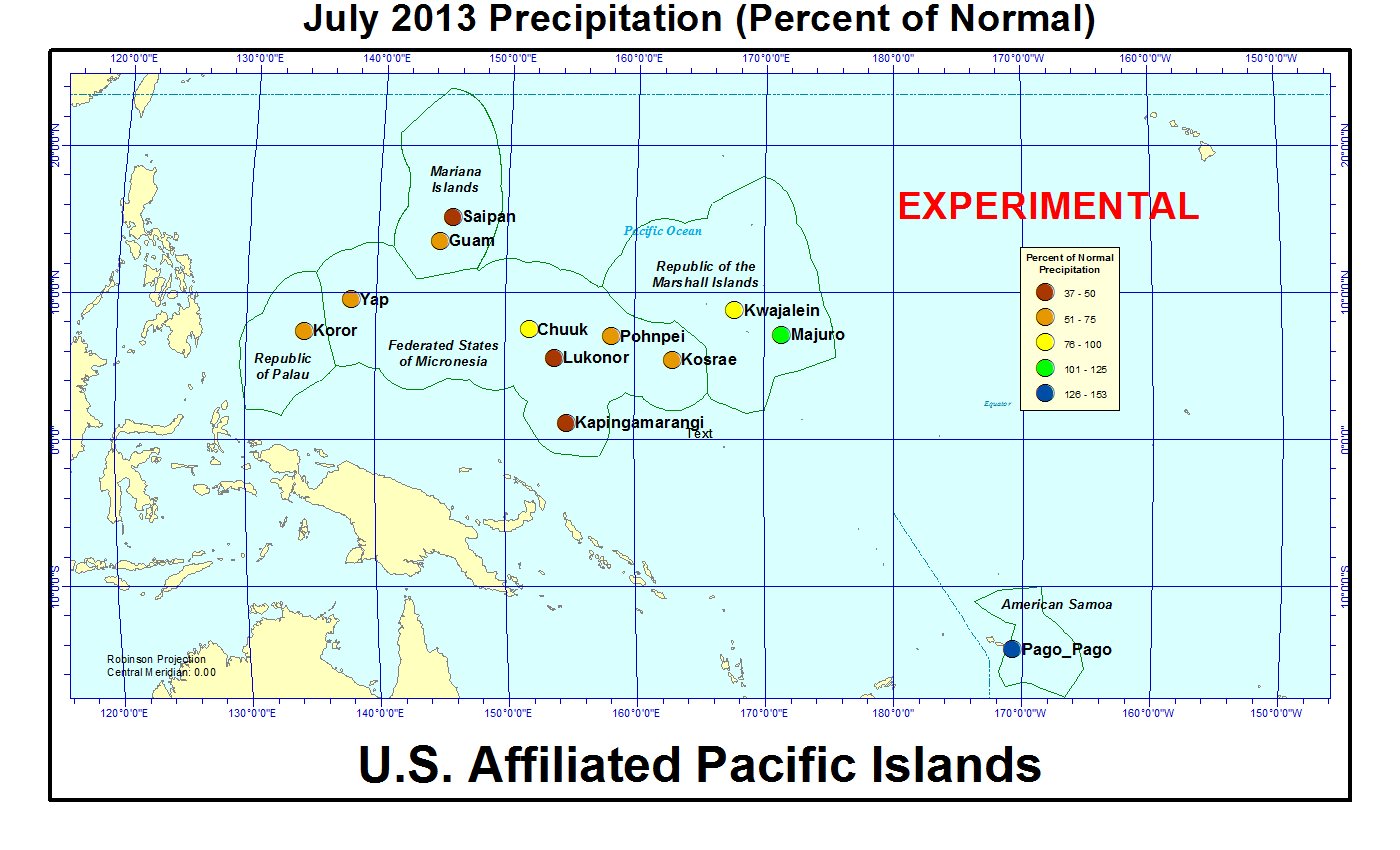
On other Pacific Islands (maps — Micronesia, Marshall Islands, basinwide), July was drier than normal at Koror, Yap, Guam, Saipan, Chuuk, Lukonor, Pohnpei, Kosrae, and Kapingamarangi, near normal at Kwajalein and Majuro, and wetter than normal at Pago Pago. But this is the wet season at many of these stations when normals are usually high. The July rainfall amounts were above 4 inches (a critical threshold amount for islands in the Mariana chain) at Guam and Saipan, and above 8 inches (another critical threshold) at all of the other stations except Kapingamarangi and Lukonor.
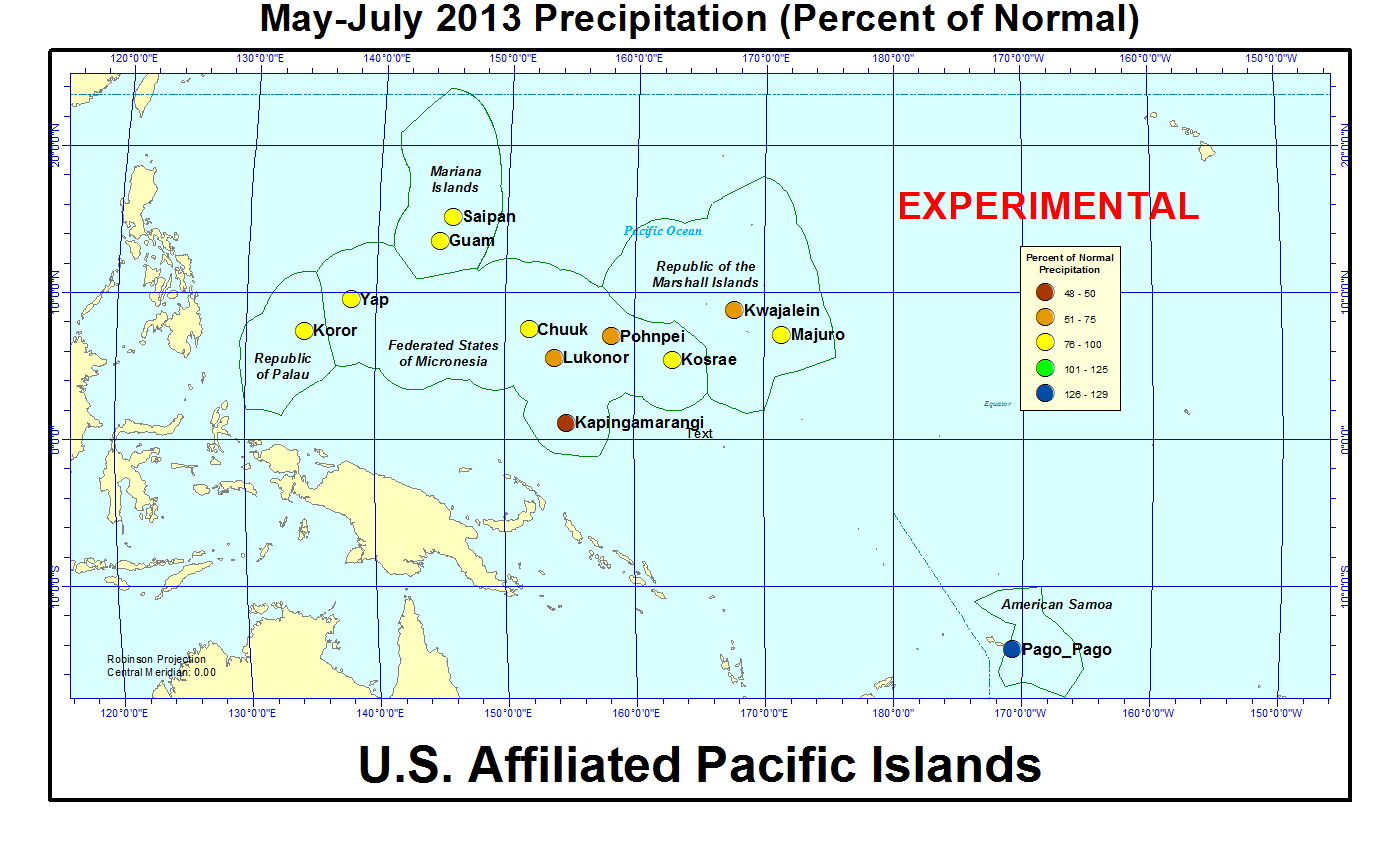
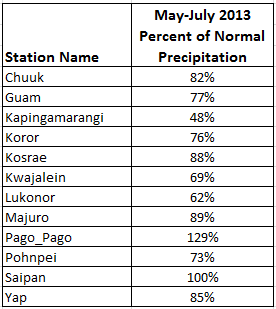
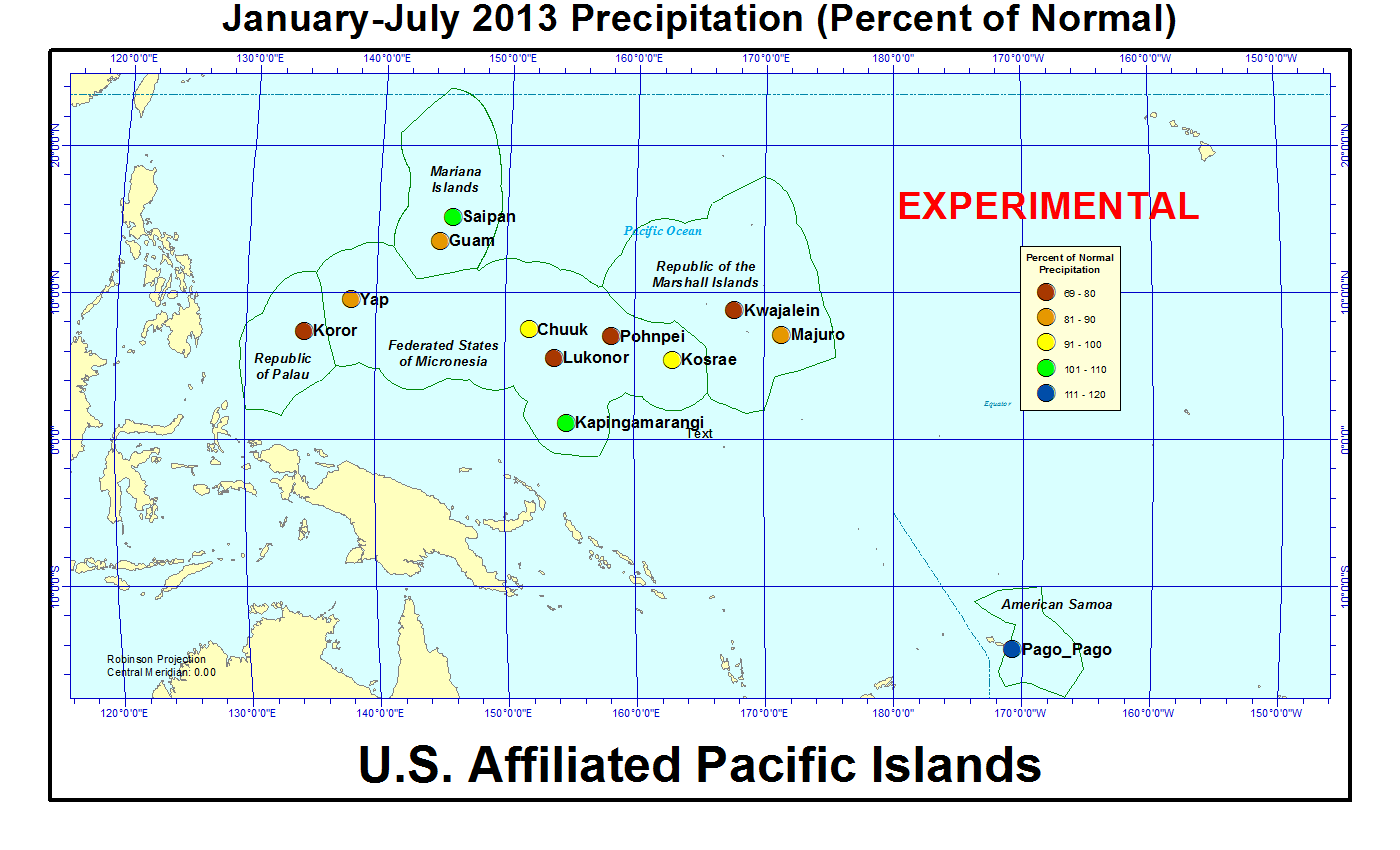
The wetter pattern of July 2013 was an improvement over drier conditions which have prevailed in some areas during recent months. The last three months (May-July 2013) were drier than normal at all stations except Pago Pago and Saipan; the year to date (January-July 2013) was wetter than normal at Pago Pago and near normal at Kapingamarangi, Saipan, and Chuuk, but drier than normal at the other stations; and the last twelve months (August 2012-July 2013) were drier than normal at Koror, Lukonor, Pohnpei, Kwajalein, and Majuro. Drought was especially severe in the northern Marshall Islands. The Republic of the Marshall Islands Cabinet on May 6 issued a state of disaster for the northern Republic of the Marshall Islands (RMI) where drought affected over 6,300 people, damaged or destroyed considerable agriculture on many atolls, and made well water too salty for human consumption. Seasonal trade-wind showers helped moderate the dry weather in June and July, but a full recovery is expected to take several months.
| Station Name | Aug 2012 | Sep 2012 | Oct 2012 | Nov 2012 | Dec 2012 | Jan 2013 | Feb 2013 | Mar 2013 | Apr 2013 | May 2013 | Jun 2013 | Jul 2013 | Aug- Jul |
|---|---|---|---|---|---|---|---|---|---|---|---|---|---|
| Chuuk | 169% | 86% | 128% | 144% | 116% | 99% | 146% | 192% | 49% | 79% | 84% | 84% | 107% |
| Guam NAS | 179% | 126% | 92% | 74% | 55% | 128% | 97% | 191% | 45% | 103% | 102% | 53% | 90% |
| Kapingamarangi | 192% | 147% | 138% | 167% | 74% | 197% | 154% | 199% | 77% | 48% | 47% | 50% | 102% |
| Koror | 102% | 111% | 78% | 67% | 103% | 72% | 92% | 56% | 103% | 109% | 67% | 64% | 78% |
| Kosrae | 144% | 109% | 113% | 119% | 110% | 98% | 146% | 64% | 95% | 76% | 122% | 69% | 87% |
| Kwajalein | 95% | 57% | 73% | 45% | 230% | 39% | 17% | 74% | 178% | 29% | 67% | 98% | 81% |
| Lukonor | 73% | 148% | 74% | 178% | 62% | 60% | 134% | 122% | 71% | 92% | 64% | 37% | 78% |
| Majuro | 87% | 67% | 46% | 154% | 53% | 31% | 152% | 78% | 69% | 65% | 96% | 103% | 83% |
| Pago Pago | 59% | 195% | 54% | 181% | 143% | 137% | 87% | 93% | 144% | 66% | 220% | 153% | 109% |
| Pohnpei | 96% | 90% | 82% | 109% | 71% | 83% | 54% | 67% | 59% | 52% | 113% | 61% | 75% |
| Saipan | 135% | 101% | 172% | 31% | 89% | 191% | 78% | 127% | 63% | 203% | 157% | 50% | 110% |
| Yap | 128% | 187% | 140% | 121% | 102% | 90% | 113% | 130% | 50% | 69% | 134% | 53% | 108% |
| Station Name | Aug 2012 | Sep 2012 | Oct 2012 | Nov 2012 | Dec 2012 | Jan 2013 | Feb 2013 | Mar 2013 | Apr 2013 | May 2013 | Jun 2013 | Jul 2013 | Aug- Jul |
|---|---|---|---|---|---|---|---|---|---|---|---|---|---|
| Chuuk | 21.78" | 10.04" | 14.68" | 15.30" | 13.09" | 10.00" | 10.60" | 16.00" | 6.11" | 8.93" | 9.85" | 10.04" | 146.42" |
| Guam NAS | 26.42" | 15.98" | 10.56" | 5.45" | 2.81" | 5.12" | 2.95" | 3.95" | 1.14" | 3.51" | 6.32" | 5.39" | 89.6" |
| Kapingamarangi | 15.57" | 14.56" | 11.32" | 15.44" | 7.25" | 18.02" | 14.25" | 22.79" | 10.51" | 5.84" | 6.45" | 7.11" | 149.11" |
| Koror | 13.72" | 13.01" | 9.23" | 7.68" | 11.52" | 7.29" | 7.91" | 4.13" | 7.57" | 12.87" | 11.70" | 11.94" | 118.57" |
| Kosrae | 20.46" | 15.52" | 12.33" | 16.49" | 17.75" | 16.27" | 18.89" | 10.20" | 16.71" | 13.41" | 17.89" | 10.33" | 186.25" |
| Kwajalein | 9.23" | 6.17" | 8.18" | 5.09" | 15.33" | 1.22" | 0.46" | 1.73" | 9.34" | 1.97" | 4.66" | 9.71" | 73.09" |
| Lukonor | 10.26" | 15.02" | 8.39" | 16.18" | 7.00" | 5.05" | 11.93" | 11.34" | 8.06" | 10.77" | 7.51" | 5.88" | 117.39" |
| Majuro | 10.15" | 7.47" | 5.84" | 20.69" | 6.09" | 2.42" | 10.44" | 5.13" | 6.46" | 6.60" | 10.55" | 11.51" | 103.35" |
| Pago Pago | 3.19" | 12.73" | 4.99" | 18.34" | 18.31" | 18.27" | 10.48" | 9.97" | 13.52" | 6.35" | 11.75" | 8.48" | 136.38" |
| Pohnpei | 13.62" | 11.27" | 12.59" | 16.18" | 11.37" | 10.88" | 5.14" | 8.78" | 10.92" | 10.44" | 16.79" | 9.42" | 137.4" |
| Saipan | 17.73" | 10.24" | 18.31" | 1.75" | 3.44" | 4.83" | 2.03" | 2.40" | 1.65" | 4.82" | 5.68" | 4.42" | 77.3" |
| Yap | 18.92" | 25.19" | 17.08" | 10.67" | 8.68" | 5.72" | 5.86" | 5.95" | 2.81" | 5.41" | 16.16" | 8.01" | 130.46" |
| Station Name | Aug 2012 | Sep 2012 | Oct 2012 | Nov 2012 | Dec 2012 | Jan 2013 | Feb 2013 | Mar 2013 | Apr 2013 | May 2013 | Jun 2013 | Jul 2013 | Aug- Jul |
|---|---|---|---|---|---|---|---|---|---|---|---|---|---|
| Chuuk | 12.86" | 11.71" | 11.51" | 10.61" | 11.25" | 10.10" | 7.25" | 8.32" | 12.47" | 11.30" | 11.66" | 11.98" | 136.77" |
| Guam NAS | 14.74" | 12.66" | 11.44" | 7.38" | 5.11" | 4.01" | 3.03" | 2.07" | 2.53" | 3.40" | 6.18" | 10.14" | 99.09" |
| Kapingamarangi | 8.13" | 9.93" | 8.19" | 9.27" | 9.84" | 9.15" | 9.27" | 11.43" | 13.64" | 12.08" | 13.78" | 14.15" | 145.85" |
| Koror | 13.50" | 11.77" | 11.84" | 11.39" | 11.16" | 10.18" | 8.56" | 7.44" | 7.32" | 11.83" | 17.48" | 18.53" | 152.90" |
| Kosrae | 14.22" | 14.22" | 10.94" | 13.83" | 16.11" | 16.67" | 12.93" | 16.06" | 17.51" | 17.75" | 14.64" | 14.91" | 213.87" |
| Kwajalein | 9.74" | 10.74" | 11.18" | 11.28" | 6.66" | 3.16" | 2.64" | 2.35" | 5.26" | 6.72" | 6.93" | 9.87" | 90.41" |
| Lukonor | 14.04" | 10.15" | 11.32" | 9.08" | 11.27" | 8.41" | 8.93" | 9.26" | 11.31" | 11.69" | 11.65" | 15.93" | 151.36" |
| Majuro | 11.69" | 11.17" | 12.73" | 13.44" | 11.39" | 7.74" | 6.88" | 6.58" | 9.42" | 10.11" | 11.01" | 11.17" | 125.25" |
| Pago Pago | 5.38" | 6.53" | 9.26" | 10.14" | 12.84" | 13.34" | 12.00" | 10.68" | 9.39" | 9.66" | 5.33" | 5.55" | 125.57" |
| Pohnpei | 14.26" | 12.55" | 15.27" | 14.83" | 16.08" | 13.18" | 9.55" | 13.17" | 18.41" | 19.96" | 14.81" | 15.43" | 182.36" |
| Saipan | 13.13" | 10.09" | 10.62" | 5.61" | 3.85" | 2.53" | 2.59" | 1.89" | 2.63" | 2.38" | 3.62" | 8.91" | 70.25" |
| Yap | 14.82" | 13.50" | 12.18" | 8.83" | 8.51" | 6.39" | 5.19" | 4.56" | 5.63" | 7.85" | 12.04" | 15.08" | 120.31" |

[top]
State/Regional/National Moisture Status
A detailed review of drought and moisture conditions is available for all contiguous U.S. states, the nine standard regions, and the nation (contiguous U.S.):
| northeast u. s. | east north central u. s. | central u. s. |
| southeast u. s. | west north central u. s. | south u. s. |
| southwest u. s. | northwest u. s. | west u. s. |
| Contiguous United States |
[top]
Contacts & Questions