|
Contents Of This Report: |

|
National Drought Overview
|
|
[top]
Detailed Drought Discussion
Overview
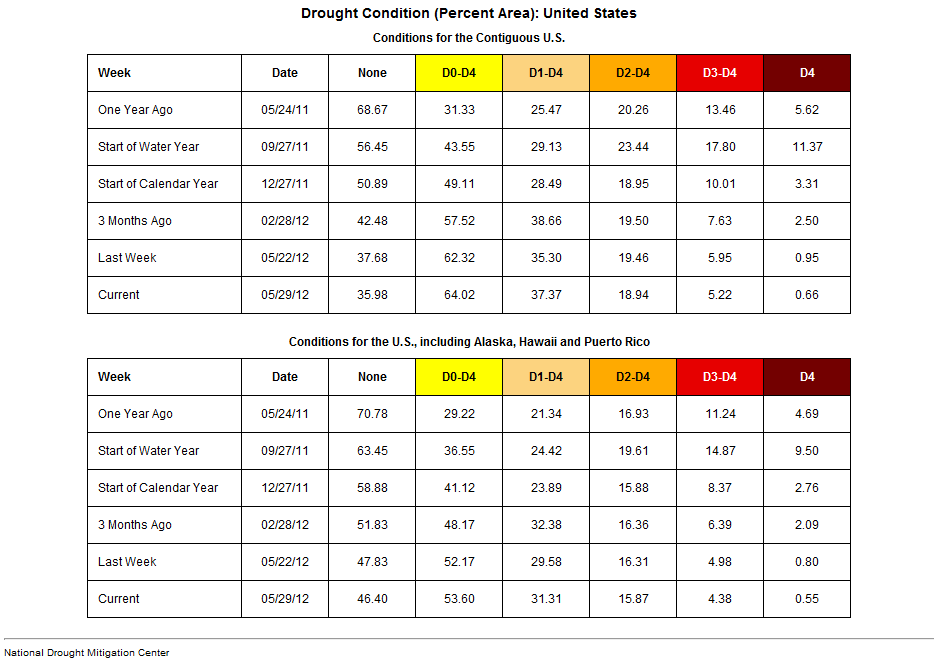
May 2012 was another warmer- and drier-than-average month (2nd warmest and 27th driest May on record, based on data back to 1895) when weather conditions are averaged across the country. Warm anomalies dominated at the monthly level and most weeks (weeks 1, 2, 3, 4, 5). Migrating fronts and low pressure systems generated precipitation along two storm tracks — one in the northern tier states and one in the southern tier states along the Gulf of Mexico — as seen in the precipitation pattern on the monthly scale as well as a weekly basis (weeks 1, 2, 3, 4, 5), with persistent dryness occurring across the interior U.S. between the tracks. Rain from Tropical Storm Beryl near the end of May brought relief from the drought in northern Florida to the coastal Carolinas, while above-normal rainfall shrank drought areas in the Northeast. Dry weather, in combination with increased evaporation caused by above-normal temperatures, expanded drought conditions in the West, Great Plains, and Mid-Mississippi Valley, while below-normal rainfall worsened drought conditions in Hawaii. Nationally, the moderate-to-exceptional (D1-D4) drought footprint decreased to about 31 percent of the country while the percentage in the abnormally dry to exceptional drought category increased to about 54 percent.

The U.S. Drought Monitor drought map valid May 29, 2012.
By the end of the month, the core drought areas in the U.S. included:
- a large area of moderate (D1) to exceptional (D4) drought in the Southeast;
- moderate to extreme (D3) drought in the Southern Plains spreading into the Southwest, with a few pockets of exceptional drought lingering in west Texas;
- moderate to extreme drought in the Southwest, with moderate to severe (D2) drought stretching to the West Coast and into the Pacific Northwest;
- pockets of moderate to severe drought lingering in the Mid-Atlantic and Northeast states, but limited to mainly along the coast;
- areas of moderate to severe drought scattered across the Midwest and Central to Northern Plains; and
- parts of the central and southern islands of Hawaii, where moderate to extreme drought persisted.
Palmer Drought Index
The Palmer drought indices measure the balance between moisture demand (evapotranspiration driven by temperature) and moisture supply (precipitation). The Palmer Z Index depicts moisture conditions for the current month, while the Palmer Hydrological Drought Index (PHDI) and Palmer Drought Severity Index (PDSI) depict the current month's cumulative moisture conditions integrated over the last several months.
|
 |
As seen on the May 2012 Palmer Z Index map, low precipitation and warm temperatures (with the accompanying increased evapotranspiration) led to short-term drought across much of the Southwest and Intermountain Basin, across the Central and Southern Plains, and into the Midwest and eastern Great Lakes this month. Wet conditions are evident on the Z Index map in scattered areas along the East Coast, Upper Mississippi Valley, and extreme northern and southern High Plains. Compared with the April 2012 PHDI map, the May 2012 PHDI map indicates that drought conditions improved in the Southeast and Upper Mississippi Valley, but intensified in parts of the West and Mid-Mississippi Valley to Midwest. The May 2012 PHDI map also reflects the long-term nature of the drought conditions. The Z Index and PHDI maps in combination show that precipitation brought relief to parts of the Southeast and Upper Mississippi Valley drought areas, but for much of the Southwest to Mid-Mississippi Valley — it was drier than normal over the existing drought areas.
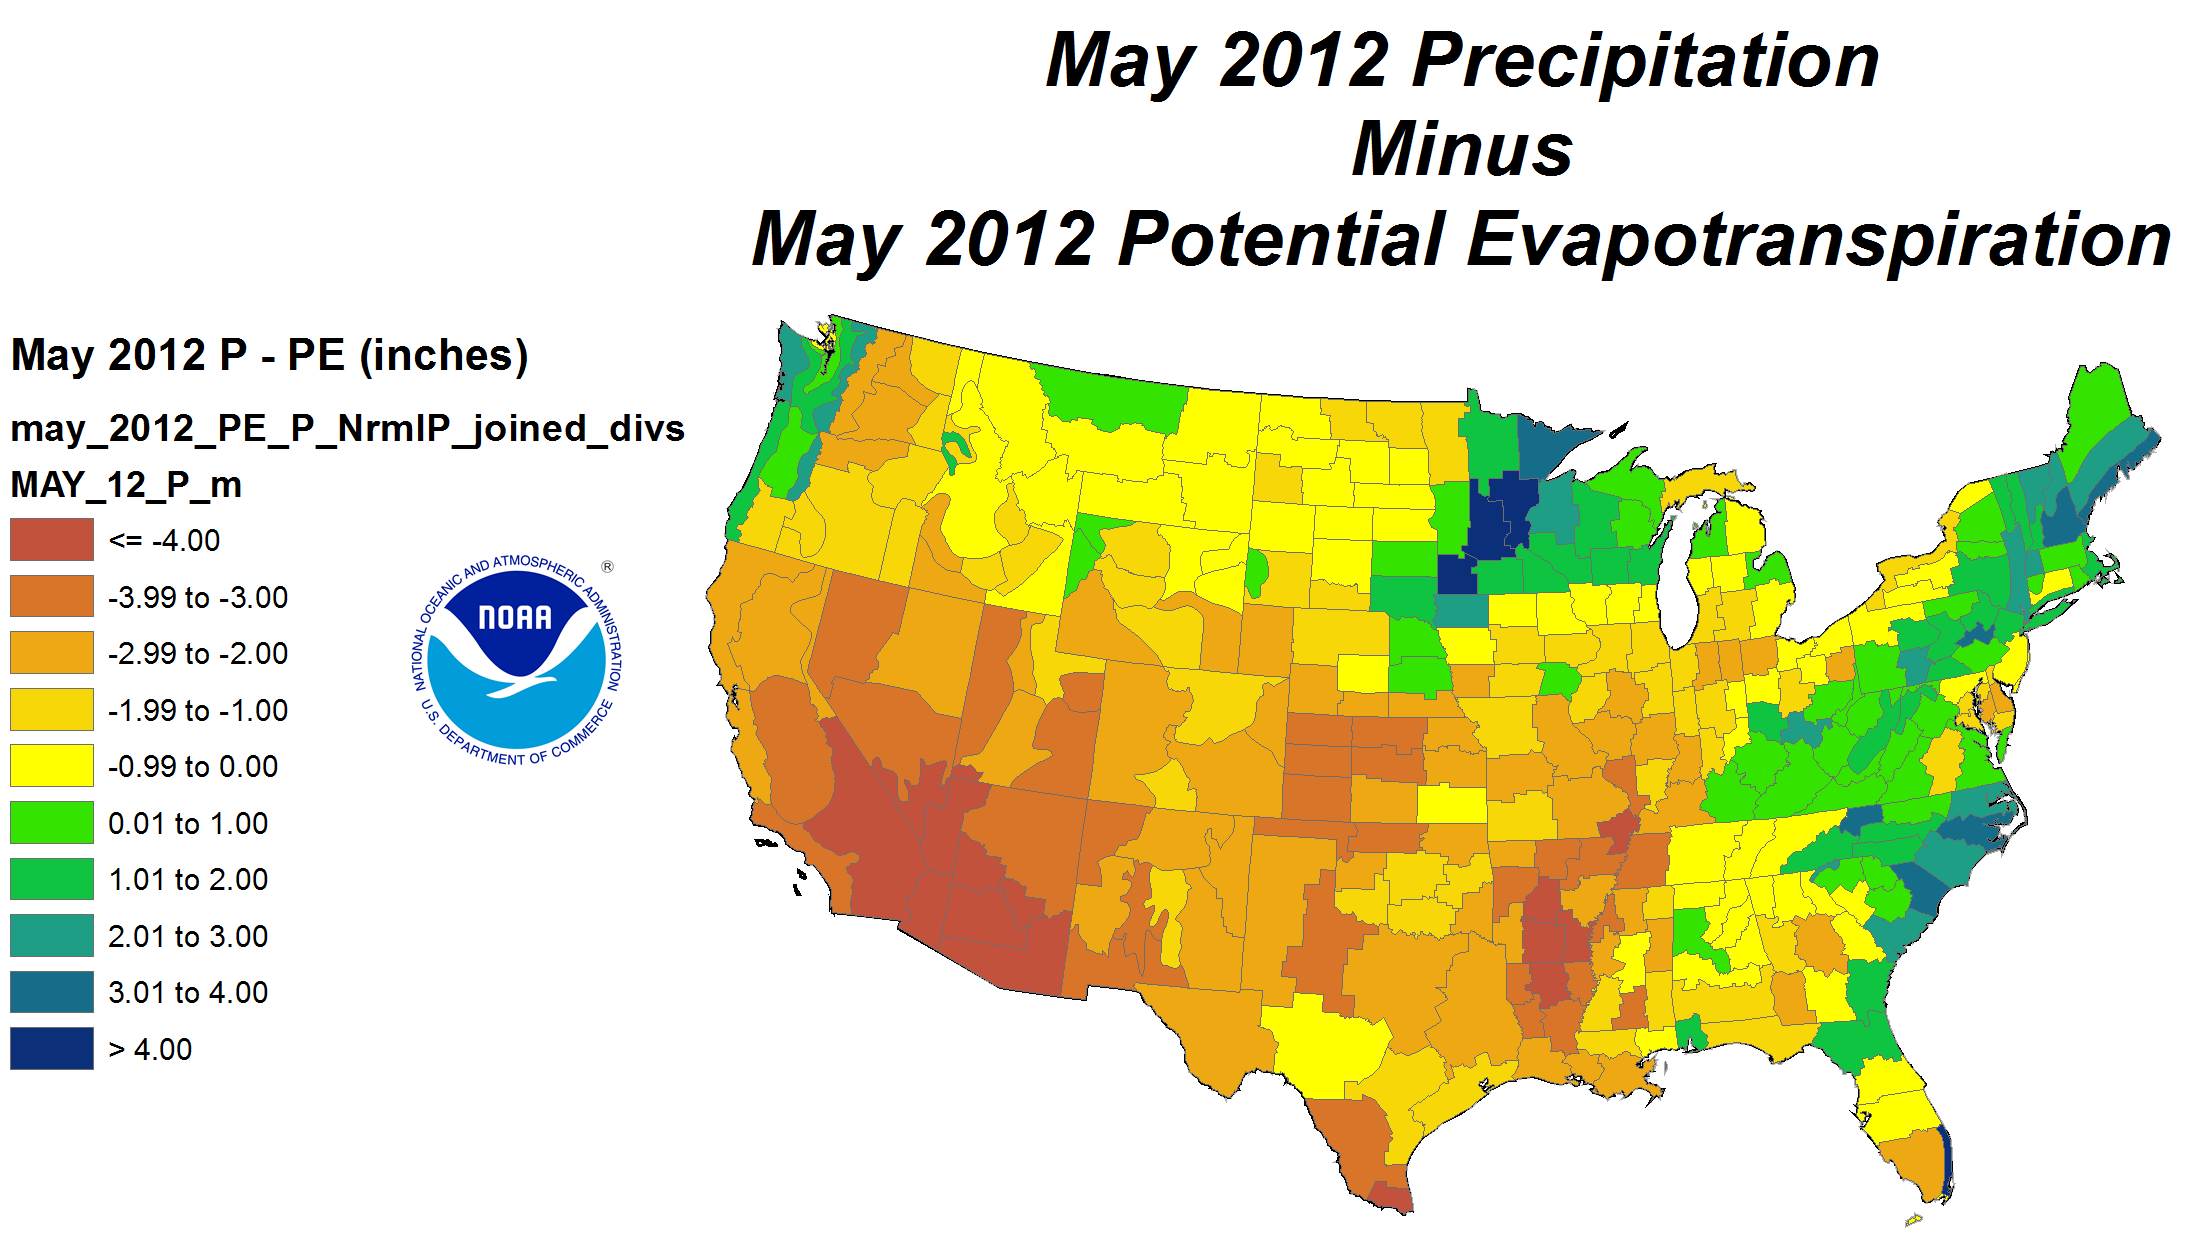
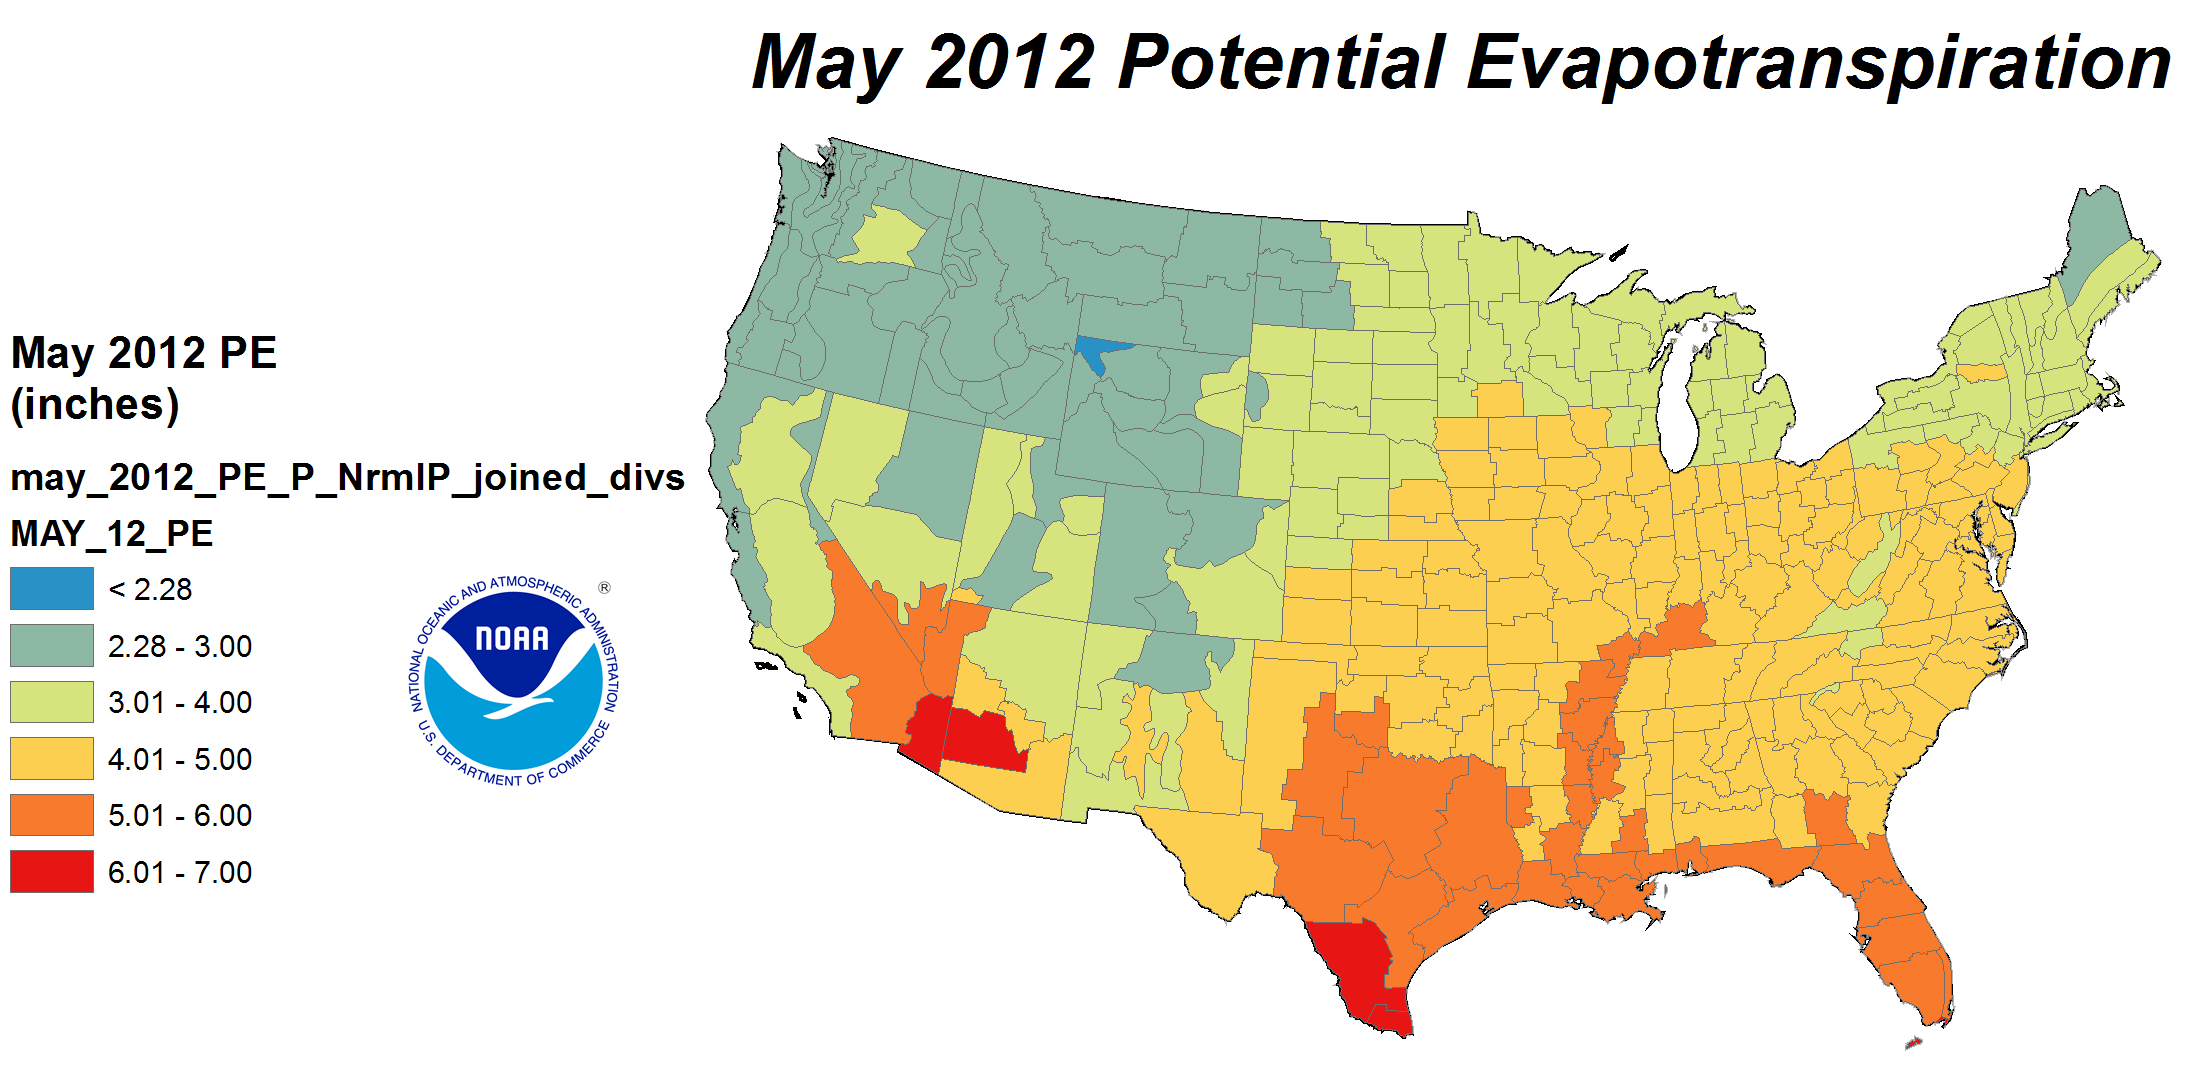
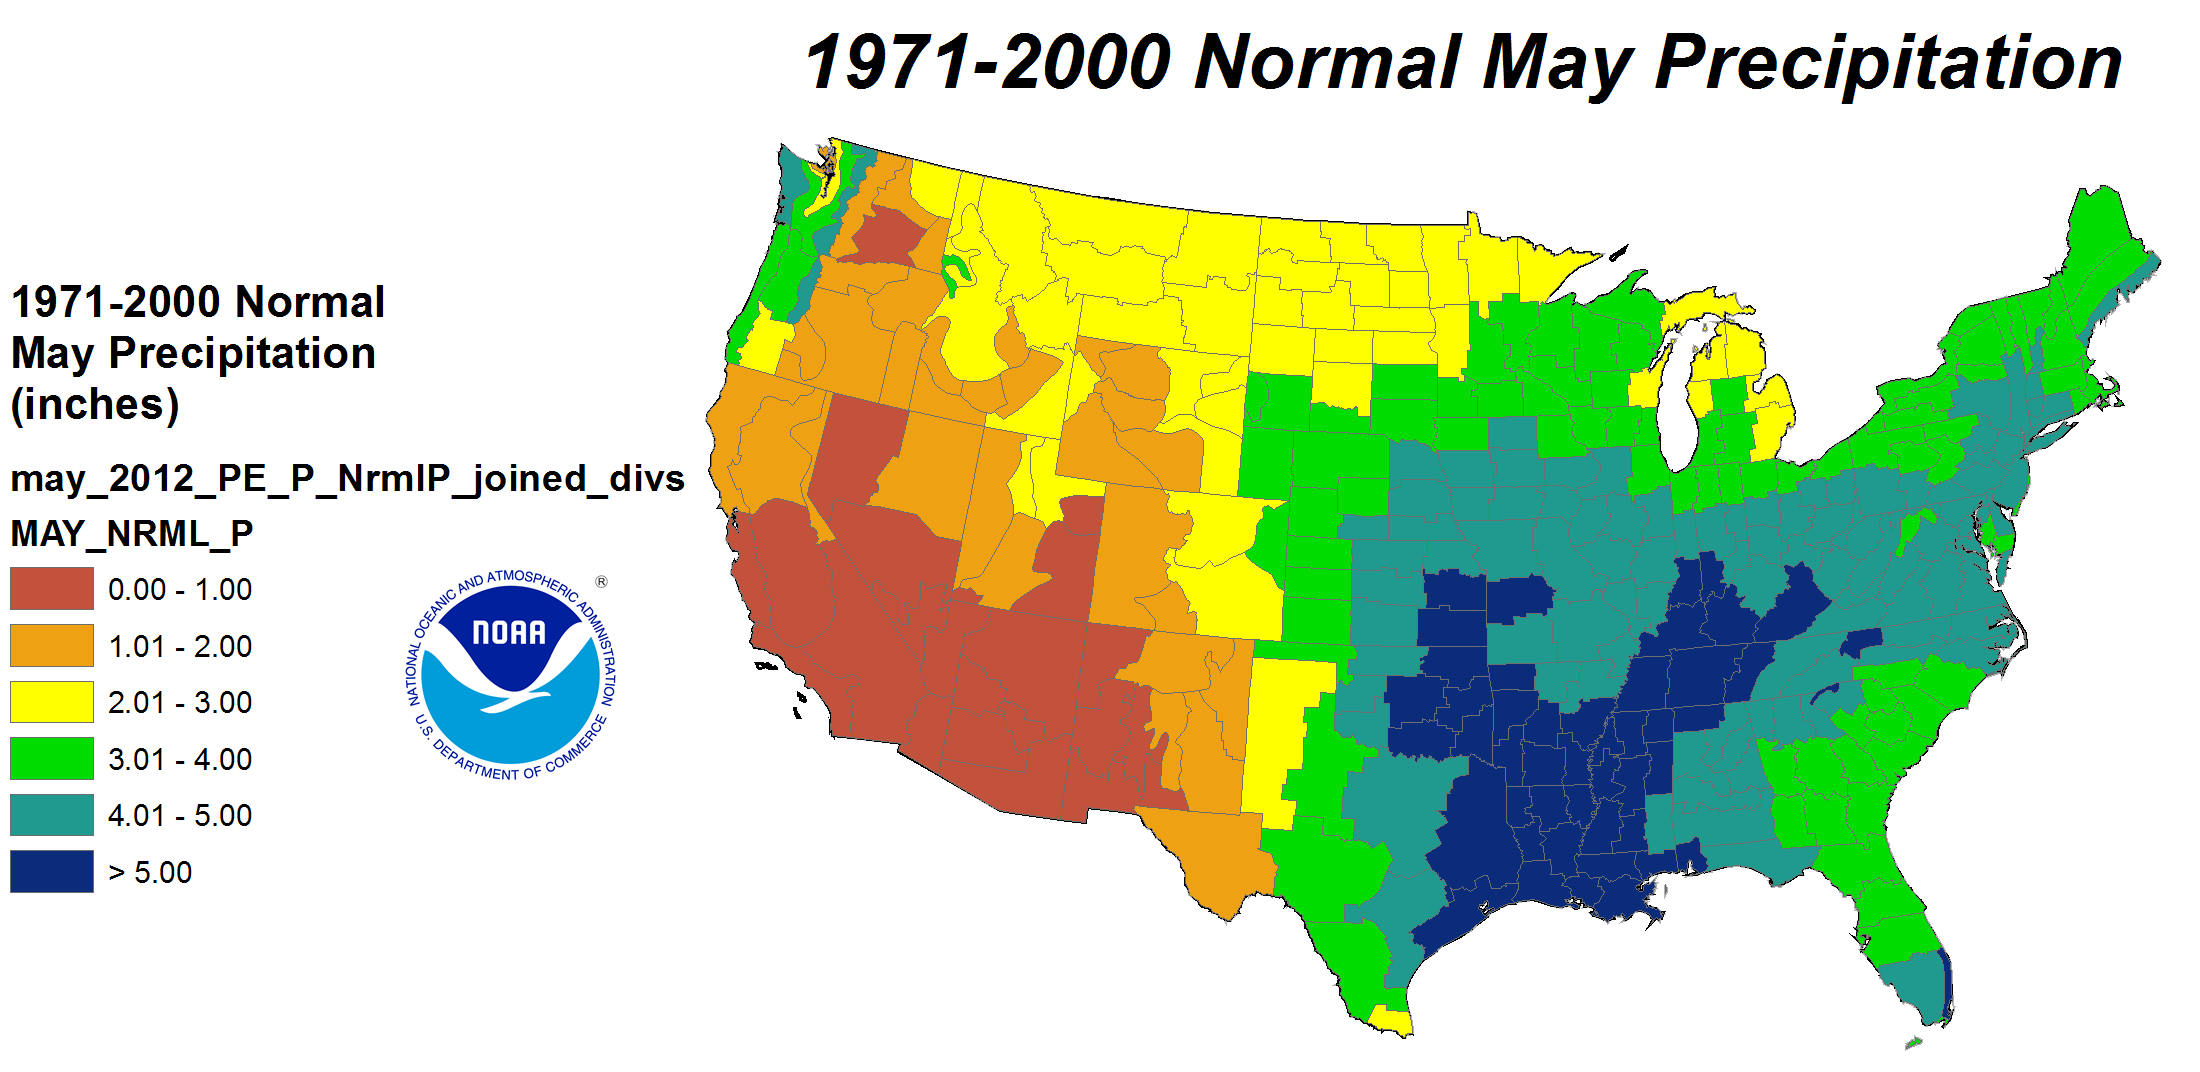
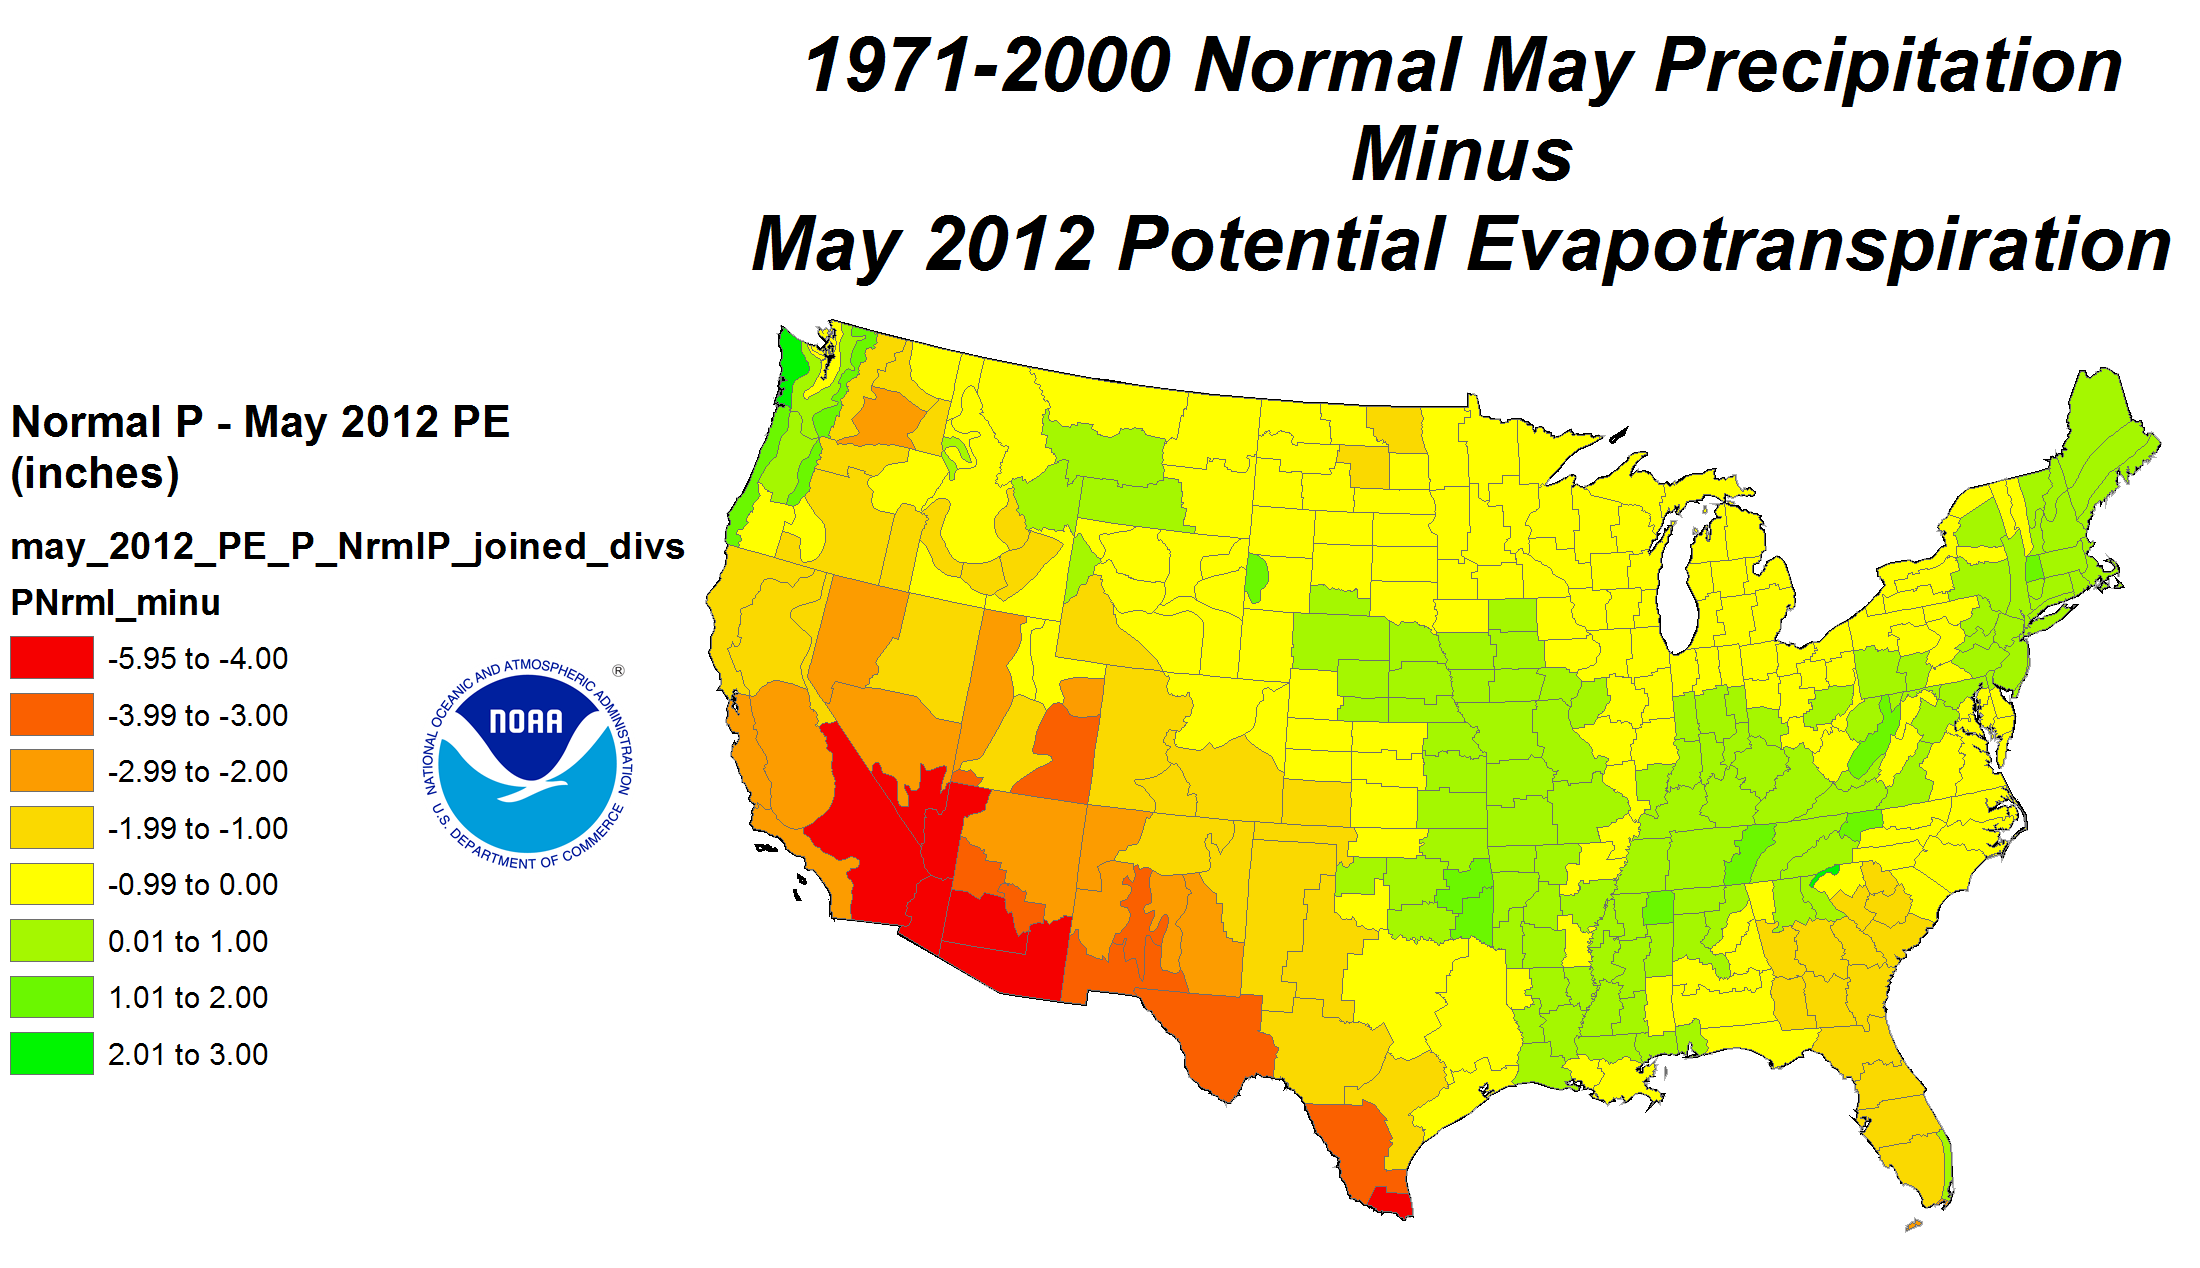
Precipitation minus Potential Evapotranspiration for May 2012 calculated using the Palmer Model.
The Palmer model assesses the supply of water versus the atmospheric demand for water by computing evapotranspiration. Precipitation is used to measure water supply, while the Thornthwaite equations are used to compute potential evapotranspiration (the amount of water that would be evaporated and transpired by plants) based on temperature. In the model, if the amount of precipitation (P) during the month is greater than the potential evapotranspiration (PET) for the month, then the leftover P soaks into the ground to recharge soil moisture, and any left over after that runs off as streamflow. If P is less than PET, then moisture has to be drawn out of the soil to meet the PET demand. Hotter temperatures result in greater PET which requires more P just to meet the greater demand. During May 2012, temperatures were much above normal across much of the country, resulting in PET values which exceeded four inches from the Southern Plains to Mid-Atlantic Coast. Precipitation amounts were well below normal — less than four inches across a large part of the Southern Plains to Midwest — resulting in P minus PET values which went strongly negative and sapped soil moisture reserves, stressed crops and other vegetation, and shrank streams. Even if normal precipitation amounts had occurred, it would not have been enough to meet PET demand in many areas.
Standardized Precipitation Index
The Standardized Precipitation Index (SPI) measures moisture supply. The SPI maps here show the spatial extent of anomalously wet and dry areas at time scales ranging from 1 month to 24 months.
 |
 |
 |
Recent precipitation (May and March) has countered dryness in the short-term (1-, 2-, 3-month SPI) along parts of the coastal Southeast drought areas, but dry conditions are evident at all time scales beginning at 2 months for the interior Southeast, and 12 months for the coast, out to 24 months. Similarly, beneficial May rains reduced the dry footprint in the Northeast to the 3- to 6-month time frames. Dryness was reasserting itself over much of the Southern Plains at the 1- and 2-month time scales, but the most severe dryness here is evident at the 12- to 24-month time scales where dry conditions stretch from the Southwest to Southeast. Parts of the Northwest and Northern Rockies have dryness indicated at the 1-, 9-, and 12-month time scales, but are generally wet from 2 to 6 months and at 24 months. The rest of the West is generally dry at all time scales from 1 to 12 months. Widespread dryness from California to the Mid-Mississippi Valley is most evident from 1 to 3 months, but is also suggested at 6 months.
 |
 |
 |
Agricultural and Hydrological Indices and Impacts
 |
 |
Drought conditions were reflected in numerous agricultural, hydrological, and other meteorological indicators, both observed and modeled:
hydrological:
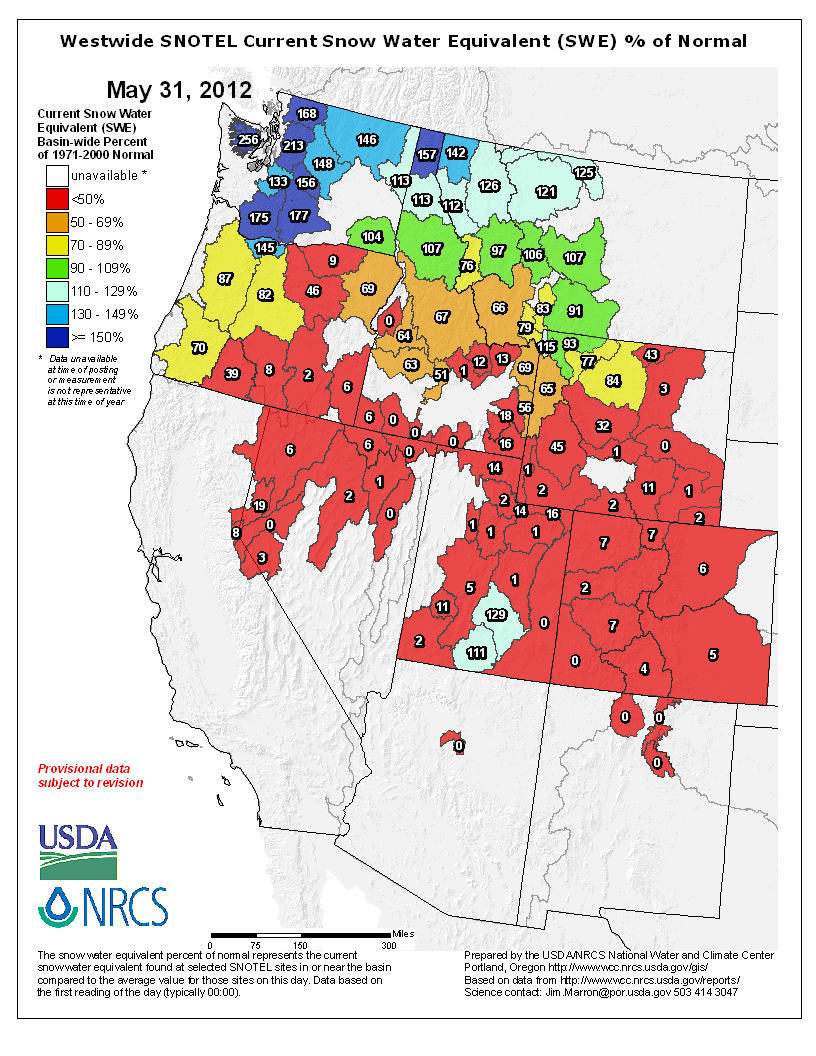
USDA western U.S. mountain snow water content anomaly map.
- USGS (U.S. Geological Service) observed streamflow;
- NOAA Climate Prediction Center (CPC) modeled runoff anomalies and percentiles;
- VIC (University of Washington Variable Infiltration Capacity macroscale hydrologic model) 1-, 2-, 3-, and 6-month and water year-to-date runoff percentiles;
- NLDAS (North American Land Data Assimilation System) modeled streamflow anomalies and percentiles;
- NLDAS model runoff anomalies and percentiles;
- USGS groundwater observations (real-time network, climate response network, total active network);
- USDA snow water content observations for the West (SNOTEL station percentiles and percent of normal, SNOTEL basin percent of normal and percent of average) and Alaska (SNOTEL station percent of normal, SNOTEL basin percent of normal);
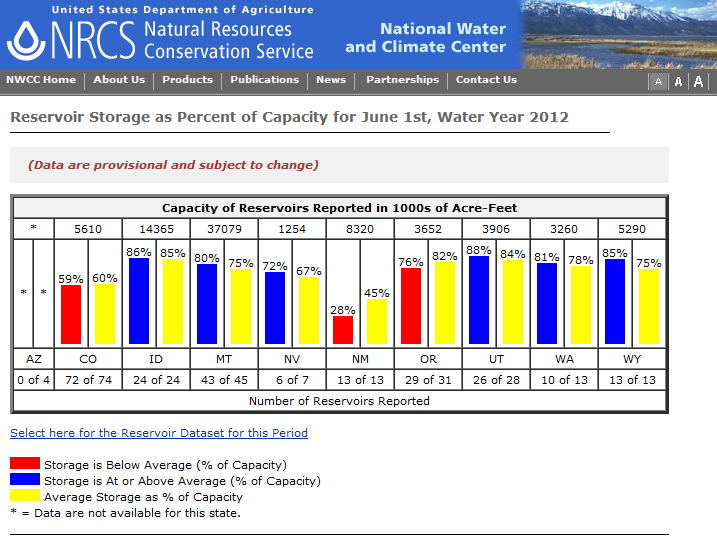
- USDA reservoir storage as percent of capacity;
agricultural:
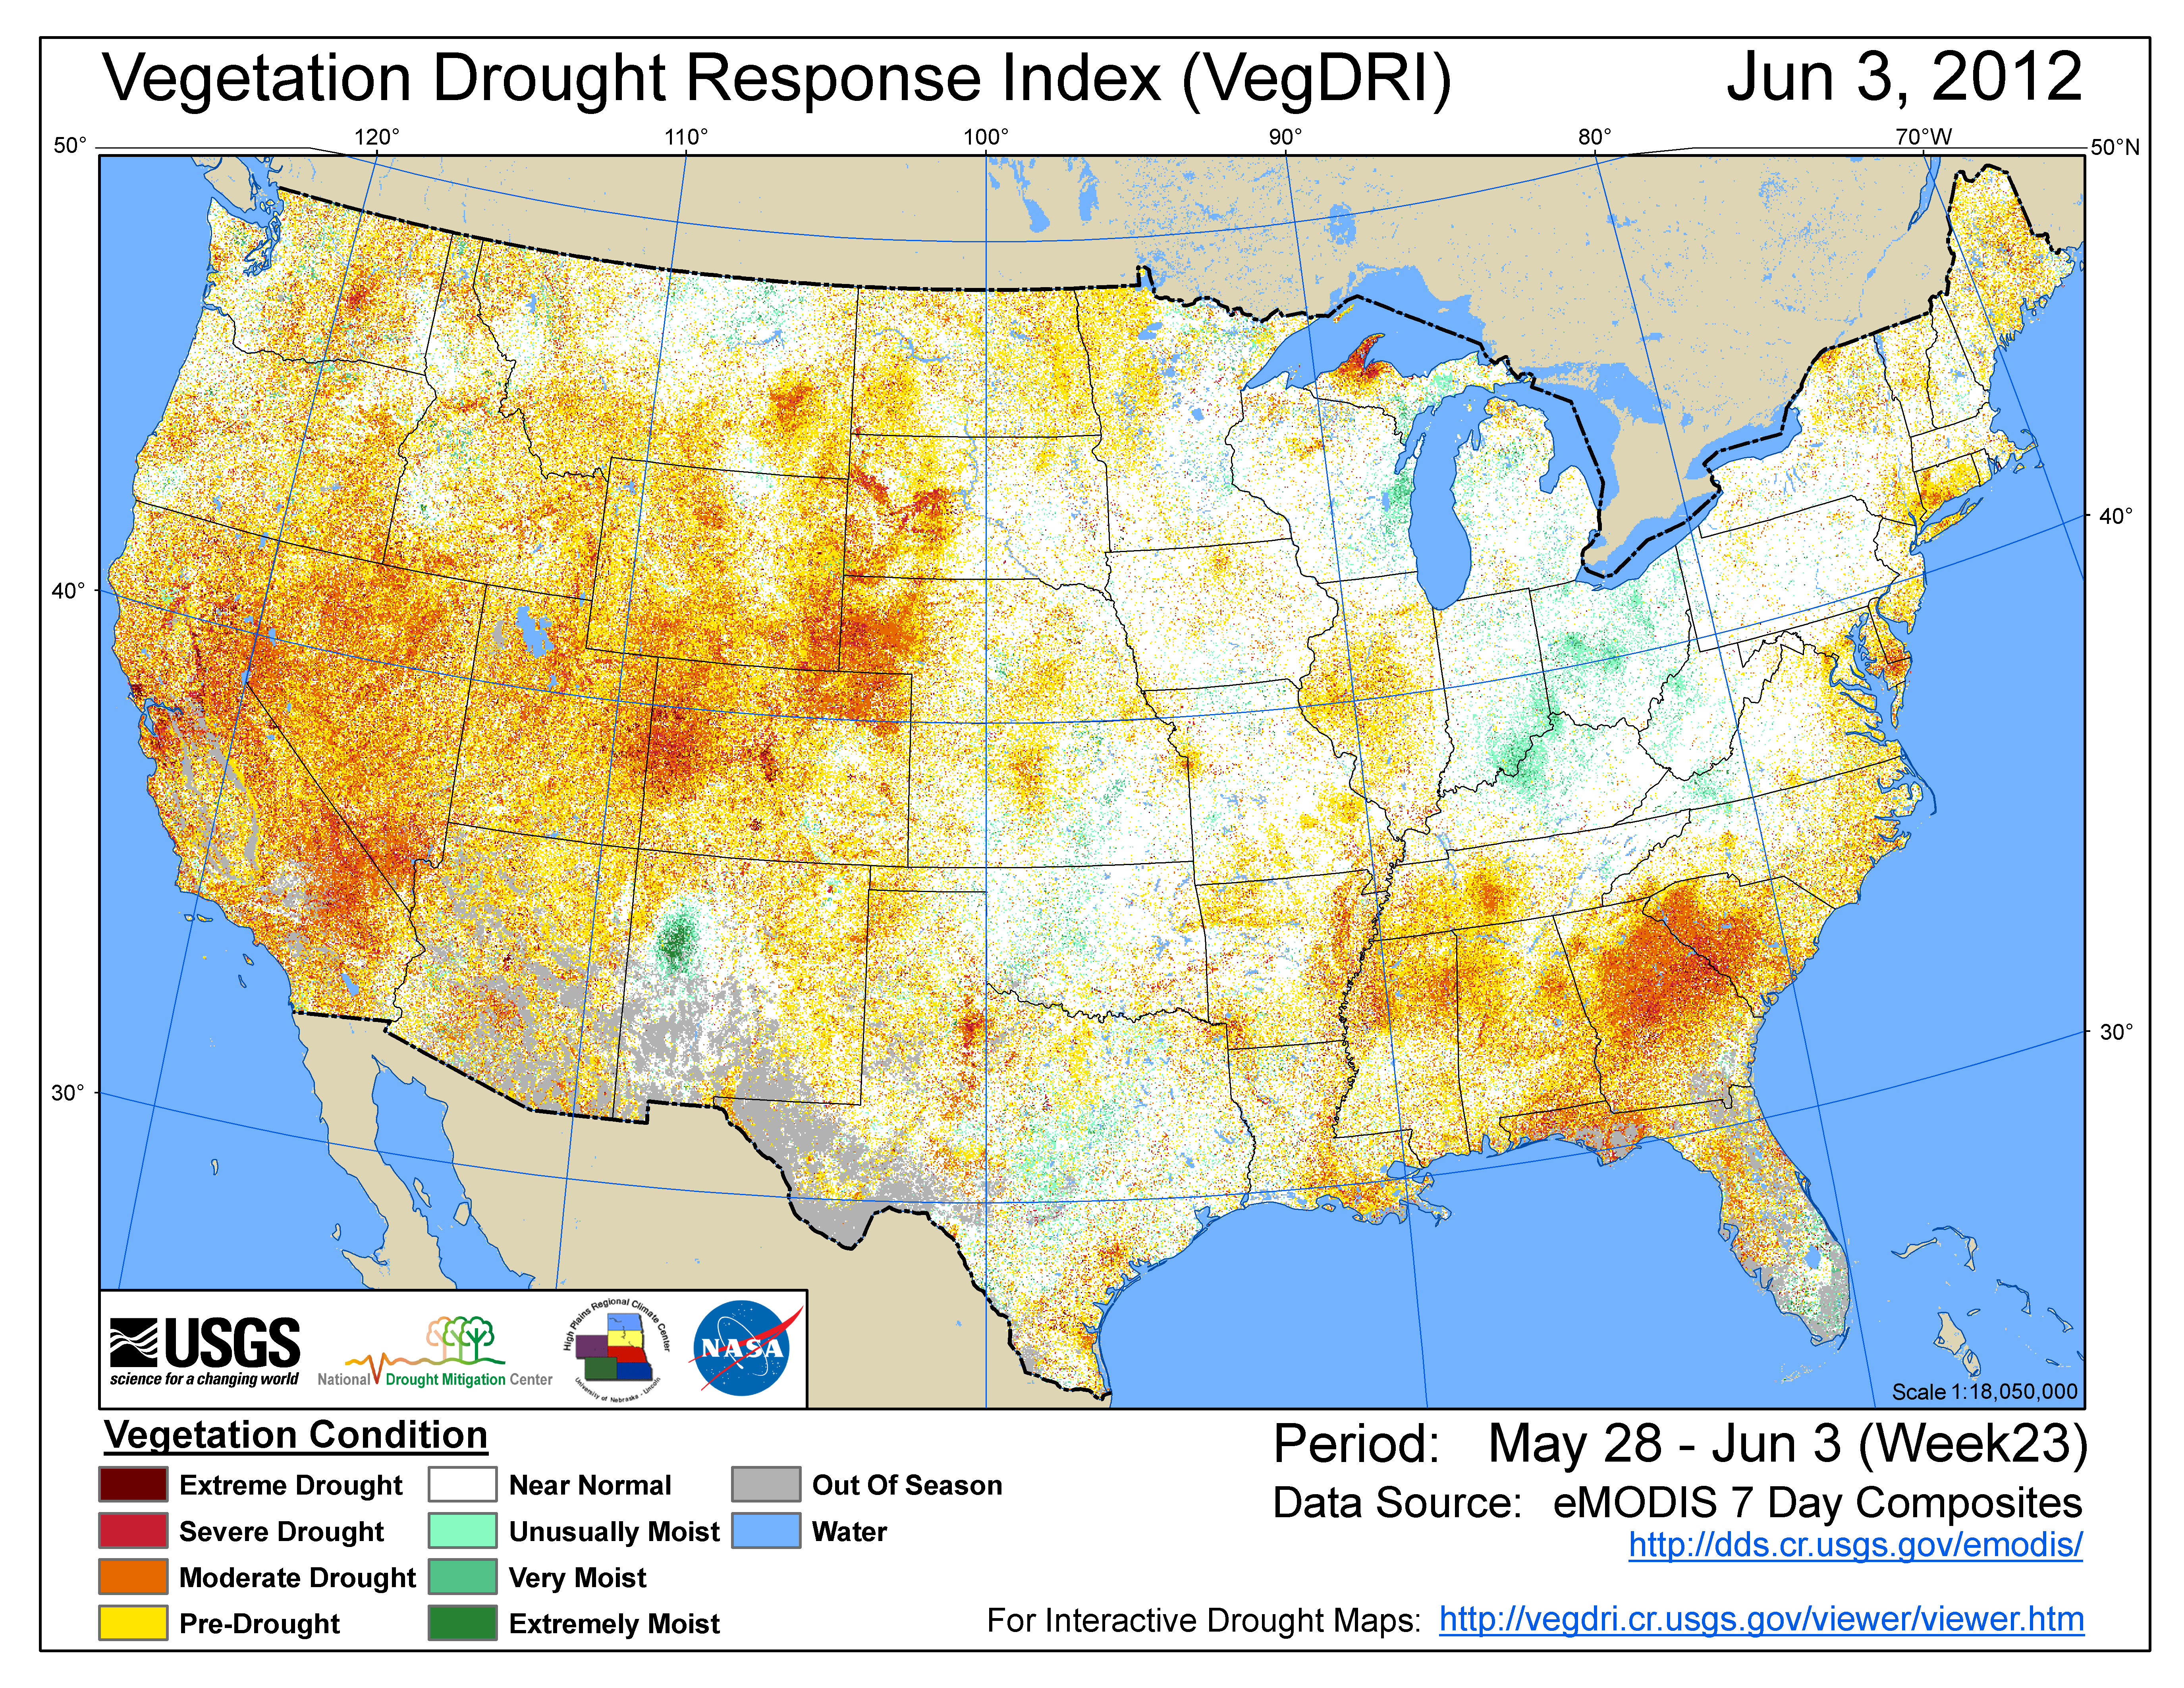
Map showing VegDRI (Vegetation Drought Response Index).
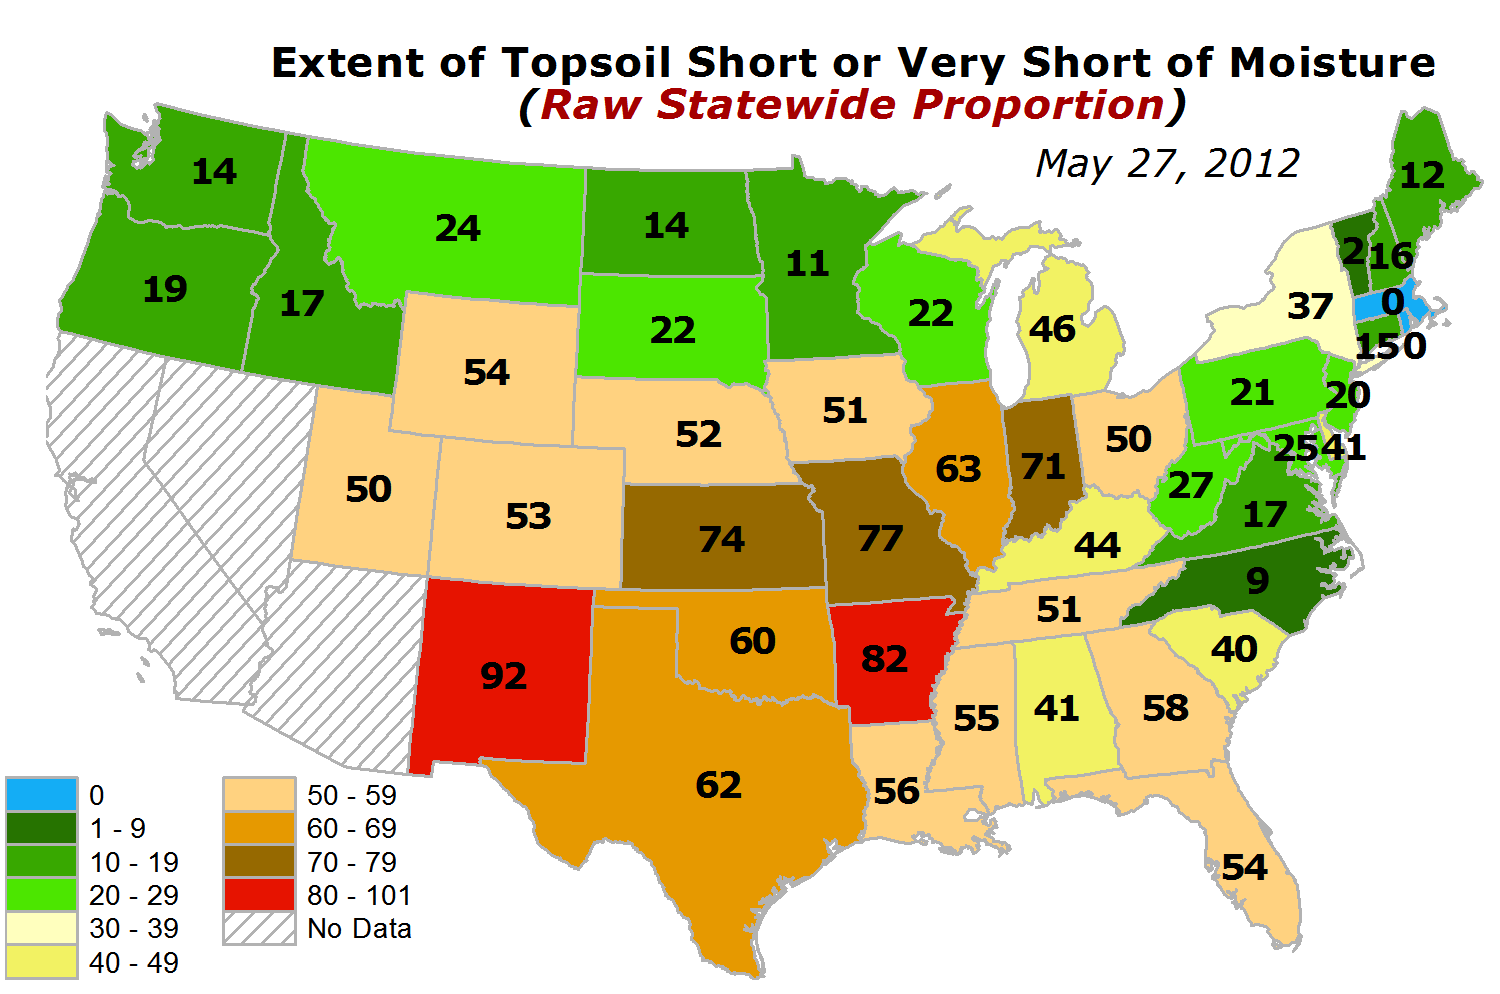
- USDA (U.S. Department of Agriculture) observed soil moisture conditions, departures and percentiles, and comparison to 5-year average and 10-year average;
- the Palmer Crop Moisture Index (CMI), which intensified during the month in the West and Lower to Mid-Mississippi Valley (weeks 1, 2, 3, 4, 5);
- CPC modeled soil moisture anomalies and percentiles for end of May, and soil moisture anomaly change compared to previous month;
- CPC's Leaky Bucket model soil moisture percentiles;
- NLDAS modeled soil moisture percentiles for the top soil layer and total soil layer;
- VIC modeled soil moisture percentiles, and soil moisture percentile change compared to previous month;
- USDA observed pasture and rangeland conditions;
- Vegetation Drought Response Index (VegDRI);
- the NOAA/NESDIS satellite-based Vegetation Health Index (VHI);
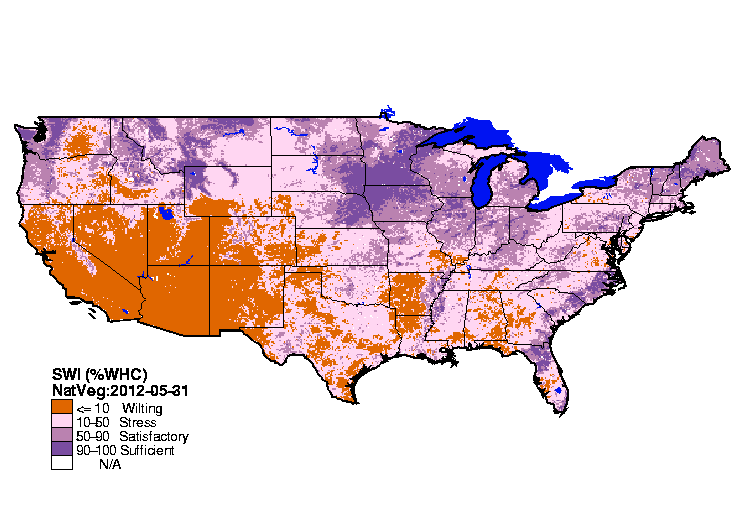
- the USGS agro-hydrologic model (Soil Water Index, Water Requirement Satisfaction Index);
meteorological:

Map showing maximum consecutive number of days with no precipitation.
- total precipitation (plotted by the USGS, NOAA National Weather Service [NWS], and NOAA High Plains Regional Climate Center [HPRCC]);
- percent of normal precipitation and precipitation percentiles (NWS, HPRCC station observations, Leaky Bucket model);
- NCDC statewide precipitation ranks;
- USGS number of days with precipitation and maximum number of consecutive dry days;
- temperature departures from normal (HPRCC) and percentiles (Leaky Bucket);
- NCDC statewide temperature ranks; and
- number of record warm daily low temperatures, record daily high temperatures, record daily low temperatures, and record cool daily high temperatures set in May 2012 (from NCDC's daily records analysis).
![NOAA National Weather Service [NWS]](/monitoring-content/sotc/drought/2012/05/noaa-nws-ahps-pcp-amt-0531-us-mtd.jpg)
Regional Discussion
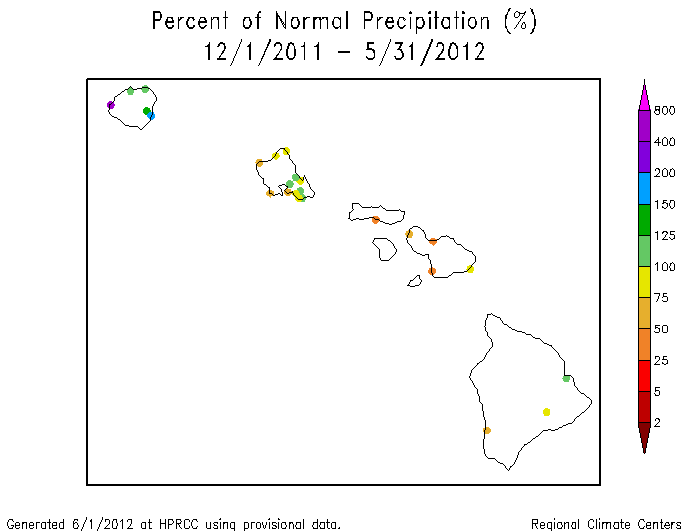
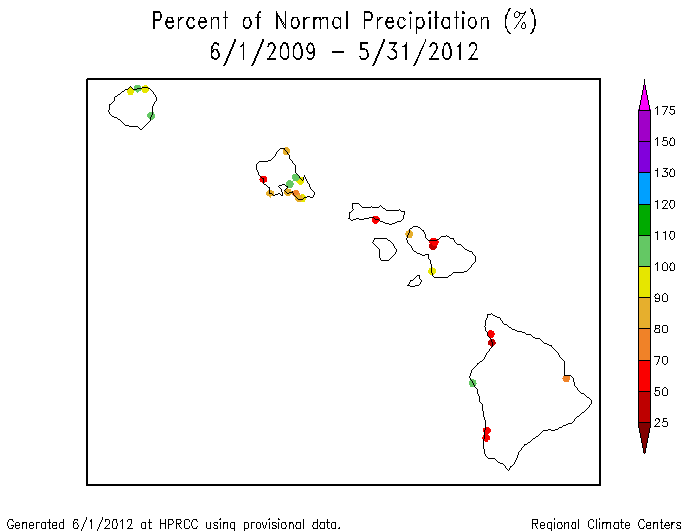
May 2012 was drier than normal for most of the stations in the Hawaiian Islands, resulting in an expansion of D1-D3 (moderate to extreme drought) and D0 (abnormally dry conditions) this month compared to last month. Longer-term conditions continued drier than normal (last 2, 3, 6, 12, 24, 36 months, year to date [January-present], and water year to date [October-present]), especially for the southern islands. As noted by the NWS, drought impacts continued in many areas.
![year to date [January-present]](/monitoring-content/sotc/drought/2012/05/hprcc-pcp-pct-0531-hi-ytd.png)
![water year to date [October-present]](/monitoring-content/sotc/drought/2012/05/hprcc-pcp-pct-0531-hi-wytd.png)
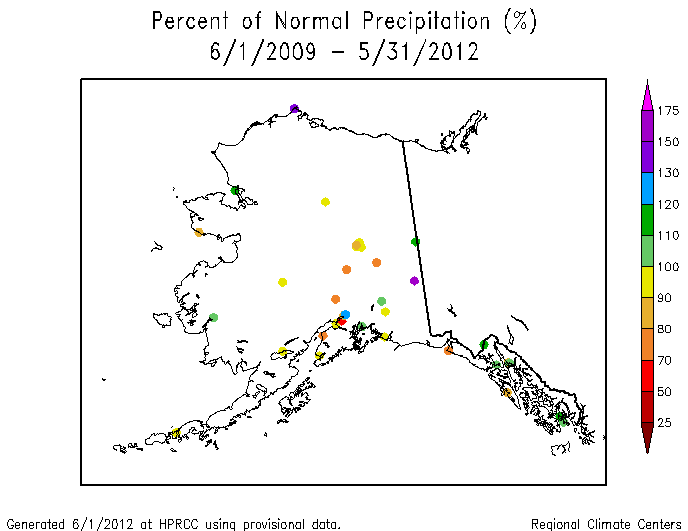
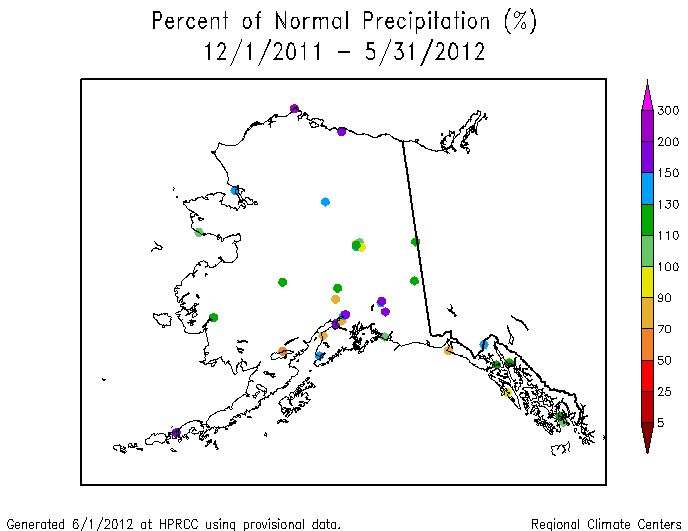
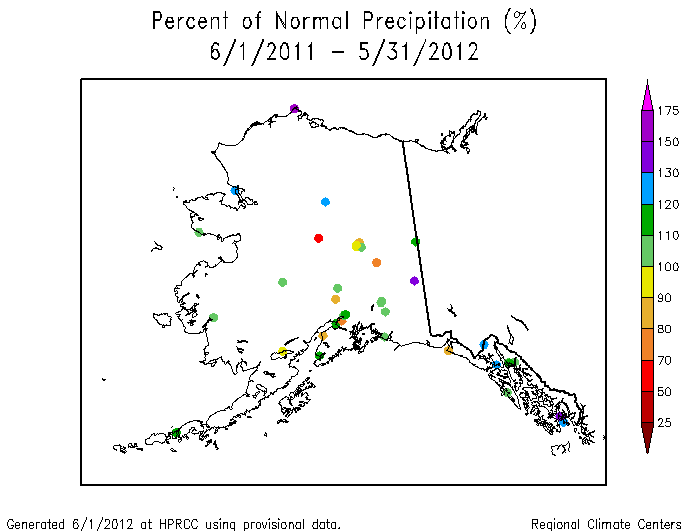
In Alaska, May 2012 was generally drier than normal in the southwest areas and wetter than normal elsewhere. Precipitation deficits are evident at some interior stations at short time scales (2 - 3 months, year to date) and at long time scales (24 and 36 months) but not at the time scales in between (6 and 12 months and water year to date). Snow water content (stations, basins) was below normal at interior locations and above normal in southern coastal locations, although this is nearing the end of the snowpack season with some interior locations having less than six inches of snow on the ground. There was no drought or abnormal dryness indicated on the May 29th USDM map.
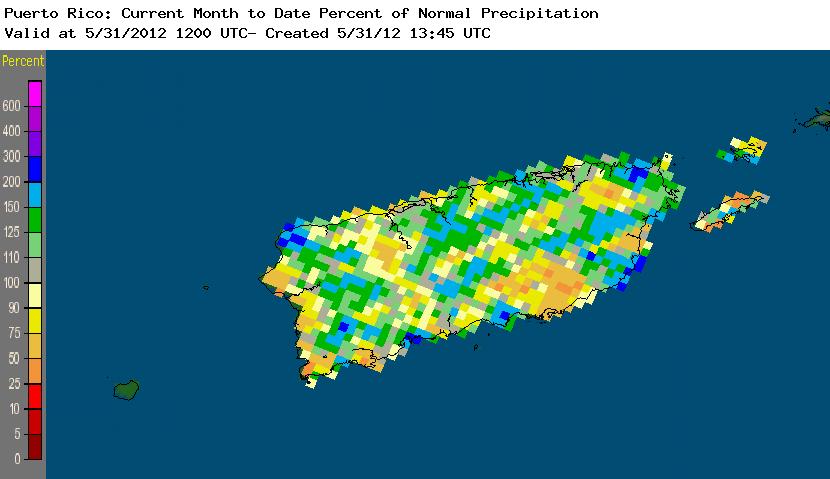
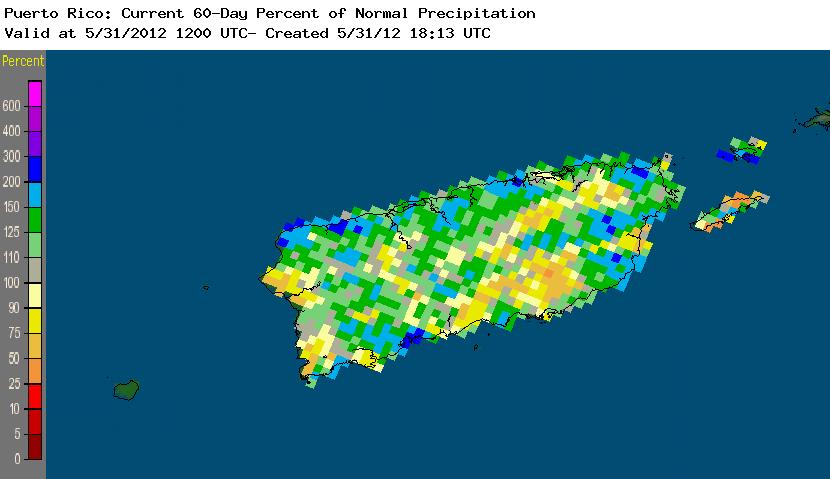
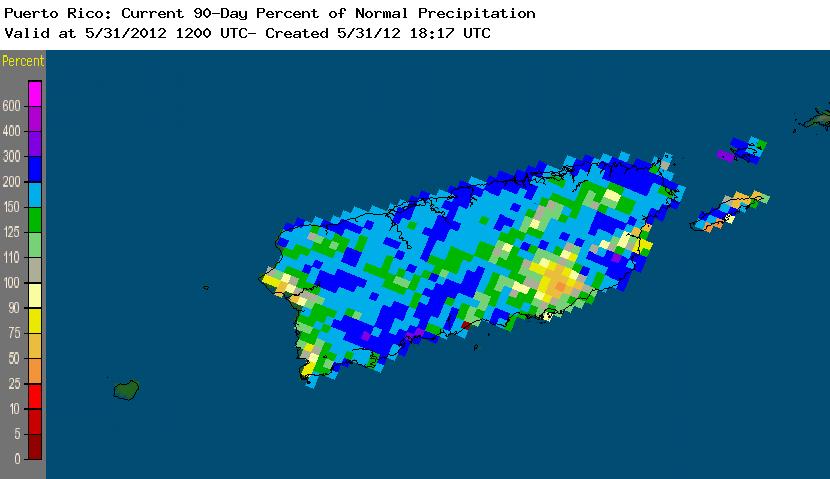
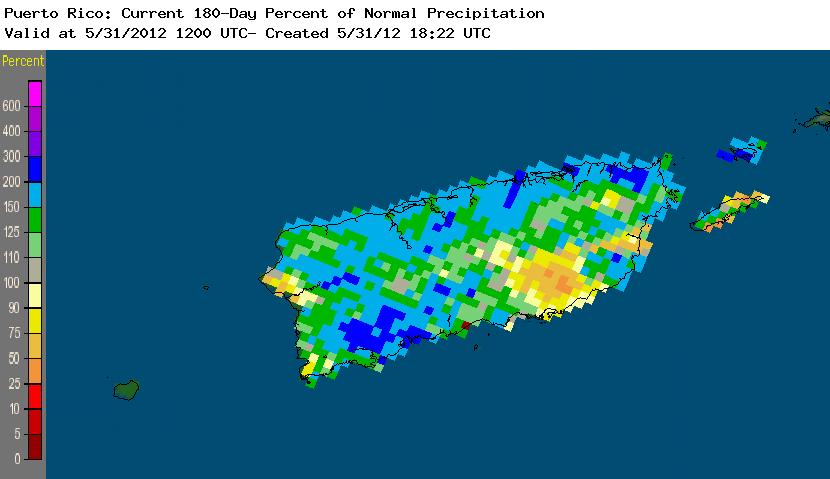
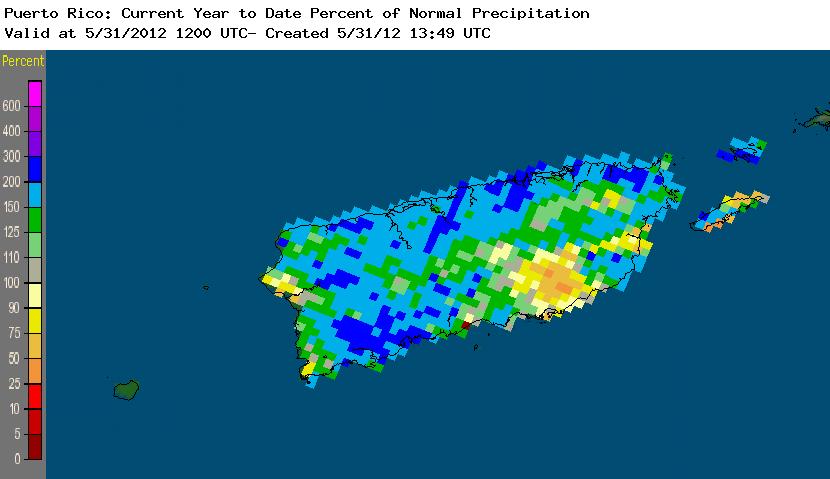
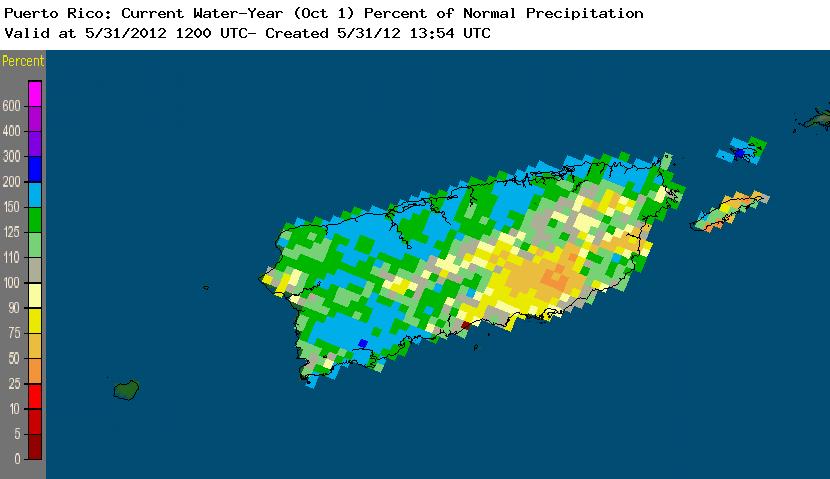
The rainfall pattern across Puerto Rico during May was generally mixed. An area of drier-than-normal conditions is evident in a small southeastern area at most time scales (2, 3, 6 months, year to date, and water year to date). With streamflow above average, the May 29th USDM map had no drought or abnormally dry areas on the island.
 |
 |
On a statewide basis, May 2012 ranked in the top ten driest Mays for two states in the West (Utah at fourth driest and Nevada at sixth driest) and three in the Central Plains to Mid-Mississippi Valley (Arkansas at second driest, Kansas at fourth driest, and Missouri at seventh driest). Eleven other states from the West to Midwest ranked in the driest third of the historical record. Two large areas of dryness stand out at the three month time scale — one centered in the Central Rockies and the other in the Ohio Valley — with a smaller area along the Mid-Atlantic to Northeast coast. Colorado (fourth driest), Wyoming (fourth driest), and Utah (fifth driest) in the West, Indiana (eighth driest) in the Midwest, and Delaware (fifth driest) in the East ranked in the top ten driest category for May, while 16 other states fell in the driest third of the historical record.
 |
 |
Dryness for the year to date is even more severe in the Mid-Atlantic to Northeast coastal area, with Delaware having the driest January-May in the 1895-2012 record and three other states ranking in the top ten driest category. Four states in the West (Arizona, Colorado, Utah, and Wyoming) turned in the tenth driest, or drier, year-to-date. Seventeen other states in the West, Midwest, Southeast, and Northeast ranked in the driest third of the historical record. If the time period is extended another month back to include December, the dryness is not as severe in the East and Midwest, but is more evident in the Far West. Five states had the tenth driest, or drier, December-May while 15 other states ranked in the driest third of the historical record. At the 12-month time scale, dryness dominates in the southern states while the Northeast is wet. June 2011-May 2012 ranked in the top ten driest category for Georgia (sixth driest) and Nevada (eighth driest). Thirteen other states ranked in the driest third of the historical record.
| Georgia had the lowest PHDI in the 1900-2012 record for May, reflecting the cumulative severity of the dryness over the last three years. But when all months of the year (not just May) are considered, the 1920s and 1950s had months with a drier PHDI. | 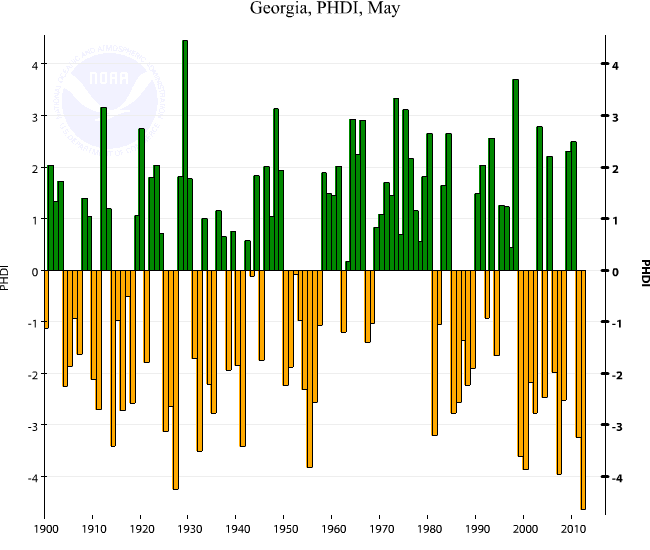 |
Percent area of the Western U.S. in moderate to extreme drought, based on the Palmer Drought Index.
With the Pacific storm track near the Canadian border and a secondary storm track along the Gulf of Mexico coast, much of the western U.S. was left with little significant precipitation this month. Drier-than-normal weather has dominated from the Southwest and intermountain basin to the Central and Southern Rockies for the water year to date (October-present), as reflected in low elevation as well as high elevation (SNOTEL) precipitation, especially for the southern half of the West. Mountain snow water equivalent (basin averages as well as station percent of normal and percentiles) were near to above normal in the Washington Cascades and extreme Northern Rockies, but elsewhere conditions were drier. Low precipitation as well as above-normal temperatures, which accelerated melting, contributed to the low snowpack, especially in the southern areas. Mountain snowpack is a crucial water supply during the following melt season. Fortunately, the reservoirs in most states were near to above normal, with New Mexico and Oregon averaging below normal statewide. According to the USDM, 53 percent of the West was experiencing moderate to exceptional drought at the end of May, an 8 percent increase compared to April. The Palmer Drought Index statistic was about 56 percent, reflecting a remarkable rise over the last five months.
A more detailed drought discussion, provided by the NOAA Regional Climate Centers and others, can be found below.
West — Upper Colorado River Basin — Pacific Islands
As noted by the Southeast Regional Climate Center, mean temperatures in May were generally above average across the Southeast region while monthly precipitation totals were variable. Much of this variability was due to the passage of Tropical Storm Beryl, which dropped between 2 and 7 inches (50.8 and 177.8 mm) of rain across large parts of northeast Florida and eastern sections of Georgia, the Carolinas, and extreme southeastern Virginia, and as much as 10 inches (254 mm) of rain across central portions of the Florida Panhandle, from the 28th to the 31st of the month. This contributed to monthly precipitation totals that ranged between 150 and 300 percent of normal. In addition, several locations across central North Carolina and Virginia, southern Alabama, and south Florida also exhibited above normal precipitation for the month. Conversely, much of the interior of the Southeast remained dry in May, with monthly precipitation generally less than 50 percent of normal. Monthly precipitation was near normal across most of Puerto Rico and the U.S. Virgin Islands.
The rainfall from Tropical Storm Beryl helped alleviate drought conditions across eastern sections of the Southeast. Improvements of one to two drought categories in the USDM were noted across parts of the Florida Panhandle, southeastern Georgia, and the coastal plain of the Carolinas. Although the rainfall from Beryl helped extinguish several fires across northern Florida, an estimated 60 fires were still active across 10,000 acres (40.5 sq km) of the state at the end of the month. Crop damage due to hail was reported across several counties in Georgia, including several hundreds of acres of watermelon and other crops that were approaching harvest. The warm, dry weather that persisted across much of the Southeast this spring resulted in reduced wheat yields across Florida, while peach volumes were down between 25 and 35 percent across Georgia due to a lack of accumulated chill hours. On the other hand, several vegetable and commodity crops were able to ship early due to favorable weather conditions.
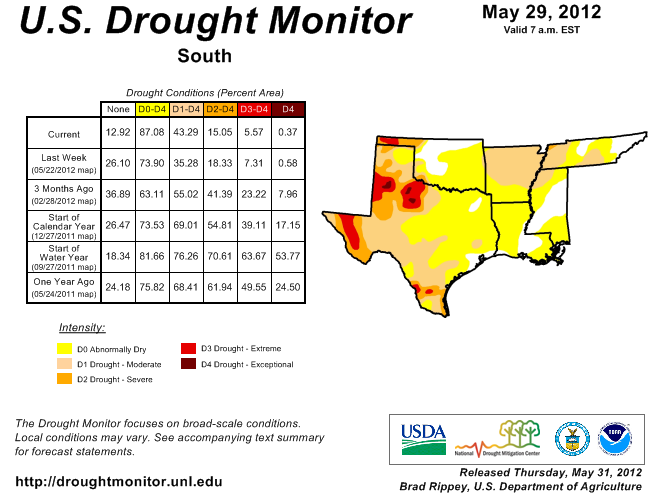
As explained by the Southern Regional Climate Center, as was the case in the past few months, the Southern region experienced yet another warmer than normal month in May. With the exception of southwestern Texas, May 2012 was a rather dry month for the bulk of the region. Precipitation was scarce in the central portions of the region where most stations recorded less than one fourth of the normal monthly totals. This was also the case for most of the Texas and Oklahoma panhandle region. Elsewhere, values ranged mostly between twenty-five and fifty percent of normal. Southwestern Texas was the only portion of the region that observed above normal rainfall, with precipitation totals ranging from one and one half to four times of normal. Despite that, Texas' statewide precipitation average was slightly on the dry side with a total of 2.81 inches (71.37 mm). Arkansas, Oklahoma and Louisiana had the highest statewide precipitation rankings. For Oklahoma, which received a total of 2.33 inches (59.18 mm), it was the eleventh driest May on record (1895-2012). It was the second driest May on record in Arkansas, which saw only 1.63 inches (41.40 mm) of precipitation. Louisiana averaged 2.26 inches (57.40 mm) of precipitation, which makes it their fifteenth driest May on record (1895-2012). For Mississippi, it was the thirty-third driest May on record, which is based on a statewide precipitation total of 3.05 inches (77.47 mm). Lastly, Tennessee experienced its twenty-eighth driest May on record, with a statewide precipitation total of 3.26 inches (82.80 mm).
Consistent dryness over much of the Southern region has led to an expansion of drought in some areas, while above average precipitation has led to improvements in other areas. In the case of the latter, high precipitation in southwestern Texas has led to the removal of all exception drought in that portion of the state. Though moderate drought remains, this is a significant improvement over last month, where most of the area was riddled with severe to extreme drought. In northern Arkansas, where precipitation was below normal for much of the month, there has been an introduction of moderate drought. This also includes portions of northeastern Mississippi and western Tennessee, where conditions were also drier than normal over the past several weeks.
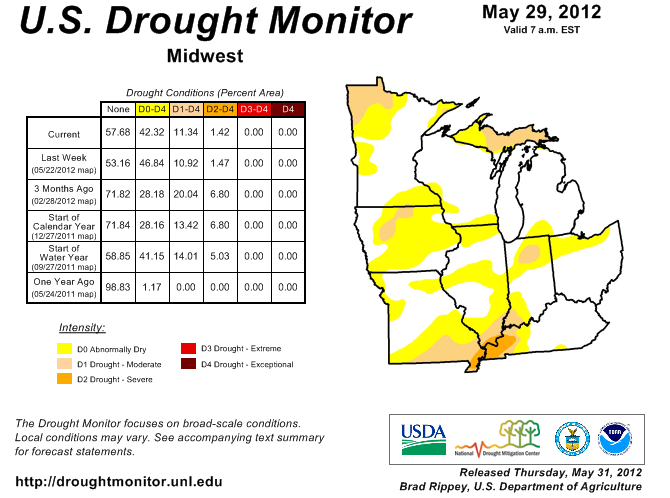
As summarized by the Midwest Regional Climate Center, May precipitation varied with much of the northern third of the Midwest recording above normal precipitation including a large swath of Minnesota that received two to three times normal. The southeast parts of the Midwest were close to normal while much of Missouri, Illinois, Indiana, southern Michigan, and southeast Iowa received only 25 to 75 percent of normal. Spring precipitation was also heaviest across Minnesota with totals ranging from 150 to 200 percent of normal. The driest areas for spring extended from northwest Ohio into Illinois. May temperatures were above normal across the Midwest, with all nine Midwest states recording above-normal temperatures for the last seven months or more.
Drought in Minnesota and northwest Iowa eased with May rains running two to three times normal. Other Midwest locations saw drought worsen as lack of rain, combined with enhanced evapotranspiration, dried out the upper soil layers. Drought conditions worsened in northwest Minnesota and for most of the southern two-thirds of the Midwest. Severe Drought was limited to western Kentucky, extreme southern Illinois, and the boot heel of Missouri but many areas saw drying of the topsoil, stressed plants, and dry lawns as concerns increased about the potential for drought to rapidly worsen. The many days of dry conditions in the Midwest allowed farmers to spend more time in the fields, thus corn and soybean planting was running ahead of normal. With much of the crop in the ground by the end of the month, farmers were hoping for adequate rains to replenish soil moisture and supply needed water to stressed plants going into the hot summer months.
As noted by the Northeast Regional Climate Center, May 2012 was the 14th consecutive warmer-than-normal month in the Northeast, with each of the states averaging on the warm side of normal. It was the warmest May since 1991 for the region and the 5th warmest since 1895. Temperature averages for the spring (March-May) of 2012 were also above normal.
After three months of below normal precipitation totals, the Northeast averaged 118 percent of normal in May. Precipitation was not evenly distributed — New Hampshire's total was 157 percent of normal, while Delaware's was only 49 percent of May's normal monthly total. For the 118 years of record, New Hampshire ranked 7th wettest, Vermont 9th, and Pennsylvania, 22nd, while Delaware ranked 24th driest. Spring 2012 precipitation totals averaged below normal in the Northeast (91 percent) and in nine of the twelve states in the region. March through May departures among the drier-than-normal states ranged from 56 percent in Delaware to 98 percent in New Hampshire. State and regional precipitation totals for the January through May time period were all below normal. The Northeast average was 87 percent of normal and state departures ranged from 97 percent in West Virginia to 49 percent in Delaware. It was the driest January through May since 1895 in Delaware, the 3rd driest in Connecticut, the 6th driest in Maryland, and the 10th driest in New Jersey.
Rainfall during the month resulted in fewer areas of abnormally dry (D0), moderate drought (D1) and severe drought (D2) in the region. The May 29th USDM still had moderate (D1) and severe (D2) drought in Delaware, with pockets of D1 drought in Connecticut, Maryland and Massachusetts. New Jersey, most of New Hampshire and southeastern Maine improved from D1 drought to D0 at month's end.
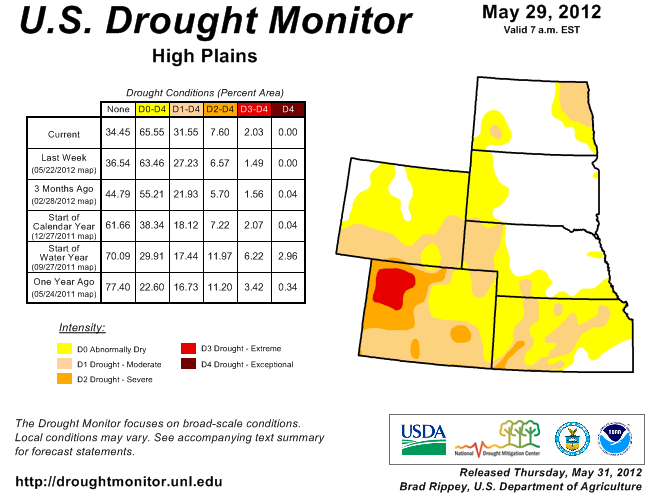
As explained by the High Plains Regional Climate Center, May 2012 was largely warm and dry across the High Plains region. The largest temperature departures occurred in southern portions of the region, where the departures from normal temperature ranged from 4.0-8.0 degrees F (2.2-4.4 degrees C) above normal. The only areas in the region to have lower than normal temperatures were central and western North Dakota and pockets of Wyoming and South Dakota. Many locations across the region were ranked in the top 10 warmest Mays on record. This spring (March, April, and May) was a record breaker across the entire High Plains region. Average temperatures were above normal at all locations in the region and the largest temperature departures occurred in the east as areas of South Dakota, Nebraska, and Kansas had average temperatures which were over 8.0 degrees F (4.4 degrees C) above normal.
May 2012 was dry for much of the High Plains region. A large area encompassing southern Wyoming, western and southern Nebraska, northern and western Kansas, and the east and west sides of Colorado had precipitation totals which were less than 50 percent of normal. In addition, many locations within that area received only 25 percent or less of normal precipitation and ranked in the top 10 driest Mays on record. Goodland, Kansas had its second driest May on record with only 0.45 inch (11 mm) of precipitation, which was 13 percent of normal precipitation (period of record 1895-2012). The 1927 record held at 0.31 inch (8 mm). Snowpack in Colorado and Wyoming continued to decline. According to the Natural Resources Conservation Service, by the end of the month, the statewide snowpack was just 5 percent of average in Colorado and 22 percent of average in Wyoming. According to the Denver Post, the low snowpack has raised concerns about potential impacts on river recreation in Colorado. Although the majority of the region was drier than normal, a few areas had above normal precipitation totals including eastern South Dakota, northeastern Nebraska, south-central Colorado, and a few pockets of North Dakota and Wyoming.
Spring (March, April, and May) precipitation and snowfall totals were some of the lowest on record in the western part of the High Plains region. A large area of the region had precipitation totals which were 25-50 percent of normal including southern Wyoming, the panhandle of Nebraska, and western and northern Colorado. Some examples of the dryness include Cheyenne, Wyoming and Boulder, Colorado. Cheyenne had its second driest spring on record with only 0.69 inch (18 mm) of liquid equivalent precipitation. This was not far off from the record 0.67 inch (17 mm) which was set in the spring of 1880 (period of record 1871-2012). In addition, Cheyenne had its least snowy spring on record with only 0.6 inch (2 cm) of snowfall. This beat the old record of 3.5 inches (9 cm) which occurred in 2007 (snowfall period of record 1883-2012). Similarly, Boulder, Colorado had its third driest spring with 3.10 inches (79 mm) of precipitation. The record 2.21 inches (56 mm) which fell in 1925 was able to hold on (period of record 1893-2012). Boulder also had its least snowy spring on record with a mere 1.6 inches (4 cm) of snowfall. This easily beat the old record of 3.5 inches (9 cm) which fell in 1982 and was incredibly lower than the average spring snowfall, which in Boulder is 29.5 inches (75 cm).
According to the National Agricultural Statistics Service, the earliest start to the wheat harvest in Kansas since records began in 1952 occurred this year. By the end of the month, at least 4 percent of the wheat harvest was complete. The earliest harvest prior to this year occurred in 1962 when 1 percent of the crop had been harvested by June 2nd. The dry, hot, and windy weather in Nebraska led to low soil moisture which caused producers to turn on pivots to aid in crop germination.
There were many changes again to the USDM this month. Improvements were made in eastern South Dakota and Nebraska as drought conditions were eliminated due to ample precipitation. Only small areas of abnormally dry conditions (D0) remained there. Moderate drought conditions (D1) were erased from western South Dakota and the majority of western North Dakota as well. Unfortunately, drought conditions elsewhere either emerged or worsened over the course of the month. D1 conditions in eastern North Dakota expanded towards the south. New D0 and patches of D1 emerged across Kansas. D1 conditions also expanded further across southern Colorado and also across the panhandle of Nebraska and into southern Wyoming and northwestern Colorado. The big story this month was the development of extreme drought conditions (D3) in northwestern Colorado due to extremely low precipitation.
As summarized by the Western Regional Climate Center, May is typically a month in which temperatures increase and precipitation totals have begun to wane in the coastal and southern West as the Pacific storm track edges northward and the Southwest Monsoon system has yet to develop. May 2012 showed few exceptions to this trend. Many Southwest locations received no precipitation at all, and only a smattering of stations in the Northwest and along the Mexico border recorded average to above-average precipitation. The northern tier of the region experienced cooler than normal average temperatures this month, while in the Southwest, average temperatures were generally above the May mean. Critical fire conditions (low relative humidity, high wind, drought conditions) dominated the Southwest, leading to the rapid development of several large wild land fires and New Mexico experiencing its largest fire on record.
Many locations the Southwest were dry this month, not uncommon in past Mays. For the 31st time in the last 75 years, Las Vegas, Nevada received no measureable precipitation (less than 0.01 in / 0.25 mm) in May. Further west, Santa Barbara, California has 25 years in its 71-year record with no measurable May precipitation. Other zero-precipitation locations this month include Yuma and Flagstaff, Arizona and Palm Springs, California. To the north, central Washington and Oregon have seen drought development over the last few months. This month, Spokane, Washington received only 0.69 in (17.5 mm) rainfall, the 28th driest May in the station's 112-year record.
Temperatures in the Northwest and along the coast this month were 2-4 F (1-2 C) below normal, similar to but less cool than May 2010 and 2011. Average May temperatures do not show recent warming or cooling in the Northwest, though the past two years were anomalously cool. The Southwest saw temperatures 2-6 F (1-3 C) above normal, breaking the cool May pattern of 2010 and 2011, and back to the general trend of increasing May temperatures in the Southwest over the past 30 years.
A significant consequence of the continued warm and dry March, April, and May has been a drastic lowering of the expected summer snowmelt in the Intermountain West. Forecasts of Colorado River inflow to Lake Powell have dropped very far, and now rank among the 3rd or 4th lowest in the past century.
Upper Colorado River Basin: As reported by the Colorado Climate Center, the May 29th NIDIS (National Integrated Drought Information System) assessment for the Upper Colorado River Basin (UCRB) indicated that, water-year-to-date (WYTD) SNOTEL precipitation percentiles were lowest for the Yampa and Gunnison basins in Colorado, with many sites reporting in the lowest 5th percentile or below. The Wasatch range in Utah and the northern mountains of Colorado were also dry, with most precipitation percentiles in the teens. SNOTEL percentiles in the Upper Green basin in Wyoming were generally above the 40th percentile. In the San Juan basin, a few SNOTEL percentiles remained above the 30th percentile, but there were many SNOTEL sites reporting below the 30th percentile. Snowpack conditions around the UCRB were all well below average and many sites have completely melted out. This is a combined result of less than average seasonal snowpack accumulations and much earlier melting. For example, accumulated snow water equivalent around the Colorado headwaters peaked over a month earlier than average. Accumulations were similar to 2002 accumulations and melting has occurred earlier than 2002. This is similar for many of the sub-basins in the UCRB. As of May 27th, about 78 percent of the stream gages in the basin were recording below normal flows. All of the reservoirs above Lake Powell were currently near or above their May storage averages. Flaming Gorge, Blue Mesa, and Navajo have seen volume decreases since the beginning of the month. The other reservoirs have seen slight increases, though they were observing volume increases much less than what is normally expected for this time of year. Lake Powell was at 79 percent of average and 64 percent of capacity. Daily inflows into the major reservoirs in the basin were much below average for this time of year.
Pacific Islands: According to reports from National Weather Service offices, the Pacific ENSO Applications Climate Center (PEAC), and partners, conditions varied across the Pacific Islands.
As noted by the National Weather Service office in Honolulu, the 2012 dry season has started hard and fast, especially in most of the leeward areas of the state where may rainfall totals came in below average. An existing area of extreme drought, or the D3 category in the USDM map, spread from the south Kohala district and the Pohakuloa region of the Hamakua district into the north-facing slopes of Hualalai in the north Kona district. Severe drought, or D2 category conditions, covered the lower elevations of southwestern Kau and portions of the Humuula Saddle. In Maui County, extreme drought conditions have persisted over western Molokai and southwest Maui from Kihei to Makena. Severe drought covered the island of Lanai, the lower leeward slopes of the west Maui mountains and leeward Haleakala from Kula to Kaupo. Kauai and Oahu have remained drought-free. However, leeward areas were drying out and vegetation growth from the wet season has recently started to burn in a few areas.
Some drought impacts in Hawaii include the following:
- On Kauai, there were no drought impacts to report. However, agriculture impacts beyond the usual seasonal dryness will begin to appear if lower than normal rainfall persists.
- On Oahu, the water supply in the Waimanalo reservoir remains above pre-drought levels. On April 23, the state Department of Agriculture rescinded the mandatory 10 percent water use restriction from the Waimanalo reservoir. A voluntary 10 percent reduction in water use has taken its place as a precaution for the dry season.
- On Molokai, the water level in the Kualapuu reservoir remains very low. Thus, the State of Hawaii Department of Agriculture has continued a mandatory 30 percent reduction in irrigation water consumption.
- On Lanai, no significant change since the May 3 update. Pastures and general vegetation conditions have been very poor.
- On Maui, pastures and general vegetation in leeward Maui remain extremely dry and there is an increasing risk for significant brush fires in the area. A rancher operating near Kaupo reported that springs have been drying up. Earlier, an upcountry rancher indicated that over the past four years, poor pasture conditions have resulted in reduced cattle weights, poor breeding rates due to a significant reduction in the number of breeding cows and losses in the hundreds of thousands of dollars. The Maui County Department of Water Supply has continued to call for a 5 percent reduction in water use for upcountry residents. The request for a 10 percent reduction in water use by central and south Maui also remained in effect.
- On the Big Island, pastures and general vegetation over most of the south Kohala district and portions of the north Kona district along the north-facing slopes of Hualalai were in very poor condition. There is an increasing risk of significant brush fires in these areas. Earlier reports indicated that there was little or no edible forage for livestock. Ranchers in these areas have already destocked cattle and water hauling operations have been ongoing for many months.

On other Pacific Islands (maps — Micronesia, Marshall Islands, basinwide), May was drier than normal for Kosrae and Majuro, but near to above normal for the rest of the stations. Total rainfall for the last 12 months (June 2011-May 2012) was near to above normal for all stations.
| Station Name** | Jun 2011 | Jul 2011 | Aug 2011 | Sep 2011 | Oct 2011 | Nov 2011 | Dec 2011 | Jan 2012 | Feb 2011 | Mar 2012 | Apr 2012 | May 2012 | Jun 2011-May 2012 |
| Chuuk | 218% | 125% | 144% | 118% | 97% | 136% | 125% | 57% | 181% | 107% | 40% | 173% | 126% |
| Guam IAP | 96% | 203% | 102% | 129% | 135% | 83% | 103% | 162% | 94% | 215% | 121% | 224% | 132% |
| Kapingamarangi | 130% | 147% | 162% | 107% | 57% | 81% | 124% | 109% | 71% | 121% | 102% | 143% | 115% |
| Koror | 129% | 152% | 155% | 266% | 122% | 62% | 97% | 36% | 126% | 121% | 120% | 122% | 129% |
| Kosrae | 114% | 87% | 122% | 104% | 154% | 95% | 174% | 65% | 185% | 60% | 84% | 86% | 108% |
| Kwajalein | 121% | 104% | 144% | 111% | 125% | 130% | 84% | 134% | 114% | 84% | 68% | 161% | 118% |
| Majuro | 97% | 131% | 108% | 115% | 115% | 119% | 91% | 107% | 65% | 194% | 97% | 59% | 107% |
| Pago Pago | 132% | 42% | 72% | 29% | 137% | 157% | 75% | 61% | 98% | 131% | 90% | 126% | 98% |
| Pohnpei | 128% | 92% | 138% | 115% | 77% | 123% | 110% | 82% | 138% | 98% | 45% | 115% | 103% |
| Saipan | 174% | 96% | 93% | 68% | 140% | 57% | 110% | 77% | 183% | 35% | 33% | 166% | 101% |
| Yap | 113% | 138% | 129% | 156% | 101% | 112% | 116% | 33% | 117% | 185% | 89% | 142% | 122% |
** Clicking on the station name will reveal a climatology graph of the normal monthly rainfall.

[top]
State/Regional/National Moisture Status
A detailed review of drought and moisture conditions is available for all contiguous U.S. states, the nine standard regions, and the nation (contiguous U.S.):
| northeast u. s. | east north central u. s. | central u. s. |
| southeast u. s. | west north central u. s. | south u. s. |
| southwest u. s. | northwest u. s. | west u. s. |
| Contiguous United States |
[top]
Drought Indicators
- Palmer Drought Indices
- Standardized Precipitation Index
- long-term (36 to 60 month) percent of normal precipitation maps
- airport station percent of normal precipitation maps
- statewide precipitation rank maps
- Cooperative station percent of normal precipitation maps
- percent of average maps for the SNOTEL stations in the western mountains provided by the Western Regional Climate Center
- hydrologic year precipitation
- snow water equivalent of snowpack
- satellite-based observations of vegetative health
- National Weather Service model calculations of soil moisture, runoff, and evaporation
- National Weather Service model calculations of soil moisture using the Leaky Bucket Model
- Midwest Regional Climate Center model calculations of soil moisture
- topsoil moisture conditions observed by the USDA and mapped by the Climate Prediction Center
- pasture and range land conditions observed by the USDA and mapped by the Climate Prediction Center
- streamflow maps maintained by the USGS
[top]
Contacts & Questions