|
Contents Of This Report: |

|
National Drought Overview
|
|
[top]
Detailed Drought Discussion
Overview
January 2011 was below the long-term average for precipitation and temperature (9th driest and 37th coolest, based on data back to 1895) when weather conditions are averaged across the country. But this reflected wide regional extremes (monthly precipitation and temperature) which resulted from the persistence of weekly regional precipitation (weeks 1, 2, 3, 4) and temperature (weeks 1, 2, 3, 4) anomalies throughout the month. Beneficial precipitation fell across parts of the drought area in the South, notably parts of Florida and Texas, and over parts of Hawaii. But for the most part, it was drier than normal over most of the drought and abnormally dry areas as well as a large part of the rest of the country. Abnormally dry and drought conditions contracted across parts of Texas to Mississippi, Florida, Nevada, and Hawaii, but expanded in the Southwest to western Texas, Carolinas to parts of the Northeast, Upper Michigan, and Alaska. About 24 percent of the contiguous U.S. was experiencing moderate to extreme drought at the end of January, reflecting a steady rise since last summer when the percent area dropped to the lowest value in the USDM 10-year record.

The U.S. Drought Monitor drought map valid February 1, 2011.
The prevailing  weather pattern over the contiguous United States during January consisted of a dominant high pressure ridge over the West and a low pressure trough over the East. Temperatures averaged above normal in the Pacific Coast states under the upper ridge, while cooler-than-normal temperatures dominated east of the Rockies under the upper trough.
Strong storm systems moving in this flow pattern brought rain and snow to many areas. Pacific extra-tropical cyclonic systems moved across the Northwest and northern Rockies then intensified as they moved into the Great Plains states. Nebraska and North Dakota each had their 12th wettest January on record. Other winter storm systems developed over the Southern Plains, tapping Gulf of Mexico moisture as they moved across the southern states and intensified, then finally tracked up the Atlantic Seaboard. Several of the low pressure sytems and associated cold fronts brought severe weather to the Gulf Coast, including several tornadoes to central Florida. The northern systems and Gulf systems exited the country in the Northeast.
The combination of Gulf moisture and cold Canadian air resulted in widespread snowfall. January began with about 50 percent of the contiguous U.S. under snow cover and ended with about 42 percent snow covered, but the snow cover area varied with each snowstorm during the month, reaching a maximum of about 71 percent of the country on January 12th. Based on the 45-year satellite record, January 2011 had the 5th largest January snow cover extent for the country and 4th largest January snow cover extent for North America. Snow has a lower moisture content than rain, so it takes more snow (on average, about ten times as much) to equal the same amount of precipitation (meltwater equivalent) that would fall as rain. These winter storm systems brought above-normal snowfall and snow cover but below-normal rain to many areas, giving the impression of wet conditions when, in fact, total precipitation was below normal. The southwestern U.S. was unusually dry beneath the upper ridge, with New Mexico having the driest January in the 117-year record and Arizona and Nevada ranking 2nd driest. Many states along the Mississippi River and eastward were drier than normal, with Virginia ranking 5th driest and North Carolina 9th driest. For the nation as a whole, January 2011 ranked as the 9th driest January in the 117-year record.
Cold fronts and low pressure systems moving in the storm track flow are influenced by the broadscale atmospheric circulation. Two such large-scale atmospheric circulation patterns were dominant during January. The first was the La Niña, which is the phenomenon created by cooler-than-average sea surface temperatures in the eastern tropical Pacific Ocean. La Niña is typically associated with wet conditions in the northwest states and Ohio Valley this time of year (December-February), cooler-than-normal conditions in the Far West and North Central states, and warm and dry conditions in the southern tier states and Atlantic Seaboard. The second atmospheric circulation index was the Pacific/North American (PNA) pattern, which was positive during much of January. A positive PNA is typically associated with colder-than-normal temperatures over the southeastern half of the country and warmer-than-normal temperatures along the Pacific Coast at this time of year. The typical precipitation pattern associated with a positive PNA is drier than normal along and east of the Mississippi River, parts of the interior West, and in the Pacific Northwest. The temperature pattern for January 2011 matched what is expected for a positive PNA, while the precipitation pattern was a combination of positive PNA in the East and La Niña in the West.
By the end of the month, the core drought areas in the U.S. included:
- a band of moderate (D1) to extreme (D3) drought which stretched from the Southwest, across the Southern Plains, to the Southeast;
- parts of Hawaii, where conditions improved but moderate to extreme drought persisted;
- the central Plains and Ohio Valley, where moderate to severe (D2) drought continued; and
- the Arrowhead of Minnesota, where moderate drought lingered.
Palmer Drought Index
|
 |
The Palmer drought indices measure the balance between moisture demand (evapotranspiration driven by temperature) and moisture supply (precipitation). The Palmer Z Index depicts moisture conditions for the current month, while the Palmer Hydrological Drought Index (PHDI) and Palmer Drought Severity Index (PDSI) depict the current month's cumulative moisture conditions integrated over the last several months. As seen on the Palmer Z Index map, low precipitation resulted in dry conditions for January 2011 over much of the Mid-Atlantic states and northern parts of the Southeast and Southern Plains, parts of the Northeast and Ohio Valley, and much of the Southwest and Pacific Coast. Wet conditions for January are evident on the Z Index map across the northern Plains and a few parts of the Pacific Northwest, Florida, and southern Texas. Compared with the December 2010 PHDI map, the January 2011 PHDI map indicates that drought conditions intensified in the Southwest, Mid-Atlantic states, and Carolinas; drought conditions lessened in northern Florida; and moist conditions lessened in parts of the Northeast and West. The January 2011 PHDI map also reflects the long-term nature of the drought conditions. The Z Index and PHDI maps in combination show that the dryness in the Southeast to Southwest and Ohio Valley is both a short-term and long-term phenomenon; that the dryness in the Northeast and Far West is a short-term phenomenon; that the wetness in Florida is also a short-term phenomenon; and that the wetness in the northern Plains and northern Rockies is both a short-term and long-term phenomenon.
Standardized Precipitation Index
 |
 |
 |
The Standardized Precipitation Index (SPI) measures moisture supply. The SPI maps here show the spatial extent of anomalously wet and dry areas at time scales ranging from 1 month to 24 months. Dryness is evident across much of the West at the 1-month timescale, with wet conditions dominating at the 2- to 24-month timescales, but dryness characterizes parts of the Southwest at all time scales. January was dry in parts of the Northeast, and the dryness extends to 3 months for the Adirondacks of New York, but the Northeast is generally wet at the 6- to 24-month timescales. The Gulf coastal areas were wet or near normal for January, but much of the Southeast and South is dry out to the 12-month timescale. The rain in January was enough to neutralize the deficits in Florida at 2 and 3 months, but not at 6 and 9 months for all of the state and 6 to 12 months for northern Florida. Parts of the Ohio Valley show up as dry at the 1- to 12-month timescales, with most of the region dry at the 2- and 6-month timescales. The dryness extends into the Great Lakes across Lower Michigan at the 1- to 6-month timescales. The Northern Rockies and Northern Plains are persistently wet at all timescales, with the wetness extending into the Midwest and Central Plains at 6 to 24 months.
 |
 |
 |
Agricultural Indices
 |
 |
Abnormal dryness and drought were evident in several indicators. There were hardly any days with precipitation across the southwestern fourth of the country and parts of the Upper Mississippi Valley and northwestern Great Lakes, as well as the central mountains of Virginia. This resulted in long runs of consecutive dry days in these areas. It is also reflected in low total precipitation amounts and below-normal precipitation. On the other hand, it rained or snowed half or more of the days of the month along the coastal Pacific Northwest and parts of the Northern Rockies, Northern High Plains, and Northeast. During the winter cold season, vegetation goes dormant across much of the country. But soil moisture, as monitored by several models (NOAA Climate Prediction Center [CPC] anomalies and percentiles, NLDAS [North American Land Data Assimilation System] top soil layer and total soil layer, VIC [University of Washington Variable Infiltration Capacity macroscale hydrologic model] percentiles), was still drier than average across much of the country from the southern Great Lakes to the Lower Mississippi Valley, most of the Gulf Coast, the Southeast to Mid-Atlantic states, and parts of the Central and Southern Plains and Southwest. Satellite monitoring of vegetation health (Vegetation Drought Response Index [VegDRI], Vegetation Health Index [VHI]) indicated stress on vegetation in parts of the Southwest, Southern Plains, and Ohio Valley.
Hydrological Indices
Well monitoring stations (real-time network, climate response network, total active network) in the drought-stressed areas continued to show low groundwater levels. Streamflow (observed and modeled [CPC anomalies and percentiles, VIC 1- and 2-month runoff percentiles]) was below average for the month across much of the Southeast and Gulf Coast and parts of the Great Lakes, Central and Southern Plains, Southwest, Mid-Atlantic states, and Hawaii.
Regional Discussion

Mountain Snowpack as of February 1, 2011.
January 2011 was warmer than normal across Alaska and drier than normal across most of central and southern Alaska. Consequently, snowpack was below normal in most basins and decreased compared to last month. The February 1st USDM map had a third of the state in the abnormally dry category, which was an increase compared to last month and reflected long-term deficits which still remained at several stations at longer time scales (2, 3, 6, 12, 24, 36 months).
Most of Puerto Rico was drier than normal during January and much of the island was drier than normal for the last 60 to 90 days. But the dryness mostly disappears at longer time scales (last 6 months). Streamflow for Puerto Rico was near normal and the island remained drought free on the February 1st USDM map.
Above-normal precipitation fell across parts of the Hawaiian Islands during January, but many locations were drier than normal, especially over the Big Island. The area under extreme (D3) and severe (D2) drought shrank this month, compared to the end of December, resulting in an increase of the area under moderate (D1) drought. The D2-D3 shrinkage was mainly due to vegetation conditions improving in parts of the western slopes of Mauna Kea. Long-term rainfall deficits continued at many stations at several time scales (last 2, 3, 6, 12, 24, 36 months) and January streamflow continued below normal on the Big Island.
 |
 |
On a statewide basis, January 2011 was drier than normal for many states in the Southwest, Southern Plains, and east of the Mississippi River. Eight states had the tenth driest, or drier, January in the 1895-2011 record, including New Mexico (which had the driest January on record) and Arizona and Nevada (which each ranked 2nd driest).
|
 |
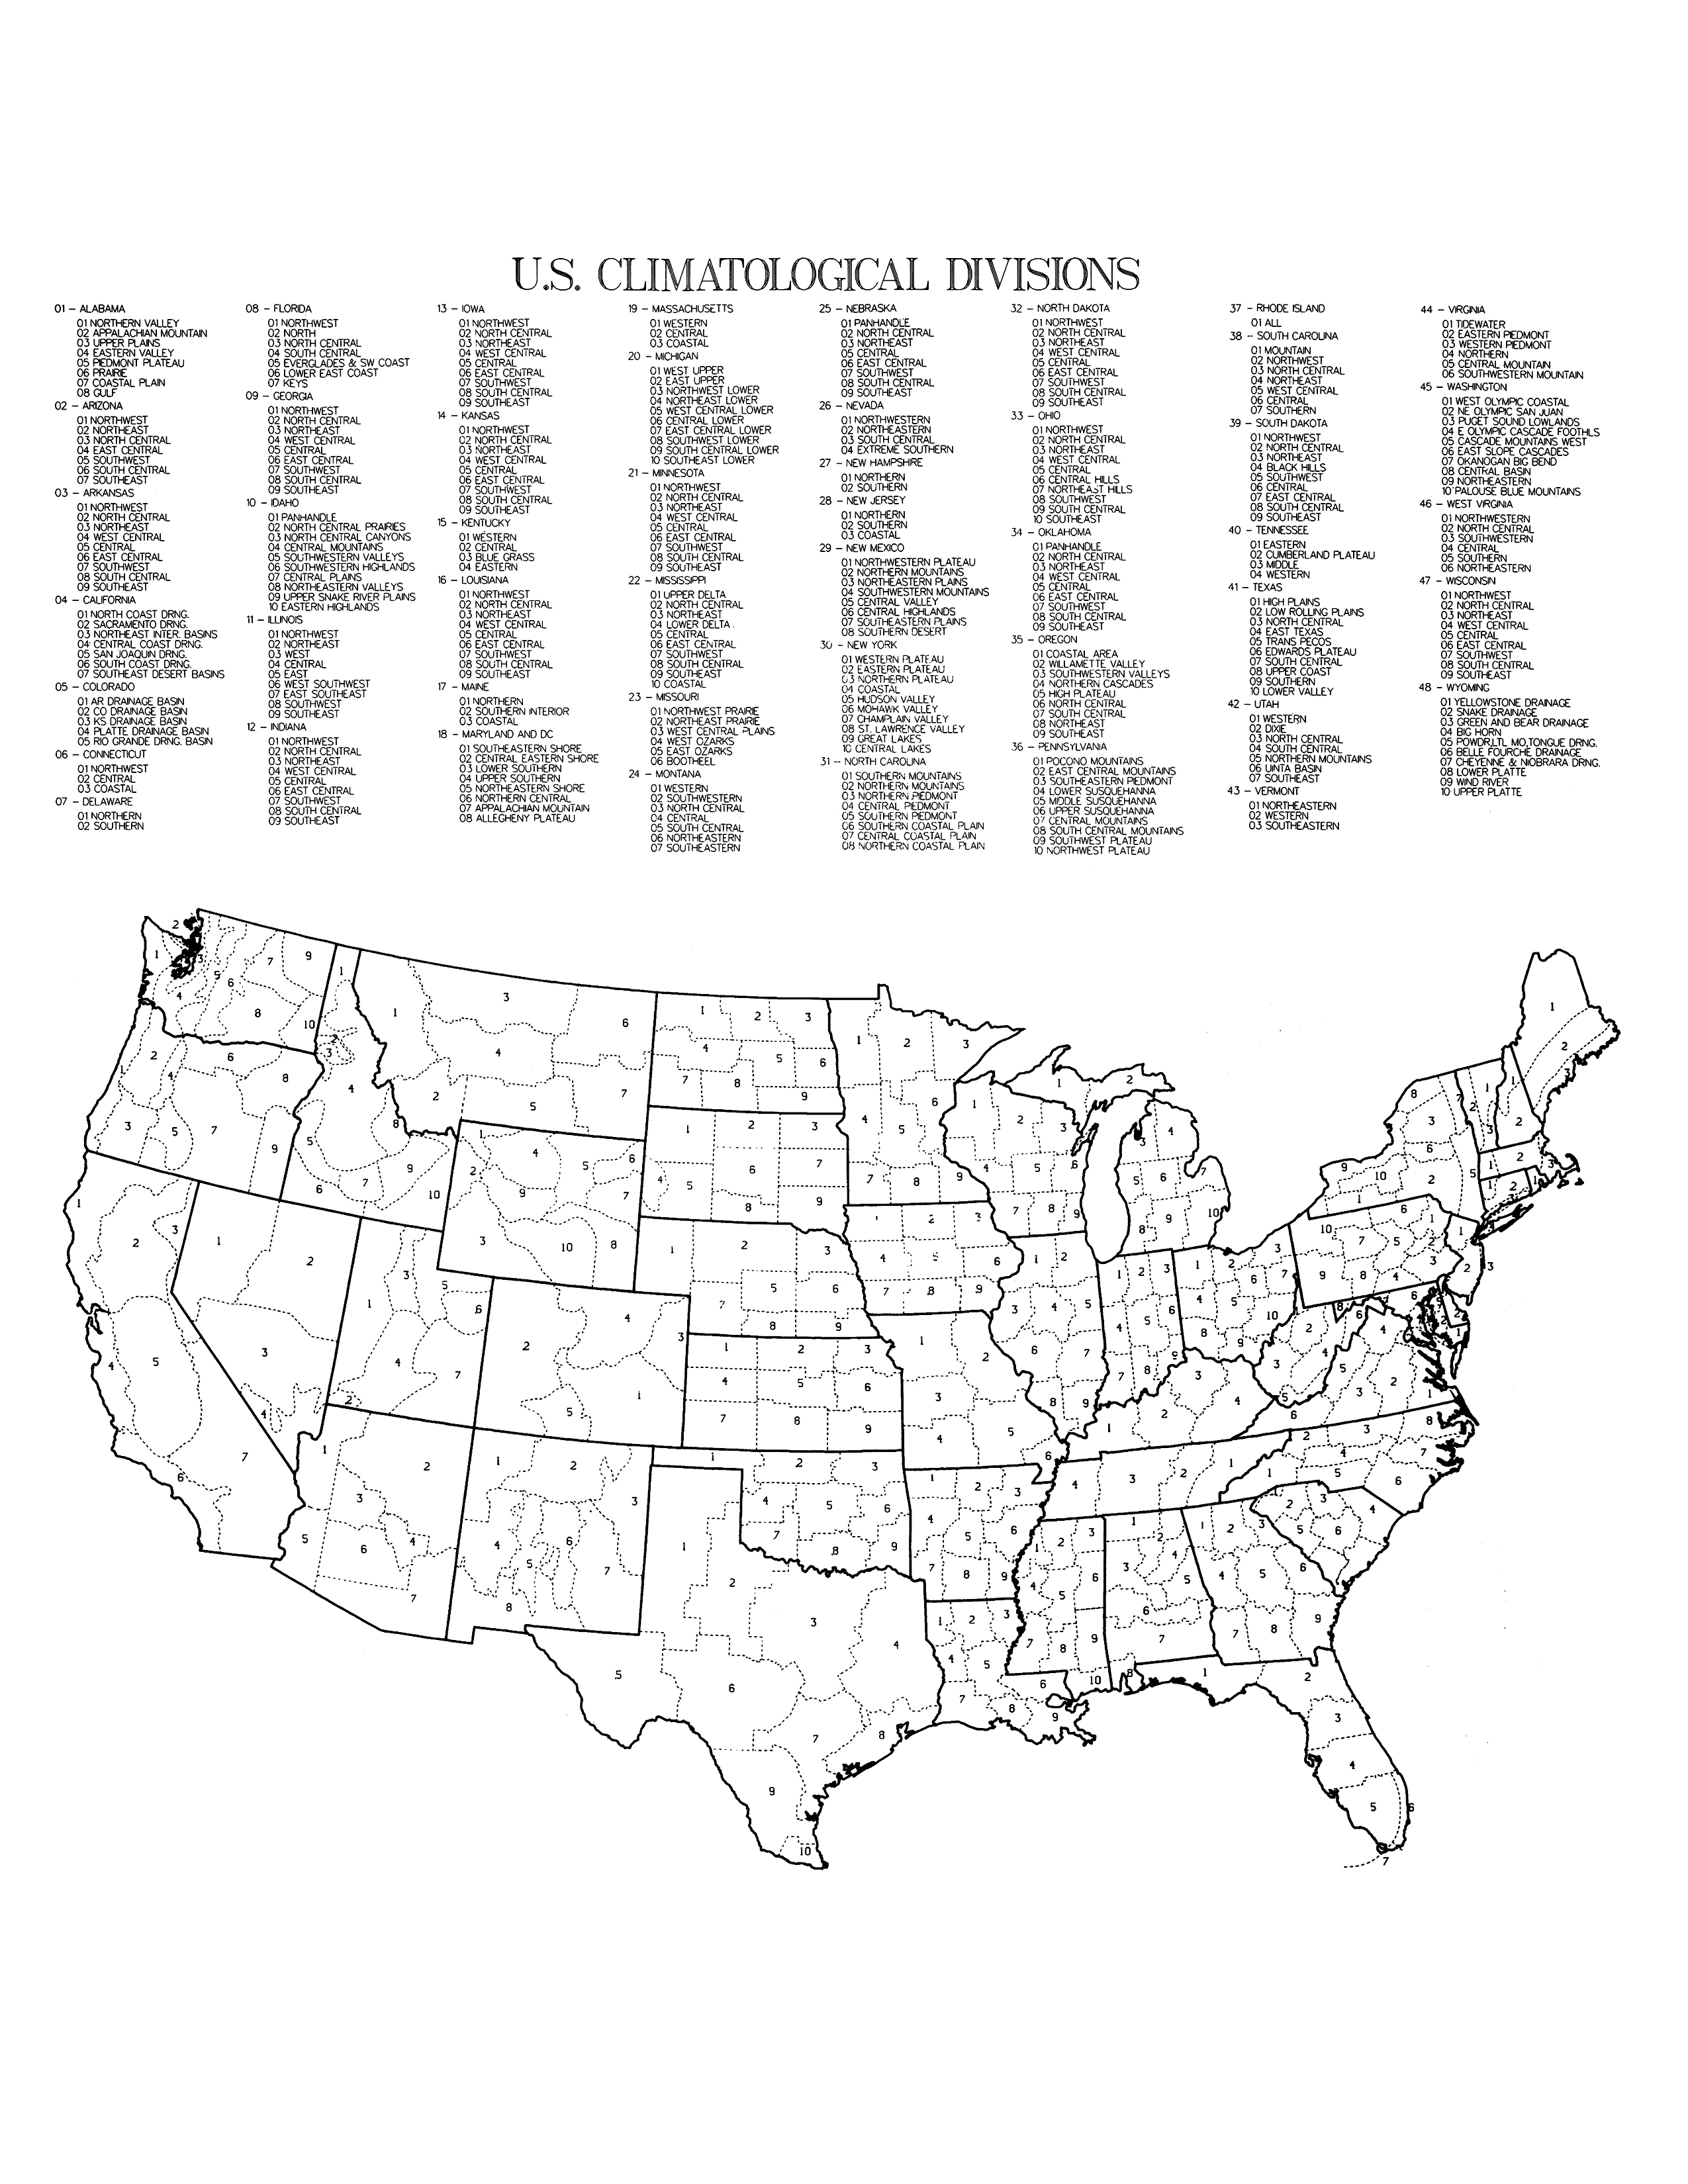
January was record dry or tied for driest on record for several climate divisions in the Southwest and in Utah and New York:
- Arizona climate divisions 5 and 7,
- New Mexico climate divisions 7 and 8,
- Utah climate division 6, and
- New York climate division 8.
|
|
 |
 |
Dryness in the Lower to Mid-Mississippi Valley has persisted for several months. Several climate divisions have been record dry for the last 2 months and 12 months, including:
- Arkansas climate divisions 2 (December-January), 8 (February-January), and 9 (February-January),
- Missouri climate division 4 (December-January), and
- Mississippi climate division 4 (February-January).
The record dry February-January (2010-2011) follows a record wet February-January (2009-2010) in the two Arkansas climate divisions (8 and 9).

West Texas (especially around the Trans Pecos) has been dry for the last three to four months. Texas climate division 5 had the driest December-January, November-January, and October-January in the 1895-2011 record. Lake levels continued to drop, with January 25 reports ranging from 58 percent of capacity at Oak Creek Reservoir to 3 percent at E.V. Spence Reservoir. The January 24 U.S. Department of Agriculture (USDA) Crop Report indicated that, statewide, 49 percent of wheat, 48 percent of oats, and 51 percent of the range and pasture land in Texas was in very poor to poor condition. The USDA report stated that topsoil was very short to short (very dry to dry) in 100 percent of the Trans-Pecos district, 90 percent of the Southern Low Plains district, 88 percent of the Edwards Plateau district, and 80 percent of the Cross Timbers district. The Farm Service Agency reported significant crop loss in several western Texas counties, with up to 70 percent loss of wheat for grazing in Shackelford County.

Percent area of the Western U.S. in moderate to extreme drought, January 1900-January 2011, based on the Palmer Drought Index.
January 2011 was drier than average across much of the West. This is in sharp contrast to the wetness of the previous three months. The combination of lack of precipitation and above-normal temperatures resulted in a decrease in the mountain snowpack this month compared to last month. While many of the high elevation SNOTEL stations still had above-normal snow water content, especially from the Sierra Nevada to Central Rockies, many areas have decreased to near normal snowpack with much of Oregon and Washington below normal and southern portions of the Southwest much below normal. Total precipitation for the hydrologic year to date (October-January) was near normal in the Pacific Northwest in spite of the below-normal snowpack because more precipitation fell as rain versus snow than usual. An analysis of early data by the USDA indicated that reservoir levels were, on average, below normal from New Mexico, across the Interior Basin states, to Oregon, and near to above normal in Washington and Arizona and the Rocky Mountain states. According to the USDM, 13 percent of the West was experiencing moderate to severe drought at the end of January, about the same as December, while the Palmer Drought Index statistic was about 12 percent, a jump of 8 percent compared to last month due to expansion of moderate drought in southern portions of the Southwest. The Palmer statistic for moderate to extreme wet spell decreased from 47 percent in December to about 26 percent at the end of January, further testifying to the magnitude of the January dryness.
A more detailed drought discussion, provided by the NOAA Regional Climate Centers and others, can be found below.
As noted by the Southeast Regional Climate Center, precipitation totals for January were below normal across a large portion of the Southeast. Precipitation totals were less than 75 percent of normal across most of Alabama, Georgia, and southern Florida, and less than 50 percent of normal across the Carolinas and Virginia. The driest locations (less than 25 percent of normal) were found across western Virginia and local portions of the Carolinas and Alabama. Roanoke, Virginia received only 0.82 inches (20.8 mm) of precipitation for the month, making it the 4th driest January in a record extending back to 1912. In contrast, monthly precipitation totals were between 100 and 150 percent of normal across the northern tier of Florida and as much as 300 percent of normal across the central Peninsula. Orlando, Florida and Tampa, Florida recorded their 5th wettest January with 5.92 and 6.28 inches (150.4 and 159.5 mm), respectively. Monthly precipitation was below normal across much of Puerto Rico and the U.S. Virgin Islands.
Widespread drought continued across the Southeast in January. The most notable change in the U.S. Drought Monitor, as of January 25, was an expansion of moderate drought (D1) conditions through central portions of North Carolina and Virginia. The lack of precipitation over the past several months lead to record low stream flows across several watersheds in January, preventing recharge to reservoirs. As a result, minimum releases were ordered out of several North Carolina reservoirs to help maintain water levels. The persistence of cold temperatures this winter has resulted in sufficient chill hours for a number of winter crops, including blueberries and peaches. As a result, farmers are concerned that warm February temperatures could cause the crops to bloom and thus be susceptible to an early spring freeze.
For the second consecutive month, mean temperatures were below normal across the Southeast region. Monthly temperatures were slightly above normal across Puerto Rico, while the U.S. Virgin Islands experienced their third consecutive month of below normal temperatures. In contrast to December, which saw over 1,000 daily record low maximum and minimum temperatures, there were only 142 daily record low maximum and 126 daily minimum temperature records tied or broken across the Southeast in January. Abundant snow occurred with the cold temperatures. The Southeast region was affected by four winter storms in January. According to the Georgia State Climate Office, Athens, Georgia recorded an all-time 24-hr snowfall total of 8.8 inches (223.5 mm). An extended period of cold temperatures following an early January storm and a lack of snow removal equipment caused severe disruptions across parts of the region. On the 22nd of the month, a low pressure system off the Southeast coast produced 6 to 7 inches (152.4 to 177.8 mm) of snowfall along portions of North Carolina's Outer Banks. With respect to monthly snowfall totals, Huntsville, Alabama recorded 9.2 inches (233.7 mm), which registered as the 3rd snowiest January in a record extending back to 1894.
As explained by the Southern Regional Climate Center, with the exception of southern Texas, much of the Southern region experienced its fourth consecutive drier than normal month. The Southern region continued to struggle through a strong drought, and little to no precipitation through much of the northwestern tier of the region did little to help that cause. The driest areas of the region included Oklahoma, the northern two thirds of Arkansas and much of northwestern Texas. The majority of stations in those regions received only a quarter of the precipitation that is normally expected in January. In fact, dozens of stations reported no precipitation at all. In Arkansas, most stations received between 25 and 50 percent of normal precipitation. In total, Oklahoma averaged only 0.29 inches (7.37 mm) of precipitation for the month, making it the eighth driest January there on record (1895-2011). Arkansas averaged 1.62 inches (41.15 mm) for the month, which was their 15th driest January on record (1895-2011). In Texas, the January average precipitation total was a near average value of 1.52 inches (38.61 mm). The state average is somewhat skewed by the fact that it was extremely dry in the northern half of the state, and quite wet in the southern half. Louisiana also had a near average month for precipitation. The state average precipitation total was 4.71 inches (119.63 mm), which is only slightly below average. In Mississippi, the state average precipitation total was 4.33 inches (109.98 mm) which, like Louisiana, is a little on the dry side of average. Tennessee averaged 3.10 inches (78.74 mm), which was the 27th driest January on record (1895-2011). January temperatures in the Southern region were consistently below normal by 0 to 4 degrees F (0 to 2.22 degrees C), with little spatial variation among temperature anomalies.
Drought conditions did not change much during the month of January in the Southern region. Extremely dry conditions in the western Texas panhandle led to a one-category deterioration to severe drought. Similar dryness in western Mississippi also led to the introduction of severe drought. Anomalously high January precipitation totals in southern Texas resulted in some improvements. For instance, much of the Gulf Coast in Texas was now drought free. There were still some small pockets of moderate drought in the extreme southern tip of the state. Similar improvements also occurred in south central Louisiana and central Mississippi. Based on the February 1 report of the USDM, 6.59 percent of the Southern region was experiencing extreme drought, which is an improvement of 3.58 percent from last month. In addition, only 58.97 percent of the region was classified as moderate drought or worse. Last month, this value was 67.65 percent.
As summarized by the Midwest Regional Climate Center, January precipitation was below to much below normal. The exception was the area from northwestern Minnesota south through northwestern Missouri, where precipitation was 100 to 200 percent of normal. Most of the region received less than 75 percent of normal precipitation, with an area from southwestern Missouri into the Ohio Valley receiving less than 50 percent of normal. Snow was a frequent occurrence during the month across most of the region. January temperatures were below normal across all but a small portion of the region. Temperatures ranged from near normal over a small portion of the upper Midwest to 5 to 6 degrees F (2.8 to 3.3 degrees C) below normal from western Minnesota south into western Missouri.
As noted by the Northeast Regional Climate Center, the Northeast region's January 2011 precipitation total averaged 2.14 inches (54 mm), which was 64 percent of normal. This was the driest January since 2001 and the 18th driest since records began in 1895. Departures ranged from 53 percent of normal in Maine to 95 percent of normal in Rhode Island. Although the region averaged less than normal precipitation, snowfall totals were above normal. This was due to a persistent weather pattern that resulted in frequent storms, large and small. Measureable snow fell over large portions of the region at least once a week during January. By the 31st, parts of every state except Maryland and Delaware had snowfall totals that exceeded 2 feet (61 cm). New daily snowfall records were set during the month, including two that went back to the late 1800's: Central Park's 6.1 inches (15.5 cm) on the 12th beat the 5.0 inches (12.7 cm) that fell in 1893; and Newark, New Jersey's 6.7 inches (17.0 cm) on the 27th topped the 6.5 inch (16.5 cm) record set in 1894. Six cities saw their snowiest January on record: Bridgeport, Connecticut (42.0 inches, 106.7cm); Hartford, Connecticut (57.0 inches, 144.8 cm); Newark, New Jersey (37.4 inches, 95.0 cm); Central Park, New York (36.0 inches, cm); Islip, New York (34.3 inches, 87.1 cm); and LaGuardia Airport, New York (32.6 inches, 82.8 cm). The first month of 2011 averaged cooler than normal in the Northeast. January's regional temperature average was 21.6 degrees F (-5.8 degrees C). This was 1.4 degrees F (0.8 degrees C) below normal and 3.3 degrees F (1.8 degrees C) cooler than January 2010.
As explained by the High Plains Regional Climate Center, precipitation varied across the region this month. Colorado, Wyoming, and Kansas were generally drier than normal with some isolated areas receiving above normal precipitation.
The temperatures this January were full of ups and downs. The year started off with extreme cold across Colorado and Wyoming. In the middle of the month, after a brief warm up, the High Plains region experienced some of the coldest temperatures of the month. The warmest temperatures of the month occurred about 10 days later. These warm temperatures did not last long as a blast of cold Arctic air plunged south into the Region at the very end of the month. Overall, temperatures were slightly warmer than normal across much of Wyoming, central Colorado, western Kansas, and the western edge of the panhandle of Nebraska and cooler than normal in the northern and eastern areas of the region.
With the cold temperatures came abundant snow. Enough snow fell in the higher elevations in western Wyoming to eliminate the moderate drought conditions which have been in place for months. Several rounds of snow impacted the northern and eastern portions of the region this month. Many locations in northeast Nebraska and southeast South Dakota had snowfall totals that ranked in the top 10 snowiest Januaries on record and a few even broke monthly records. A long-standing January snowfall record was broken in Oakdale, Nebraska where 23.2 inches (59 cm) of snow fell this month. The previous record was 17.6 inches (45 cm) and occurred in 1936 (period of record 1893-2011). Interestingly, two days this month ranked as top one-day January snowfalls for Oakdale. The fifth highest one-day snow total occurred on January 23rd with 7.0 inches (18 cm) and the second highest one-day snow total occurred on January 10th with 9.5 inches (24 cm). January 2011 was also the second snowiest month of all time in Oakdale. Only March of 1911 had more snow (27.0 inches/69 cm).
The U.S. Drought Monitor remained largely unchanged since last month. In western Wyoming, a good snow pack and high precipitation caused the moderate drought conditions (D1) to be eliminated and the abnormally dry conditions (D0) to be trimmed slightly. The D0 in the southwest corner of Colorado was also eliminated. However, severe drought conditions (D2) remained over south-central Colorado and western Kansas. D1 across eastern Colorado, western and southeastern Kansas, and the panhandle of Nebraska was also unchanged.
As noted by the Wyoming State Climate Office, the climate of January 2011 was characterized by significant drying in many parts of Wyoming, but it was also marked by high spatial variability in precipitation. Generally speaking, mountain snowpack remained high compared to much of the previous decade, yet many observing stations in the valleys and basins were dry for the month. Similarly, over a distance of 50 miles one might go from a site that received more than 200 percent of its historical average precipitation for the month to a location that received less than 5 percent. Generally speaking, southwestern Wyoming was quite dry during the month of January, whereas the northeast tended toward wetness. In Evanston (far southwest Wyoming), for example, the entire month passed with only 0.01 inch of precipitation recorded. According to the U.S. Drought Monitor, Wyoming remained nearly drought free through the month of January 2011. In fact, the state was now enjoying its smallest area in drought since late 2009. However, given precipitation deficits that have developed at some lower-elevation sites over the past 30 days, it will be essential to monitor for the potential of drought onset in coming weeks and months.
As summarized by the Western Regional Climate Center, precipitation was below to well below normal throughout most of the West except for portions of northwest Washington and northeast Montana. Glasgow, Montana, set a new all time monthly snowfall record going back 95 years with 41.6 inches (105.7 cm) shattering the old record of 32.9 (83.6 cm) inches set in January 2004. It was also the second wettest January in Glasgow. Much of the desert Southwest received no precipitation at all.
Mountain snowpack dropped significantly in the Sierra Nevada from January 1st to February 1st, with snowpack dropping from 215 percent of normal to 130 percent of normal around Lake Tahoe. Although mountain snowpack remained fairly healthy throughout the West, many locations lost snow during the dry January. The Pacific Northwest and the mountains of the Southwest were below normal even though precipitation in the Northwest was above normal for the winter as snow levels have been relatively high for many storm events. Crater Lake, Oregon, received only 17.5 inches (44.4 cm) of snow, its 2nd lowest January total (record, 9 inches / 22.9 cm in 1985, average about 90 inches / 229 cm) during what is normally the snowiest month. The snow depth on the ground there decreased from 100 inches (254 cm) on January 1st to a mere 66 inches (168 cm) on the 31st, normally increasing from 65 inches (165 cm) to 93 inches (236 cm) during that span.
Temperatures were near normal throughout the West except for isolated basins and valleys where strong inversions persisted through the month keeping temperatures well below normal. Vernal, Utah, in the snow covered Uinta Basin, was nearly 8 degrees F below normal for January as a strong inversion remained solid for most of the month, while nearby mountain locations 3000 feet higher averaged 10-15 degrees F (6-10 C) warmer. In California's Central Valley frequent fog kept average maximum temperatures mostly below normal while coastal and mountain locations basked in sun and above normal temperatures.
As described by the Arizona State Drought Monitoring Technical Committee, January was quite dry everywhere in the state. Especially dry were the higher elevations of eastern and southeastern Arizona which had less than 70 percent of average winter precipitation. Only the northwestern quarter of the state received more than normal precipitation so far this winter. The next two months were forecast to continue drier than average, so improvement across the southern watersheds was unlikely.
The La Niña circulation has diverted winter storms from southeast and east central Arizona, leaving these parts of the state well below normal winter precipitation levels. Northern and western Arizona were in a transition region, where the effects of La Niña were less consistent; this region has been visited by several winter storms. The upper Gila watershed has dried out substantially, during the dry early winter of 2010-11, which was in sharp contrast with the wetter early winters of some previous years. Last winter, although quite wet, did not make up for the water deficits across the southern watersheds. The outlook was for continued dry conditions through spring, so the situation was not likely to show much improvement in April when the Arizona long term drought status will be updated by the Arizona State Drought Monitoring Technical Committee.
Upper Colorado River Basin: As reported by the Colorado Climate Center, the February 1st NIDIS (National Integrated Drought Information System) assessment for the Upper Colorado River Basin (UCRB) indicated that precipitation varied across the basin during January. The San Juan and Sangre de Cristo mountains received below to near average precipitation, but the rest of the basin was wetter with near to above average precipitation. SNOTEL station water year precipitation ranked in the wet percentiles for most of the UCRB. Streamflow levels decreased compared to previous months but were still in the near normal range. For the month of January, the majority of the UCRB ended up with temperatures below average.
All reservoirs in the UCRB had decreases in January, except for Lake Dillon. Dillon volume slightly increased for month of January to bring its levels back to above average. Lake Granby volume decreased by nearly 25,000 ac-ft for the month of January, which is likely to keep it from spilling this summer. Most reservoirs had above average levels for this time of year, with the exception of McPhee and Green Mountain which were slightly below average. This is a normal time of year for reservoir decreases, except for McPhee. McPhee storage has decreased this past month, but usually its levels are increasing during this time of year. Lake Powell has decreased a total volume of 604,000 ac-ft for the month of January and was 75% of average and 57% of capacity.
Pacific Islands: According to reports from National Weather Service offices, the Pacific ENSO Applications Climate Center (PEAC), and partners, conditions varied across the Pacific Islands.
Several cold fronts during the month of January brought wet conditions to portions of Hawaii from Kauai to Maui. Existing drought areas in leeward Maui County received above normal rainfall but remained under severe drought, or the D2 category in the U.S. Drought Monitor map, since pastures have not yet recovered from the previous dry spell. The Big Island, which received much needed rainfall in December, received below normal rainfall in January. Thus, extreme drought, or D3 category conditions, persisted in the Pohakuloa area. A band of moderate drought, or D1 category, also continued from south point and ocean view estates in the Kau district northwestward to leeward Kohala.
Some drought impacts in Hawaii include the following:
- There were no drought impacts to report on Oahu. Water levels in the Waimanalo reservoir continued to increase over the past month. The State of Hawaii Department of Agriculture once again eased water use restrictions for farmers on the Waimanalo system, going from a mandatory 20 percent cutback to a 10 percent cutback on January 20th.
- On Molokai, no significant changes since January 6th. Water levels in the Kualapuu reservoir continued to increase slowly but it was not enough to warrant any easing of the 30 percent cutback in irrigation water consumption.
- No significant changes on Lanai since January 6th. In 2010, drought conditions forced cattle ranchers to ship feed from off-island which resulted in financial impacts.
- No significant changes since January 6th on Maui. Despite mid-January heavy rainfall, pastures in leeward Maui have not recovered enough to fully support cattle ranching operations. Water supply levels remained sufficient for upcountry Maui. However, as a precaution, the Maui County department of water supply continued to request a 5 percent reduction in water use by upcountry residents. A 10 percent reduction in water use by central and south Maui residents also remained in effect.
- On the Big Island, pastures in the lower slopes of the south Kohala district and the southern portion of the Kau district improved during December but have not yet fully recovered. One rancher in south Kohala reported only 40 percent of his pastures available for grazing. Some ranchers were still hauling water to support livestock. Ranchers have cited a need for additional rainfall in the coming months to produce a full drought recovery.
On other Pacific Islands, drought conditions continued near the equator, extending eastward from about 150 E longitude to beyond the international date line. This area includes Kapingamarangi Atoll, Nauru, and the atolls of western Kiribati. The equatorial drought area has been gradually weakening at its westernmost extent between 150 E and 160 E longitude.
In the Federated States of Micronesia, adequate rainfall has occurred for most of Pohnpei state, with January 2011 precipitation 98 percent of normal and the last six months (August-January) 87 percent of normal. But drought conditions remained at Kapingamarangi Atoll. The atoll was extremely dry last year, with some minor relief in January. Kapingamarangi received 2.27 inches of rain in January, which is 22 percent of normal. Their August-January total was 10.08 inches or only 23 percent of normal. The overall persistence of the La Niña event, along with computer forecast models and past climate history, suggest that this dry pattern will improve very slowly during the next month or two. Continued implementation of water conservation measures on Kapingamarangi was encouraged. Fresh water should be used only for drinking and cooking. Some wells and solar stills were still producing water for drinking and cooking. Some damage to food crops has likely occurred on Kapingamarangi Atoll as a result of the drought. The health of food crops should be closely monitored, and food assistance will likely be necessary if damage to the plants or fruit was irreversible.
Rainfall at Nukuoro and the other islands of Pohnpei state was adequate, although subnormal. Nukuoro recorded 4.34 inches of rain in January, which is 35 percent of normal, and the August-January total was 66 percent of normal. At Kosrae, 11.81 inches of rain fell in January, or 80 percent of normal, for a November-January total that was 77 percent of normal and an August-January total that was 79 percent of normal. Extremely dry conditions persisted from Kapingamarangi eastward all the way across to the international date line. This includes Nauru and the Atolls of Western Kiribati such as Butaritari, Tarawa and Arorae. Drought in these areas will likely last into March at least.
January precipitation was above normal at Koror, Yap, Kwajalein, Pago Pago, Guam, and Saipan, but below normal at Chuuk (8.08 inches, or 76 percent of normal). Majuro was near normal for January. Rainfall was below normal for the last 3 months (November-January) at Chuuk (75 percent of normal) and Pohnpei (89 percent), and slightly below normal at Saipan (96 percent) and Guam (97 percent).
[top]
State/Regional/National Moisture Status
A detailed review of drought and moisture conditions is available for all contiguous U.S. states, the nine standard regions, and the nation (contiguous U.S.):
| northeast u. s. | east north central u. s. | central u. s. |
| southeast u. s. | west north central u. s. | south u. s. |
| southwest u. s. | northwest u. s. | west u. s. |
| Contiguous United States |
[top]
Drought Indicators
- Palmer Drought Indices
- Standardized Precipitation Index
- long-term (36 to 60 month) percent of normal precipitation maps
- airport station percent of normal precipitation maps
- statewide precipitation rank maps
- Cooperative station percent of normal precipitation maps
- percent of average maps for the SNOTEL stations in the western mountains provided by the Western Regional Climate Center
- hydrologic year precipitation
- snow water equivalent of snowpack
- satellite-based observations of vegetative health
- National Weather Service model calculations of soil moisture, runoff, and evaporation
- National Weather Service model calculations of soil moisture using the Leaky Bucket Model
- topsoil moisture conditions observed by the USDA and mapped by the Climate Prediction Center
- pasture and range land conditions observed by the USDA and mapped by the Climate Prediction Center
- streamflow maps maintained by the USGS
[top]
Contacts & Questions