|
Contents Of This Report: |

|
National Drought Overview
|
|
[top]
Detailed Drought Discussion
December 2011 was warmer and drier than average (34th warmest and 46th driest, based on data back to 1895) when weather conditions are averaged across the country. But this reflected persistent weekly regional patterns of temperature anomalies (weeks 1, 2, 3, 4, 5) and precipitation anomalies (weeks 1, 2, 3, 4, 5). Much of the West was drier than normal for the first four weeks, with weather systems bringing above-normal weekly precipitation to the northern areas during the last week of the month. Likewise, the first four weeks were persistently wetter than normal for much of the Southwest and Southern Plains drought areas and the last four weeks drier than normal for the Southeast coast. Above-normal temperatures dominated the Northern Plains and much of the East for most of the month, while normal to colder-than-normal temperatures were the rule for the southwestern third of the nation. These weekly patterns are reflected in the monthly patterns of temperature and precipitation. As a result, drought areas contracted in the Southwest and Southern Plains where beneficial precipitation fell. But persistent dryness in the Far West resulted in expansion of moderate drought and abnormally dry areas, with Oregon having the eighth driest start to the water year (October-December) in the 1895-2011 record and California ranking eleventh driest. Even with a wet December, long-term deficits still left the Southern Plains exceptionally dry. Rainfall over parts of Hawaii shrank the moderate to extreme drought area from 54 percent last month to 47 percent this month. Drought areas held steady or slightly increased along the Southeast coast and in the Upper Mississippi Valley to Northern Great Plains where December was drier than normal. Nationally, the moderate-to-exceptional drought footprint increased to about 27 percent of the country but the percentage in the worst category (D4, exceptional drought) dropped to about 3 percent.
The end-of-December U.S. Drought Monitor drought map valid January 3, 2012.
By the end of the month, the core drought areas in the U.S. included:
- a large area of moderate (D1) to exceptional (D4) drought across the Southwest to Southern and Central Plains;
- moderate to extreme drought in the Southeast;
- areas of expanding moderate to severe (D2) drought in the Upper Midwest to Northern Plains;
- a developing area of moderate drought in the Far West; and
- parts of Hawaii, where moderate to extreme drought persisted.
Palmer Drought Index
The Palmer drought indices measure the balance between moisture demand (evapotranspiration driven by temperature) and moisture supply (precipitation). The Palmer Z Index depicts moisture conditions for the current month, while the Palmer Hydrological Drought Index (PHDI) and Palmer Drought Severity Index (PDSI) depict the current month's cumulative moisture conditions integrated over the last several months.
|
 |
As seen on the December 2011 Palmer Z Index map, low precipitation led to short-term drought across the Upper Mississippi Valley, western Great Lakes, Southeast Coast, Central Gulf Coast, and much of the West this month. Wet conditions are evident on the Z Index map across the Southwest and Southern Plains to Ohio Valley. Compared with the November 2011 PHDI map, the December 2011 PHDI map indicates that drought conditions intensified along parts of the Southeast Coast, Central Gulf Coast, and Upper Mississippi Valley but decreased in intensity in parts of the Southwest and Southern to Central Plains, and wet conditions decreased in parts of the West with moderate drought developing in the Far West. The December 2011 PHDI map also reflects the long-term nature of the drought conditions. The Z Index and PHDI maps in combination show that precipitation brought relief to parts of the Southwest to Central and Southern Plains drought area, and moisture conditions further declined across much of the Far West; but for the Upper Mississippi Valley, Southeast Coast, Central Gulf Coast, and Ohio Valley — precipitation fell where it was already wet and it was drier than normal over the existing drought areas.
Standardized Precipitation Index
The Standardized Precipitation Index (SPI) measures moisture supply. The SPI maps here show the spatial extent of anomalously wet and dry areas at time scales ranging from 1 month to 24 months.
 |
 |
 |
Dryness is evident across much of the West at the 1 to 6 month time scales, and parts of the West at 9 months and even as far back as 12 months; Northern Plains dryness is evident at 1 to 3 months, with part of the Northern Plains into the adjoining Midwest dry at 6 months; dryness can be seen in the Upper Mississippi Valley and adjoining western Great Lakes at 1 to 12 months; northern New England is dry at the 2 month time scale; and the Southeast Coast and Central Gulf Coast dryness shows up at 1 to 3 months with the dry area expanding across much of the Southeast at 6 to 24 months. For the Southwest and Southern to Central Plains, beneficial December precipitation is reflected in wet to neutral conditions on the December (1 month) map back as far as 3 months, but the prolonged deficits make themselves evident as dryness at 6 to 24 months. Wet conditions caused by several frontal and low pressure systems can be seen along bands from the Southwest and Southern Plains to Ohio Valley at 1 to 2 months. Wet conditions caused by weather systems earlier in the year are evident in the Ohio Valley to Northeast at 3 to 24 months and in the Northern Plains at 9 to 12 months. This illustrates the persistence of the dry and wet areas. But the wet conditions from last winter's above-normal precipitation don't show up in the West until the 24 month map, illustrating the magnitude and impact of the early season dryness during this winter.
 |
 |
 |
Agricultural and Hydrological Indices and Impacts
 |
 |
Drought conditions were reflected in numerous agricultural, hydrological, and other meteorological indicators, both observed and modeled. Across the drought areas of the Southeast, streamflows were low and many groundwater well stations were at or near record low levels for this time of year. Low streamflows also characterized the Southern Plains drought area and the developing drought areas of the West Coast. Soils were still dry in the Southern Plains (in spite of recent precipitation) to the Southeast, and soils continued drying out in the Upper Mississippi Valley and now in the Far West. Parts of the West, Northern Great Plains, Upper Mississippi Valley, and coastal Southeast had few, if any, days with precipitation in December. This summary is based on the following observed and modeled indicators:
hydrological:

USGS groundwater map.
- USGS (U.S. Geological Service) observed streamflow;
- NOAA Climate Prediction Center (CPC) modeled runoff anomalies and percentiles;
- VIC (University of Washington Variable Infiltration Capacity macroscale hydrologic model) 1-, 2-, 3-, and 6-month runoff percentiles;
- NLDAS (North American Land Data Assimilation System) modeled streamflow anomalies and percentiles;
- NLDAS model runoff anomalies and percentiles;
- USGS groundwater observations (real-time network, climate response network, total active network);
agricultural:

Map showing change in VIC modeled soil moisture percentiles, from end of November to end of December.
- the Palmer Crop Moisture Index (CMI), which usually does not show short-term agricultural drought during the winter due to extremely reduced evapotranspiration;
- CPC modeled soil moisture anomalies and percentiles for end of December, soil moisture anomaly change;
- CPC's Leaky Bucket model soil moisture percentiles;
- NLDAS modeled soil moisture percentiles for the top soil layer and total soil layer;
- VIC modeled soil moisture percentiles, soil moisture percentile change;
- Vegetation Drought Response Index (VegDRI);
- the NESDIS satellite-based Vegetation Health Index (VHI);
meteorological:

Map of maximum consecutive dry days.
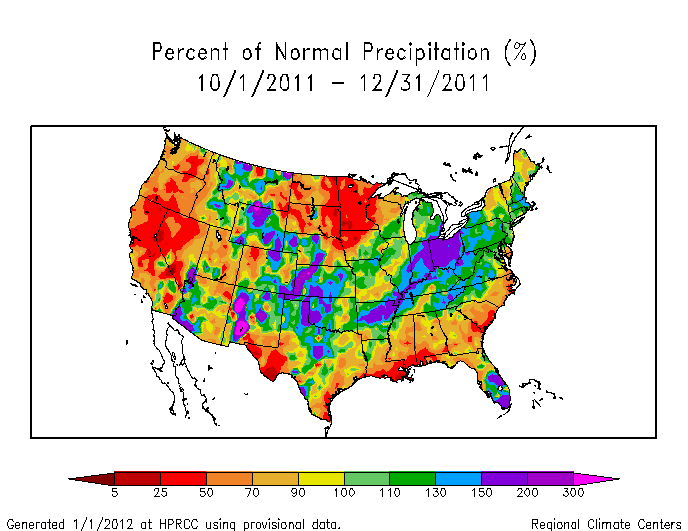
- total precipitation (plotted by the USGS, NOAA National Weather Service [NWS], and High Plains Regional Climate Center [HPRCC]);
- percent of normal precipitation and precipitation percentiles (NWS, HPRCC station observations, Leaky Bucket model, CPC);
- USGS number of days with precipitation and maximum number of consecutive dry days;
- temperature departures from normal (HPRCC, CPC) and percentiles (CPC, Leaky Bucket);
- number of record warm daily low temperatures, record daily high temperatures, record daily low temperatures, and record cool daily high temperatures set in December 2011 (from NCDC's daily records analysis).
![NOAA National Weather Service [NWS]](/img/climate/research/2011/dec/nws-ahps-pcp-amt-1231-1m-us.jpg)
![High Plains Regional Climate Center [HPRCC]](/img/climate/research/2011/dec/hprcc-pcp-amt-1231-1m-us.png)
Regional Discussion
December 2011 had a mixed precipitation pattern for the Hawaiian Islands. Above-normal rainfall on some islands shrank the percent of the state in moderate to extreme drought from 54 percent last month to 47 percent this month, but longer-term conditions remained drier than normal (last 2, 3, 6, 12, 24, 36 months), especially for the southern islands. December SPI values showed improvement for many locations and streamflow was generally near to above normal.
Most stations in Alaska were wetter than normal this month, resulting in the fifth wettest December in the 1918-2011 record, statewide. In spite of the recent wetness, precipitation deficits are evident at interior stations, especially at longer time scales (2, 3, 6, 12, 24, 36 months). However, snowpack and snow water content (for stations and basinwide) were generally near to above normal, and there was no drought or abnormal dryness indicated on the January 3rd USDM. Modeled soil moisture was still drier than normal in south central coastal to interior locations.
The southeastern and northwestern thirds of Puerto Rico were drier than normal during December. The dryness is evident at 2 and 3 months, especially in the southeast, but disappears at longer time scales (6 and 12 months). With streamflow near average, the January 3rd USDM map had no drought or abnormally dry areas on the island.
 |
 |
On a statewide basis, December 2011 ranked in the top ten driest Decembers for eight states in the West and Northern Plains, with two other states close behind (Minnesota at 12th driest and North Dakota at 13th driest). Five other states (including three in the Southeast — North and South Carolina and Georgia) ranked in the driest third of the historical record. The dryness in the West and Northern Plains to Upper Mississippi Valley extends back five to six months. Minnesota had the sixth driest start (October-December 2011) to the water year (October through the following September), with Oregon ranking eighth driest and California 11th driest. Three states in the West (Oregon at third driest, Idaho at fifth driest, and California at seventh driest) and one in the Upper Mississippi Valley (Minnesota at ninth driest) ranked in the top ten driest for the last six months (July-December 2011), with Montana and Georgia close behind at eleventh driest.
Beneficial December precipitation in the Southwest and Southern Plains improved the rankings for New Mexico and Texas. Statewide precipitation ranks for Texas are in the top ten driest category for July-December 2011 back to January-December 2011, but not for the time periods from August-December 2011 to December 2011. For New Mexico, only March-December, February-December, and January-December have 2011 statewide precipitation ranks in the top ten driest category. But the long-term deficits in Texas were so severe that, even with the December precipitation, the Lone Star State still had the driest March-December, February-December, and January-December in the 1895-2011 record. Four other states ranked in the top ten driest category for the year, including Georgia (fifth driest), New Mexico (sixth driest), Louisiana (seventh driest), and South Carolina (eighth driest), with Oklahoma close behind at eleventh driest. The December 2011 precipitation was enough to raise the annual (January-December 2011) ranking for the Rio Grande and Texas Gulf Coast river basins to second driest year in the 1895-2011 record.
 |
 |
During December, moderate to exceptional drought contracted slightly to cover 69 percent of the South region, 13 percent of the Midwest region, 18 percent of the High Plains region, and 47 percent of Hawaii, but increased to 46 percent of the Southeast region, 28 percent of the West, and 27 percent nationally. The two worst USDM drought categories (D3-D4, extreme to exceptional drought) shrank to 67 percent of Texas, 27 percent of Oklahoma, 23 percent of New Mexico, and 9 percent nationally.
On a more localized basis, record dryness occurred in at least one climate division during each of the twelve monthly time periods from December back to January-December. The locations were generally in the West, Northern Plains, or Upper Mississippi Valley for December back to June-December, and in the Southeast or Southern Plains from October-December back to January-December:

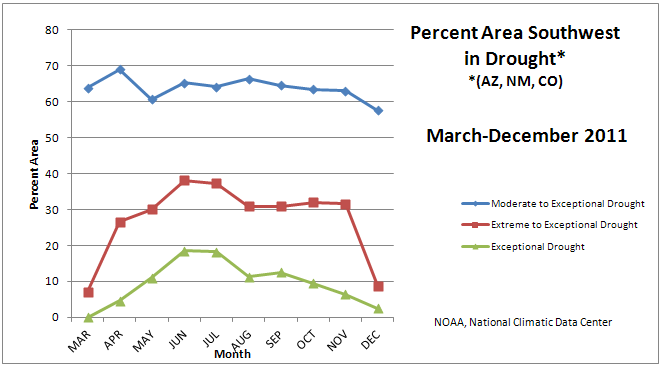
Percent area of the Western U.S. in moderate to extreme drought, based on the Palmer Drought Index.
An even larger part of the West was drier than normal during December 2011 than in November and October. The cumulative effect of these deficits resulted in a very dry start to the water year (October 2011-September 2012). This is evident in both the low elevation and high elevation (SNOTEL) station data. The last six months have been even drier based on the SPI (July-December 2011 versus October-December 2011). A southerly storm track during the month brought above-normal precipitation and snow pack to Arizona and New Mexico, but elsewhere (especially the Far West) the snow pack was well below normal. The previous water year (October 2010-September 2011) left the West with moist conditions in the north and dry conditions in the south, as reflected in end-of-September modeled soil moisture and PHDI. The first three months of the current water year, however, have seen considerable drying in both modeled soil moisture and PHDI, with low streamflow along the coast. According to the USDM, 28 percent of the West was experiencing moderate to exceptional drought at the end of December, a 9-point increase compared to November, while the Palmer Drought Index statistic was about 23 percent, an increase of about 9 percent as well. By the end of this month, there were two broad areas of drought in the West — moderate to exceptional drought in the Southwest and moderate drought from Oregon and Nevada into California. When the statistics for the Arizona-New Mexico-Colorado drought area (the Southwest drought area) are aggregated, the percent area in moderate to exceptional (USDM categories) drought fluctuated between 60 and 70 percent through November. It dropped below 70 percent in December. The percent area in the exceptional drought category has steadily declined since July and was near 3 percent at the end of this month. The extreme to exceptional drought area dropped significantly from 32 percent last month to 9 percent at the end of December.
A more detailed drought discussion, provided by the NOAA Regional Climate Centers and others, can be found below.
West — Upper Colorado River Basin — Pacific Islands
As noted by the Southeast Regional Climate Center, for the third straight month, precipitation was highly variable across the Southeast region. Monthly totals were between 100 and 150 percent of normal across western portions of Virginia and North Carolina and across sections of Alabama and North Georgia. Some locations across the Southern Appalachians recorded between 150 and 300 percent of normal precipitation for the month. In contrast, the driest locations across the Southeast were found across the eastern Carolinas and the Florida Peninsula, where monthly precipitation totals were less than 25 percent of normal. Charleston, South Carolina recorded only 0.65 inch (16.5 mm) of precipitation, making it the second driest December in a record extending back to 1938. Elsewhere across the region, monthly precipitation was between 25 and 75 percent of normal, including the western slopes and interior mountains of Puerto Rico.
Monthly average temperatures for December were above normal across the Southeast region. December ranked among the top 10 warmest on record at several locations across the region. Overnight temperatures were especially warm during the month, as over 200 daily high minimum temperature records were tied or broken across the region. Many of these occurred in the days before Christmas, which was in stark contrast to the cold and snow that struck the region one year earlier. The calendar year 2011 was exceptionally warm across a large portion of the Southeast region.
Drought conditions persisted across more than half of the Southeast region in December. The lack of rainfall across the Florida Peninsula contributed to the re-emergence of D0 (abnormally dry) conditions by the end of the month, forcing several communities to consider implementing additional water restrictions. The warm, dry weather facilitated the planting and growth of winter grains and vegetables, as well as the transport of harvested crops across the region.
As explained by the Southern Regional Climate Center, with a few exceptions, December was generally a wet month for the Southern region. Dry areas included southern Louisiana and southern Mississippi, eastern Oklahoma, and parts of western Texas. These areas generally averaged approximately 5-25 percent of normal precipitation for the month. The wettest part of the region included Arkansas, parts of southern and northern Texas, and western Oklahoma. Stations in these regions averaged between 150 and 400 percent of normal precipitation. Texas averaged 2.88 inches (73.15 mm) of precipitation, making it the nineteenth wettest December on record (1895-2011). It is also the second month in the year where precipitation for the state exceeded two inches (50.80 mm). Oklahoma experienced its 28th wettest December on record (1895-2011) with a state average precipitation total of 2.35 inches (59.69 mm). For Arkansas, it was the eighth wettest December on record (1895-2011) with a state average precipitation total of 7.47 inches (189.74 mm). Stations in the northeastern and southern areas of the state averaged between 150 and 250 percent of normal. Louisiana averaged 5.49 inches (139.45 mm) of precipitation, while Mississippi, averaged 5.99 inches (152.15 mm) of precipitation. Tennessee averaged 5.91 inches (150.11 mm) of precipitation for the month. State rankings for Louisiana, Mississippi, and Tennessee were all in the middle two quartiles. December was generally cooler than normal in Texas, northern Louisiana and in the Oklahoma panhandle. Elsewhere, conditions were generally slightly warmer than normal.
Drought conditions in the Southern region improved slightly from the previous month. Above-normal precipitation over much of the region led to improvements over western Louisiana, northwestern Texas, and northern Texas. As of January 3, 2012, only 17.24 percent of the Southern region was experiencing exceptional drought, which is approximately a twelve percent improvement over the end of November. The amount of extreme drought was also reduced by approximately eleven percent. Drier-than-normal conditions in southeastern Louisiana, however, resulted in the introduction of extreme drought over much of the Florida Parishes.
As summarized by the Midwest Regional Climate Center, December precipitation ranged from less than 25 percent of normal in some parts of Minnesota to more than twice normal in northwest Missouri and southern Iowa. Annual precipitation ranged from less than 75 percent of normal in northwest Minnesota to 150 percent of normal along the Ohio River Valley. Indiana, Ohio, and Kentucky recorded their wettest year statewide in 2011 (1895-2011 period). Ten cities along the Ohio River and northward to Lake Erie set new records for annual precipitation. December temperatures averaged 3 to 10 degrees F (2 to 6 degrees C) above normal across the Midwest with the largest departures in Minnesota. Temperatures were below normal early in December but well above normal for the last two-thirds of the month. Daily temperature records were almost exclusively record highs with 629 record highs and just 7 record lows. Annual temperatures were very close to normal for the entire region with all locations within 2 degrees F (1 degree C) of normal for the year.
As noted by the Northeast Regional Climate Center, December's precipitation total of 3.64 inches (92.5 mm) was 104 percent of normal. While this month's total was 0.17 inch (4.3 mm) above normal, it was 0.32 inch (8.1 mm) less than December 2010. This was the fifth consecutive wetter-than-normal December for the region. None of the states' precipitation totals departed far from normal — Delaware, at 94 percent of normal, was the driest state; and Pennsylvania was the wettest, with 113 percent of its normal precipitation amount. The Northeast's annual precipitation total of 55.14 inches (1400.6 mm) sent 2011 into the record book as the wettest year since 1895, surpassing 1996's total of 54.60 inches (1386.8 mm). This year's total was 10.97 inches (278.6 mm) wetter than normal. Four of the states hit hard by the tropical storms in August and September — Connecticut, New Jersey, New York, and Pennsylvania — also had their wettest year on record. Vermont saw its second wettest year since 1895 and Massachusetts its third. The region averaged 124 percent of normal in 2011; state percentages ranged from 109 percent in Delaware to 136 percent in New Jersey and Pennsylvania.
December's average temperature of 34.1 degrees F (1.2 degrees C) was 5.3 degrees F (2.9 degrees C) above normal and 9.0 degrees F (5.0 degrees C) warmer than December 2010. It was the warmest December since 2006 (2006 was the warmest December since 1895) and the sixth warmest December since recordkeeping began in 1895. In addition, it was the ninth consecutive month to average warmer than normal. Each of the states in the Northeast was warmer than normal. The Northeast's average annual temperature in 2011 was 49.0 degrees F (9.4 degrees C), which was 1.5 degrees F (0.8 degrees C) above normal and only one degree F (0.6 degrees C) less than the warmest year, 1998. This year was the Northeast's 9th warmest since 1895.
As explained by the High Plains Regional Climate Center, December was an interesting month across the High Plains Region. The northern areas of the region were generally drier and warmer than normal and many areas did not experience a White Christmas. The lack of snow cover, not just in the High Plains Region, but also in areas north into Canada, contributed to the unseasonably warm temperatures. The Dakotas had the largest temperature departures in the region, ranging from near normal in the southwest corner of South Dakota to over 12 degrees F (6.7 degrees C) above normal in northern and northeastern North Dakota. Meanwhile, the western areas of the region were generally colder than normal with temperature departures at least 6 degrees F (3.3 degrees C) below normal occurring in areas of southern Colorado and Wyoming.
Precipitation was varied across the region this month. The Dakotas were generally drier than normal, with a few isolated pockets receiving above normal precipitation. The ongoing dry conditions in eastern North Dakota led to the expansion of moderate drought conditions (D1). Meanwhile, heavy rain and snow across Kansas and southern Colorado helped alleviate and in some cases eliminate drought conditions. Precipitation was a welcome sight in drought-stricken areas of Colorado, Kansas, and southeast Nebraska. This month, the heaviest precipitation in the region fell in a large swath that stretched from southeastern Colorado, through Kansas, and into southeastern Nebraska. The majority of the locations in this swath received 200-400 percent of normal precipitation, while clusters of locations in Kansas and Colorado received 400-800 percent of normal precipitation. Numerous locations ranked in the top 10 wettest Decembers on record and many had precipitation totals which were ranked second and third wettest. Snowfall totals for the month of December also ranked in the top 10 across some areas of Kansas and Colorado. At least one location had its snowiest December on record — Pueblo, Colorado. Pueblo received 18.6 inches (47 cm) of snow this month, which beat out the old record of 18.2 inches (46 cm) set all the way back 1913 (period of record 1888-2011).
The USDM had many changes this month. Storm systems bringing beneficial rain and snow to Colorado and Kansas led to the erasure of all exceptional drought conditions (D4) in those states. In addition, extreme drought conditions (D3) were also erased in Colorado. Other major changes occurred in Kansas as well, as all drought conditions were eliminated in the north and the drought conditions that remained were contracted to the south somewhat. Southeastern Nebraska also benefitted from the December precipitation as drought conditions were erased for a large portion of that area. Meanwhile, due to an ongoing lack of precipitation in North Dakota, moderate drought conditions (D1) expanded northward in the eastern side of the state. Drought conditions in South Dakota remained largely the same since last month, with the exception of a slight expansion of abnormally dry (D0) and D1 conditions in the southeast.
As summarized by the Western Regional Climate Center, dry and generally cool conditions were observed in much of the West this month as high pressure dominated the region. A series of cutoff low-pressure systems moved across the Southwest during the first half of the month, bringing above normal precipitation to Arizona, New Mexico, and Southern Colorado. But precipitation was below normal in much of the rest of the West this month. A series of storms passed through the Pacific Northwest during the last week of the month, staving off near-record dryness, but still the region had only about half the average for the month. Many locations in California and Nevada experienced record or near-record dry conditions. Reno, Nevada reported its lowest December total (not even a trace) in 129 years (1883 and four prior years also had no precipitation). Fresno, California reported no measurable precipitation for the second time since 1878 (tied with 1989). Downtown San Francisco received 0.14 in (3.6 mm), the third driest December since 1849, behind only the 0.00 readings of 1876 and 1989. San Jose (second driest since 1874) and Sacramento (sixth driest since 1849) also had a notably dry month, and an index of 8 Sierra Nevada stations recorded its second lowest December total since 1920, and fourth lowest July-December.
December temperatures were below normal in much of the West with the notable exception of the upper Missouri River Basin. During the second half of the month, many locations in Montana saw positive temperature departures from normal in the double digits. A number of locations in New Mexico and southern Colorado experienced cold conditions, many 6-10 F (3-6 C) below normal. With clear skies in western portions of the region, daytime highs were well above average, and nighttime lows were well below average.
Upper Colorado River Basin: As reported by the Colorado Climate Center, the January 3rd NIDIS (National Integrated Drought Information System) assessment for the Upper Colorado River Basin (UCRB) indicated that, for the month of December, precipitation favored the southern and western portions of the UCRB. The San Juan mountains and the Four Corners region received around 100 percent of its average December precipitation. Areas in eastern Utah and southwest Wyoming received over 150 percent of average precipitation for the month. Northwest Colorado was much drier in December, with most areas receiving less than 50 percent of average. The drought-stricken southeast Colorado saw significant improvement, with most of the region receiving over 200 percent of average precipitation for the month. Water-year-to-date SNOTEL precipitation was near average for the southern part of the UCRB and below average for much of the northern portions of the basin. Around the headwaters of the Colorado River, very little snow has accumulated since the beginning of December. With accumulations stagnating, the headwaters region (along with many other central and northern regions of the UCRB) was experiencing below average snowpack. Snowpack accumulations were now less than they were at the end of December during the 2002 drought year. As of January 1st, 91 percent of the USGS streamgages in the UCRB recorded normal (25th-75th percentile) or above normal 7-day average streamflows, while 9 percent of the gages in the basin were recording below normal flows. Much of the UCRB experienced colder-than-average temperatures for the month of December. The VIC model continued to show dry soil moisture conditions in southeast Colorado and in Utah around the Colorado River valley. Drying conditions were also showing up in southern Wyoming. Even though wet soils were still being observed over the Colorado Headwaters region, the spatial extent was decreasing and the soils were beginning to dry a little. All of the major reservoirs above Lake Powell were above their January averages. Except for Navajo and Lake Granby, all of the major reservoirs in the UCRB were above their storage levels for the same time last year. Flaming Gorge, Granby, Navajo and Dillon have stayed near steady for the month, while Blue Mesa, Green Mountain, and Lake Powell have seen larger decreases. Lake Powell was currently at 66 percent of capacity and 86 percent of average.
Pacific Islands: According to reports from National Weather Service offices, the Pacific ENSO Applications Climate Center (PEAC), and partners, conditions varied across the Pacific Islands.
As noted by the National Weather Service office in Honolulu, persistent trade winds brought abundant amounts of rain to the east-facing slopes of the main Hawaiian Islands. Many of the leeward slopes, especially on the Big Island and Maui, received very little rain. As a result, extreme drought, or D3 category conditions on the USDM map, continued in the south Kohala district and the Pohakuloa region of the Hamakua district. Some of the windward rainfall managed to push into leeward areas of the north Kohala district resulting in a retreat of drought conditions from this portion of the Big Island. Rainfall also occurred over the Kau district in sufficient amounts to result in an improvement from extreme drought to severe drought, or D2 category conditions. Severe drought continued in the north Kona district while moderate drought, or D1 category conditions, remained in place over portions of the south Kona district. Like the Big Island, west-facing slopes of Maui stayed dry in December despite wet conditions along the east-facing slopes. Extreme drought maintained its grip on a small section of southwestern Haleakala from Kamaole to Ulupalakua and severe drought continued over the lower elevations of west Maui from Maalaea through Lahaina. The increase in windward rainfall helped raise water levels in the Waimanalo reservoir but not enough to remove the severe drought classification for east Oahu.
Some drought impacts in Hawaii include the following:
- On Kauai, there were no significant drought impacts as conditions have improved over the past month.
- On Oahu, the water supply in the Waimanalo reservoir increased enough during December to warrant an easing of mandatory water use restrictions from a 20 percent cutback to a 10 percent cutback.
- On Molokai, no significant changes since the December 8 update. The State of Hawaii Department of Agriculture continued to keep in place the mandatory 30 percent cutback in irrigation water consumption for the Kualapuu reservoir system.
- On Lanai, no significant changes since the December 8 update. No additional impact information has been received.
- On Maui, pastures and vegetation remained dry over the leeward slopes of Haleakala especially from Kamaole to Ulupalakua. Water supply levels for upcountry Maui improved significantly during December due to an increase in windward Haleakala rainfall. However, the Maui County Department of Water Supply has maintained their call for a 5 percent reduction in water use. The request for a 10 percent reduction in water use by central and south Maui residents also remained in effect.
- On the Big Island, pastures and general vegetation from Kawaihae to Pohakuloa were in very poor condition and brush fires continued to be a significant concern. Ranchers in these areas have already destocked cattle and water hauling operations have been ongoing for several months. South Kau finally received significant rainfall and some recovery has occurred but more rainfall is needed.

On other Pacific Islands, December was drier than normal in Pago Pago and Kwajalein and slightly below normal in Koror, but near to above normal at most other locations. Annual 2011 rainfall was near to above normal at most locations.
| Station Name | Jan 2011 | Feb 2011 | Mar 2011 | Apr 2011 | May 2011 | Jun 2011 | Jul 2011 | Aug 2011 | Sep 2011 | Oct 2011 | Nov 2011 | Dec 2011 | Jan-Dec 2011 |
| Chuuk | 76% | 137% | 156% | 109% | 66% | 218% | 124% | 147% | 120% | 80% | 135% | 129% | 123% |
| Guam IAP | 205% | 166% | 138% | 142% | 95% | 96% | 195% | 109% | 121% | 128% | 75% | 97% | 127% |
| Kapingamarangi | 22% | 2% | 61% | 74% | 69% | 247% | 199% | 214% | 181% | 111% | 92% | 139% | 104% |
| Koror | 163% | 145% | 170% | 130% | 180% | 129% | 166% | 145% | 269% | 107% | 61% | 88% | 145% |
| Kosrae | 82% | 67% | 51% | 74% | 151% | 114% | 76% | 105% | 86% | 104% | 82% | 194% | 97% |
| Kwajalein | 119% | 316% | 277% | 49% | 91% | 121% | 100% | 135% | 101% | 122% | 137% | 70% | 121% |
| Majuro | 100% | 190% | 188% | 28% | 109% | 97% | 118% | 106% | 108% | 107% | 125% | 90% | 110% |
| Pago Pago | 183% | 110% | 52% | 36% | 35% | 132% | 40% | 60% | 26% | 126% | 143% | 72% | 90% |
| Pohnpei | 98% | 125% | 148% | 47% | 95% | 128% | 85% | 120% | 97% | 72% | 124% | 111% | 102% |
| Saipan | 182% | 124% | 164% | 209% | 154% | 174% | 110% | 120% | 64% | 131% | 51% | 97% | 116% |
| Yap | 164% | 123% | 171% | 129% | 169% | 113% | 157% | 133% | 155% | 101% | 112% | 106% | 135% |

[top]
State/Regional/National Moisture Status
A detailed review of drought and moisture conditions is available for all contiguous U.S. states, the nine standard regions, and the nation (contiguous U.S.):
| northeast u. s. | east north central u. s. | central u. s. |
| southeast u. s. | west north central u. s. | south u. s. |
| southwest u. s. | northwest u. s. | west u. s. |
| Contiguous United States |
[top]
Drought Indicators
- Palmer Drought Indices
- Standardized Precipitation Index
- long-term (36 to 60 month) percent of normal precipitation maps
- airport station percent of normal precipitation maps
- statewide precipitation rank maps
- Cooperative station percent of normal precipitation maps
- percent of average maps for the SNOTEL stations in the western mountains provided by the Western Regional Climate Center
- hydrologic year precipitation
- snow water equivalent of snowpack
- satellite-based observations of vegetative health
- National Weather Service model calculations of soil moisture, runoff, and evaporation
- National Weather Service model calculations of soil moisture using the Leaky Bucket Model
- Midwest Regional Climate Center model calculations of soil moisture
- topsoil moisture conditions observed by the USDA and mapped by the Climate Prediction Center
- pasture and range land conditions observed by the USDA and mapped by the Climate Prediction Center
- streamflow maps maintained by the USGS
[top]
Contacts & Questions