Contents Of This Report:
Map showing Palmer Z Index

Top of Page National Overview


Top of Page Detailed Drought Discussion


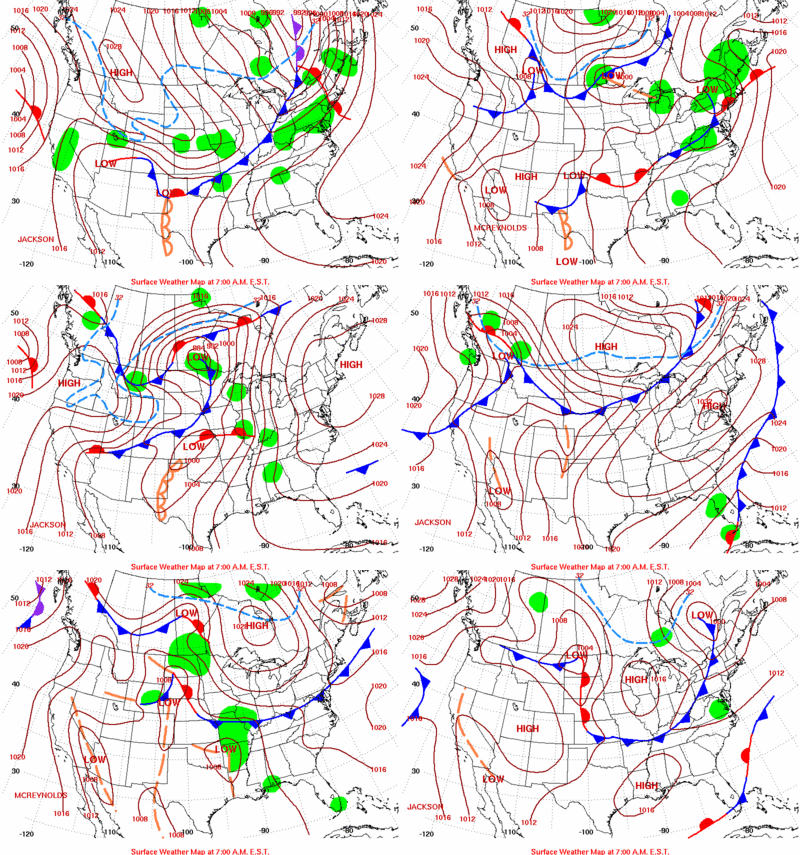
The weather patternweather pattern over the contiguous United States for May began with a generally westerly flow in the atmosphere that shifted northward by the end of the month. Strong low pressure systems and associated fronts, embedded in this west-to-east circulation, brought precipitation to parts of the West and widespread precipitation to the Mid-Mississippi Valley to East Coast, which especially benefitted the drought and abnormally dry areas in the east (June 2 USDM versus April 28 USDM).

U.S. precipitation anomalies, May 2009 June 2, 2009 U.S. Drought Monitor

The month was drier than normal across eastern, southern, and central parts of Puerto Rico. This precipitation pattern was also evident for the last 60 days, 90 days, and 180 days. The Hawaiian Islands were generally drier than normal for May and the last 3 months, but a mixed pattern dominated for the last 6 to 12 months. Streamflows were generally much below normal across the islands. The precipitation pattern for Alaska was generally drier than normal for May with above normal conditions in some interior locations. Dryness in the south was evident for the last 3 months, but the pattern was mixed for the last 6 and 12 months.

By the end of May, the core drought areas included:
  • the southern Plains, with moderate to extreme drought;
  • south central Texas, where widespread extreme to exceptional drought was entrenched;
  • portions of the northwestern Great Lakes/Upper Mississippi Valley, where moderate to severe drought persisted;
  • parts of the West, with moderate to severe drought;
  • southern coastal Alaska, with moderate drought developing; and
  • Hawaii, where moderate to severe drought continued across the central and eastern islands.
For early June, according to USDM statistics, moderate drought affected 2 percent of Alaska; moderate to severe drought affected 43 percent of Hawaii, 23 percent of the West, and 7 percent of the Midwest; and moderate to exceptional drought affected 23 percent of the South. Less than one percent of moderate drought lingered in the High Plains (Wyoming) and Southeast (southern Florida).

A number of drought indices and impact indicators are used to assess drought conditions. Soil moisture conditions are estimated by several models (LDAS surface layer, LDAS deeper layer, CPC U.S. soil moisture, CPC North America soil moisture) and by USDA observations (topsoil conditions, compared to 5-year mean, compared to 10-year mean). The models are consistent in showing dry soil conditions in Texas and parts of the West, with the LDAS model indicating surface soil conditions becoming drier in the central Plains. These models, and the soil moisture model by the Midwest Regional Climate Center (surface layer, deeper layer), showed how dry soils lingered in Minnesota and northwestern Wisconsin. USDA reports indicated 50 percent to 75 percent of topsoil moisture in Texas and New Mexico was rated very short to short, but conditions markedly improved over Florida and other eastern states. A third to half of the topsoil moisture was rated very short to short in Oregon, Montana, South Dakota, and Minnesota, which is generally above the 5- and 10-year average. The dry soils adversely impacted agriculture, pasture and range land, and natural vegetation in the southern Plains, Upper Mississippi Valley, and much of the West. A third to two-thirds of the pasture and range land was rated in very poor or poor condition across Texas to California by the end of May. June 1, 2009 root zone soil moisture percentile from the LDAS Mosaic model

May 31, 2009 USDA topsoil moisture short-very short

June 1, 2009 Vegetation Drought Response Index

May 31, 2009 USDA observations of pasture and range land in poor or very poor condition

May 2009 USGS mean streamflow
As of May 31, much of California and parts of the Northwest had gone two or more weeks without significant rainfall. Extended dry spells (2 weeks or longer) occurred in May over parts of the central and southern Plains, Pacific Northwest, and much of the Southwest. Rain fell on just a few days this month in California and Nevada, but May does mark the beginning of the dry season across much of the area. Streamflow levels (both modeled and observed) were significantly low across Hawaii and parts of the southern Plains, and below normal across parts of the Upper Mississippi Valley, Northeast, and Northwest. Data from the USGS network of wells indicated the continued presence of below-normal groundwater levels across parts of the East, Plains, and West, suggesting that hydrological impacts may still linger in areas with improving drought conditions.

1-month Standardized Precipitation Index, May 2009 2-month Standardized Precipitation Index, May 2009 3-month Standardized Precipitation Index, May 2009

The dryness in the northern and central Plains during May was a continuation of dry spring conditions for some states. May dryness in the southern Plains marked a continuation of dry conditions that have dominated the last 12 to 24 months in some areas. The heavy rains of the last two to three months have erased the deficits over much of the Southeast back to 12 months, but long-term (24-month) deficits remained. Beneficial precipitation occurred over parts of the West during May, but deficits continued in the short term (2 months, 3 months) and long term (12 months, 24 months, 36 months, even 60 months).

6-month Standardized Precipitation Index, May 2009 9-month Standardized Precipitation Index, May 2009 12-month Standardized Precipitation Index, May 2009

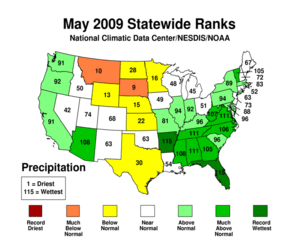
May 2009 statewide precipitation ranks The May dryness in the northern Plains was severe enough to rank two states in the top ten of the historical record: South Dakota (eighth driest) and Montana (tenth driest). The West North Central region ranked sixth driest for May 2009. State-level dryness was evident in the Great Plains and West for spring (March-May 2009), and across the West, Northeast, and parts of the Great Plains for the year to date (January-May 2009). New Jersey ranked twelfth driest for January-May 2009 and eleventh driest for February-May 2009. For the contiguous U.S., 2009 had the 22nd wettest May and 24th wettest spring, but 36th driest January-May in the 1895-2009 record.

South Dakota precipitation, May, 1895-2009 New Jersey precipitation, February-May, 1895-2009

While beneficial May precipitation fell over parts of the West, other areas were dry. Water year-to-date (October 2008-May 2009) precipitation was near average for most river basins but near to below average based on statewide ranks. The end-of-spring mountain snowpack was below average for much of the West, but still near to above average for parts of the north. Long term (12 months, 24 months, 36 months) deficits, which remained across much of the West, were reflected in some June 1 reservoir conditions. As summarized by the USDA Natural Resources Conservation Service, statewide reservoir levels were above average in Arizona, Colorado, and Washington, but below average in Montana, Nevada, New Mexico, Oregon, and Utah. The California Department of Water Resources reported below-average reservoir levels in the northern and western areas of the state, but near-average levels along the Sierra Nevada and in the south. The 2008-2009 water year-to-date (October 2008-May 2009) ranked 20th driest for California. But this year marks the third consecutive dry water year (October-September). The 32-month period, October 2006-May 2009, ranks as the second driest such period in the 1895-2009 record.

According to the Palmer Drought Index, about 44 percent of the region was in moderate to extreme drought at the end of the month, while the USDM estimated the statistics at about 23 percent in moderate to exceptional drought and about 53 percent experiencing abnormally dry to exceptional drought conditions. The differences between the Palmer and USDM statistics are due to the extreme seasonality of precipitation in the West and other hydrologic components in the drought calculations.
May 31, 2009 SNOTEL snow water equivalent
California statewide precipitation, 32-month periods October-May, 1895-2009
Percent area Western U.S. in moderate to extreme drought and wet spell, based on Palmer Drought Index, January 1996-present

A more detailed drought discussion, provided by the NOAA Regional Climate Centers and others, can be found below.


SOUTHEAST DROUGHT

According to the Southeast Regional Climate Center, much of the region received above normal precipitation totals for May, with many local records broken. Below normal precipitation totals for the month were confined to small portions of eastern and central North Carolina, central Georgia, and the western panhandle of Florida. The heavy precipitation observed across much of the region provided continued relief from the lingering drought across small portions of the Southeast. The area of extreme drought (D3) in southwestern Florida was reduced to moderate drought (D1). The small region of moderate drought (D1) in western North Carolina and extreme northeast Georgia disappeared, although abnormally dry conditions persisted across portions of the region. A few groundwater monitors southwestern North Carolina indicated that water table levels there had not fully recovered.

SOUTHERN REGION DROUGHT

As noted by the Southern Regional Climate Center, approximately half of the region experienced above-normal precipitation totals, while the other half had below-normal rainfall. Most of western Oklahoma and almost all of Texas were drier than normal, with a majority of stations reporting less than half the monthly normal. The driest areas of the Southern Region included eastern Texas, northern Texas and western Oklahoma, where precipitation totals ranged from 5 to 50 percent of normal. The drought pattern in the Southern Region for the month of May was only slightly different from that of the previous month. Over the course of May, there was some reduction of extreme and exceptional drought in southern Texas and some improvement in the Trans Pecos climate division of Texas, where above normal monthly precipitation totals were observed. In north central Texas, a small bullet of extreme drought remained from last month; however, there was a significant reduction in the area of severe drought that surrounded it.

MIDWEST DROUGHT

As explained by the Midwest Regional Climate Center, precipitation varied from below 50 percent of normal in northwest Iowa, central Minnesota, and northwest Wisconsin to nearly 200 percent of normal in eastern Kentucky and south of the confluence of the Mississippi and Ohio Rivers. Northwest Minnesota was also well above normal for the month. Dry conditions persisted across southern Minnesota, northwest Wisconsin, and Upper Michigan in May extending the drought in those areas.

Prolonged drought in northern Wisconsin has resulted in some lakes reaching their lowest levels in 70 years and has contributed to a surge in forest fires (Milwaukee Journal Sentinel, 5/23).

HIGH PLAINS REGION DROUGHT

As noted by the High Plains Regional Climate Center, May 2009 was a month of record-setting dryness across the High Plains region as a weak precipitation pattern dominated. Most of the region received less than 70 percent of normal precipitation and large swaths received less than 50 percent of normal precipitation. Ultimately, several locations across the region recorded the driest May on record. This month's extreme dry location was Wamego 4W, Kansas which broke a 108-year record by receiving only 0.52 inch (13.2 mm) of precipitation. The old record of 0.92 inch (23.4 mm) was set back in 1901. While the vast majority of the High Plains region was dry, western Colorado and small portions of Kansas, Nebraska, and North Dakota received above-normal precipitation. With a dry May and dry weather in earlier months, many locations were 3-6 inches (76-152 mm) below normal for the year. In eastern Nebraska, the Lincoln airport station had the second driest January-May in the 44-year record while the Omaha airport station was fifth driest out of 74 years. The combination of cool temperatures and ample soil moisture staved off drought conditions, but stress on some emerging crops became evident this month. Abnormally dry conditions (D0) in eastern Nebraska and north-central Kansas expanded to include much of South Dakota and a portion of the Nebraska panhandle. In the western portion of the High Plains region, drought conditions improved. In south-central Colorado, moderate drought conditions (D1) were downgraded to D0 and portions of the D0 in both Wyoming and Colorado were erased.

WESTERN DROUGHT

As summarized by the Western Regional Climate Center, the precipitation pattern for May was a mix of above and below normal. May was wetter than usual for most of Arizona, southwest New Mexico, Northern California, the coastal Pacific Northwest, and a large area centered around the Four Corners. Most of New Mexico and Utah were below normal. Conditions were especially dry in much of Nevada and in southern California, as well as all of Montana and most of Wyoming. It was the third driest May on record in Billings, Montana going back to 1948. Parts of the Southwest experienced the wettest May on record while other Southwest locations received little or no rain.

Throughout the first week of May, numerous Alaskan Rivers flooded due to ice jams, inundating many towns. The Yukon River in Eagle rose to 20 feet above flood stage, which was 10 feet above the old record set in 1937.

California: End-of-May data provided by the California State Climatologist indicated that "statewide reservoir storage, precipitation, and water supply conditions have improved somewhat in May; however, allocation estimates to state and federal water contractors are expected to be near record lows for 2009, and reliance on local groundwater has and will continue to be above average. Runoff for this water year is expected to be much lower than average for the third year in a row, and drought conditions remain serious across the state." (California's Drought Update, Drought Operations Center, 5/29/09)

NORTHEAST DROUGHT

As noted by the Northeast Regional Climate Center, precipitation totals were above normal in much of the region, breaking a string of dry months. The Northeast, on average, received 4.67 inches (118.6 mm) of rain, which was 117 percent of normal. While Vermont was the driest state in April, it was the wettest in May, with 144 percent of the normal May rainfall amount. Connecticut (87 percent) and Rhode Island (79 percent) were the driest states this month. Only a small portion of northeastern Pennsylvania, northern New Jersey, and a bit of New York along the Pennsylvania-New Jersey border had abnormally dry conditions according to the USDM dated June 2, 2009. For spring (March-May), the region's three-month precipitation average was 10.30 inches (261.6 mm), or 93 percent of normal. West Virginia (105 percent), Maryland (102 percent) and Delaware (100 percent) were the only states at or above normal. With 75 percent of the normal spring precipitation amount, Connecticut was the driest state.


Top of Page State/Regional/National Moisture Status


A detailed review of drought and moisture conditions is available for all contiguous U.S. states, the nine standard regions, and the nation (contiguous U.S.):

STATES:
Alabama Arizona Arkansas California Colorado Connecticut
Delaware Florida Georgia Idaho Illinois Indiana
Iowa Kansas Kentucky Louisiana Maine Maryland
Massachusetts Michigan Minnesota Mississippi Missouri Montana
Nebraska Nevada New Hampshire New Jersey New Mexico New York
North Carolina North Dakota Ohio Oklahoma Oregon Pennsylvania
Rhode Island South Carolina South Dakota Tennessee Texas Utah
Vermont Virginia Washington West Virginia Wisconsin Wyoming


REGIONS:
Northeast Region East North Central Region Central Region
Southeast Region West North Central Region South Region
Southwest Region Northwest Region West Region
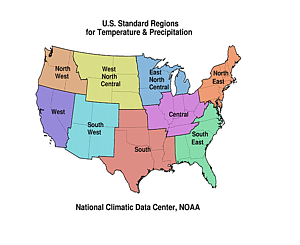
Map showing the nine U.S. standard regions
NATIONAL:
Contiguous U.S.


Top of Page Pre-Instrumental Perspective


There is no May 2009 Paleoclimatic Perspective.


Citing This Report

NOAA National Centers for Environmental Information, Monthly Drought Report for May 2009, published online June 2009, retrieved on April 18, 2024 from https://www.ncei.noaa.gov/access/monitoring/monthly-report/drought/200905.