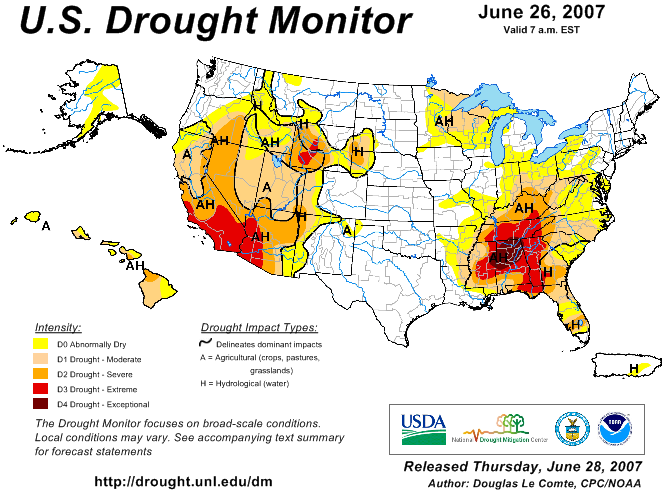
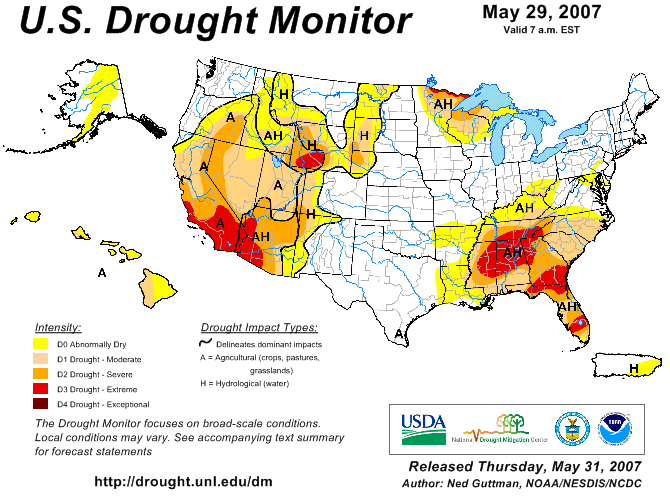
At the end of June,
severe to extreme drought remained concentrated in the Southeast,
Southwest, and the western High Plains, as shown on the June 26 U.S.
Drought Monitor map. Severe to extreme short-term
dryness covered large parts of the country in June and led to
worsening conditions in areas that included the Midwest, Southeast,
and areas of the West.
Eight of
nine climate regions in the contiguous U.S. were drier than
average in June and seven of
nine were warmer than average. The combination of warmer and
drier than average conditions brought much of Kentucky and
surrounding areas from abnormally dry conditions in late May into
severe drought. Drought conditions also worsened throughout large
parts of the Southeast, including northern Alabama, where
exceptional drought (the highest classification of drought) was
widespread. Compare the May 29 and
June
26 U.S. Drought Monitor maps to see these and other changes in
drought severity that occurred in June.
Drought in the Southeast
region developed within the past several months. The 6-month
Standardized Precipitation Index reflects the lack of rainfall
since the start of the year. SPI values less than -2 stretched from
eastern Kentucky to parts of southern Mississippi, reflective of
drought conditions that occur less than once every 50 years. For
the Southeast region as a whole, only 15.8
inches of precipitation fell during the first half of the year.
This was nine inches less than normal and only 0.1 inches more than
the lowest January-June precipitation total since records began in
1895; the record low occurred in 1898.
As shown in the statewide precipitation rank map below, four
southeastern states were much drier than normal for the
year-to-date period and two (Mississippi and Alabama) had their
driest such period on record. Only 16.3
inches of precipitation fell in Mississippi while 15.4
inches fell in Alabama, both totals only slightly more than
half the 20th century average for each state.
The Southeast region had it's driest
April-June on record, and below average precipitation also
stretched into the Midwest and parts of the Northeast, as shown in
the 3-month
statewide precipitation rank map.
Five states in the Midwest and Northeast regions (WI, IN, OH, KY,
and MD) were much drier than average for the same 3-month period.
The large extent of the anomalously dry conditions are also evident
in the 3-month SPI map above. However, near the end of June
widespread drought had yet to develop throughout much of the
Northeast and Midwest as depicted in the June 26, 2007
U.S. Drought Monitor.
|
|
As shown in the statewide
rank map below, June precipitation totals were below average in
much of the western U.S., as seven of the 11 western states fell
within the drier than average tercile. This continued a pattern of
below average precipitation that has persisted throughout the West
since last year. This is reflected in the map of January-June
precipitation rankings and the rankings
for the past 12 months (July 2006 - June 2007).
Los Angeles, California had its driest rain season (July to June)
in its 130-year record. Only 3.21 inches of precipitation fell from
July 1, 2006 through June 30, 2007, almost one foot below the
normal total of 15.14 inches. This broke the previous record low of
4.42 inches, which was set during the 2001-2002 season.
Although reservoir levels throughout much of California remain
above average due to abundant snowfall that fell in the Sierra
Nevada, Cascades, and Central Rockies during 2005-2006, the
extremely dry cold season of 2006-2007 is having impacts throughout
California and much of the West. In Oregon, very low river levels
on the Columbia and Willamette rivers (Portland/Vancouver areas)
are a possibility this summer and fall, according to the National
Weather Service office in Portland, prompting notices to recreation
and navigation interests. In Los Angeles, California, where
approximately 50% of its water is supplied by melting snowpack from
the Sierra Nevada mountains, mandatory water restrictions may soon
be needed, according to..
Drought impacts in the Southeast include a ban on fireworks and
open burning in 33 Alabama counties, and the initiation of a stage
3 water emergency plan in Birmingham and surrounding counties on
June 7. Measures include a 200% surcharge for water use above 8977
gallons per month and limits on hand-watering to twice a week.
These and hundreds of other impacts throughout the U.S. are
summarized by the
National Drought Mitigation Center's Drought Impacts
Reporter.
Drought conditions are also reflected in several indicators,
including: divisional precipitation conditions as shown above, low
soil moisture (modeled
and
observed), streamflow (modeled
and observed),
and snow-year
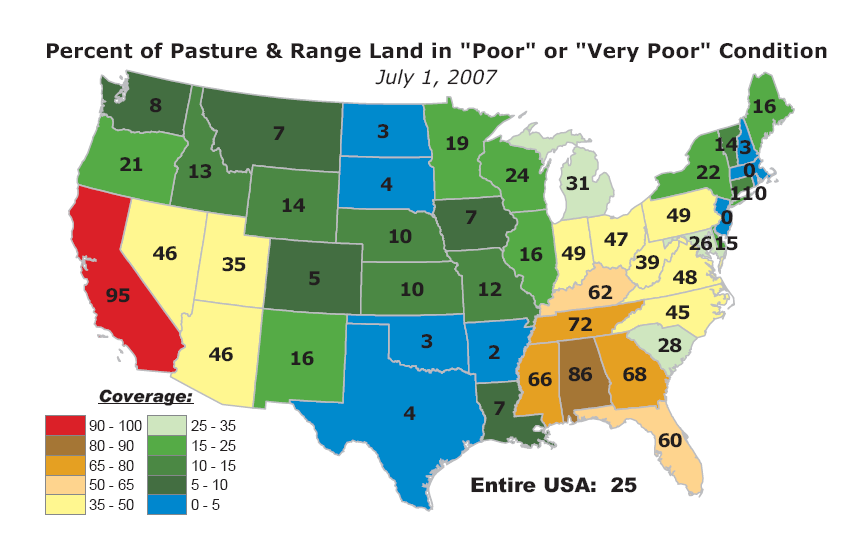
precipitation, stressed
vegetation, numerous large wildfires (June Wildfire Summary)
deteriorating pastures. As of July 1, 95% of the pastures were
in poor to very poor condition in California and, in Georgia, at
86%.
|

