| Contents Of This Report: |
 |

|

|
|
|
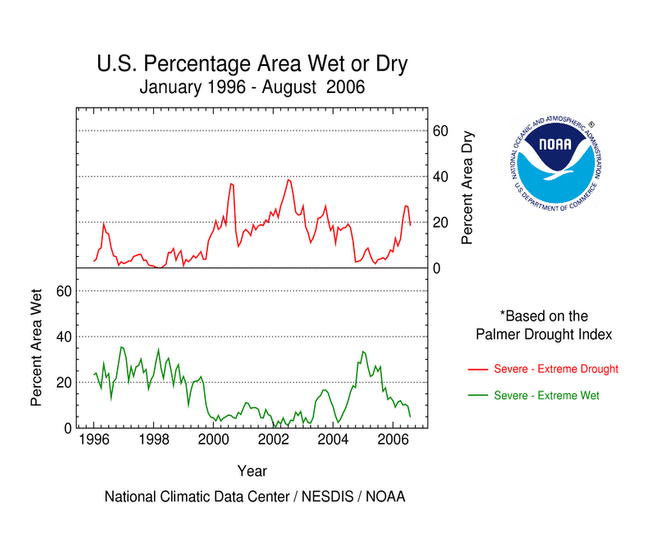
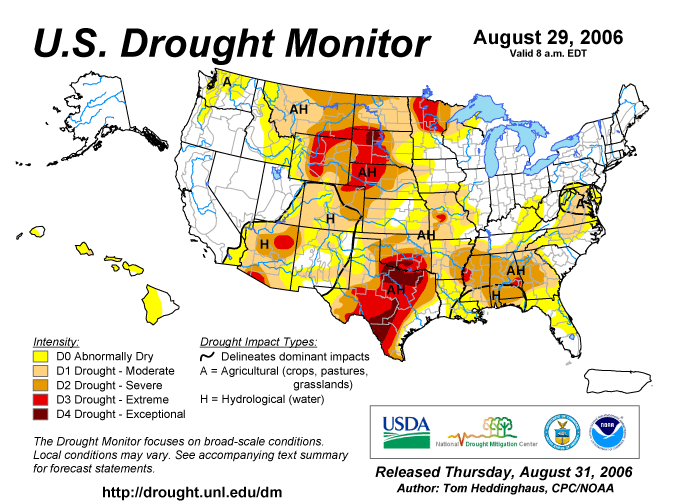
By the end of August,
drought was concentrated in the Plains from Texas to the Dakotas
and across the Southeast from Texas to Georgia (August 29 Drought
Monitor). In the drought areas, soil
moisture was low, evaporation
was high, vegetative
health was poor, and
streamflow in the Southeast was especially low.
Monsoon rain and Tropical
Storm Ernesto alleviated dryness in the Southwest and along the
Atlantic coast.
Drought impacted many sectors of the economy. Crops were highly stressed or dying, livestock was dying or prematurely sold because of a lack of feed and water, and water restrictions were common in many areas. Disaster conditions have been declared by the governors of several states. The USDA plans to distribute about $100,000,000 to farmers and ranchers. Companies whose sales indirectly depend on precipitation, such as lawn mower manufacturers, have partially shut down because of reduced demand. Low water in the Mississippi River affected transportation of farm products, petroleum, steel and ore. Impacts in drought-stricken areas have been collected and summarized by county at the National Drought Mitigation Center's Drought Impact Reporter.
The August precipitation pattern at the primary stations in Alaska was above normal across most of the state; the northwest coastal stations were below normal. In Hawaii dryness continued throughout most the State. In Puerto Rico the month was predominantly dry in the central and eastern interior areas and along the southern coast (based on National Weather Service radar estimates of precipitation). |
Some regional highlights:
|


|
| A detailed review of
drought and moisture conditions is available for all contiguous U.S.
states, the nine standard regions, and
the nation (contiguous U.S.): STATES: REGIONS:

|
|
|
|
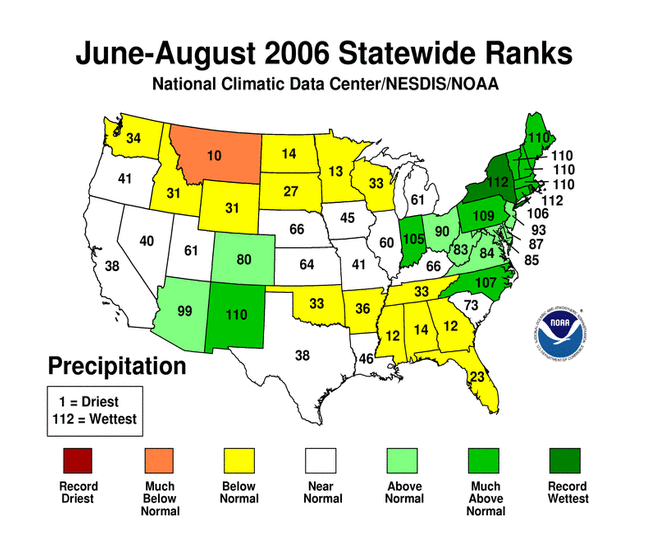
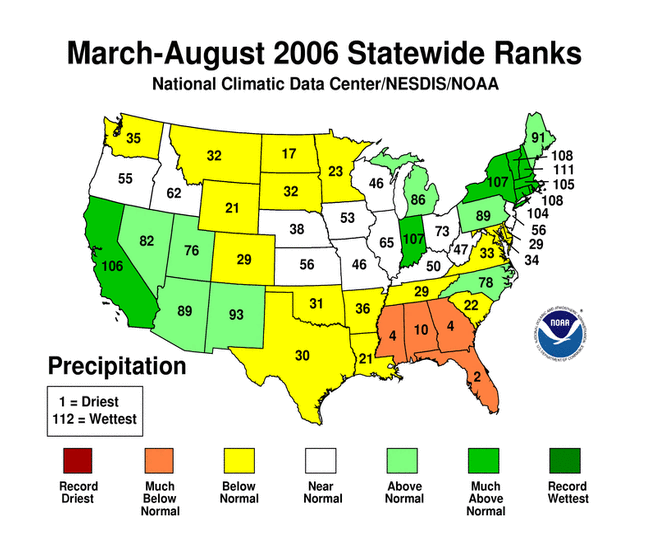
| Severe drought conditions have gripped much of Oklahoma and north Texas since September 2005. In Texas Climate Division 3 (north central), precipitation for the past 12 months was only 64% of normal, the driest September-August period since 1956. The U.S. Drought Monitor for late August/early September showed north central Texas to be in category D4, "exceptional drought". The average monthly Palmer Hydrological Drought Index (PHDI) for Texas Division 3 for June-August 2006 was -4.34, which according to the PHDI scale is "extreme drought". |
 large image |
|
 large image  large image |
| The graph below shows the summer (June-August) PDSI, 1896-2006, for Texas Division 3 (annual values in light blue, 5-year weighted average in dark blue). The value for 2006 is the lowest since 1956 (-5.91), which was the most severe summer drought on record. The most persistent drought was in the 1950s, when summer PDSI was negative (in fact, below -2) for six years in a row (1951-1956; yellow arrow). |
 large image (50 KB) |
The graph to the left also shows a 329-year tree-ring reconstruction (1650-1978) of summer PDSI for a gridpoint (32.5 N, 97.5 W) within Texas Division 3 (annual values in light red, 5-year weighted average in dark red). The reconstruction is one of over 200 developed by Cook et al. (1999, 2004) across a gridded network covering much of North America, and is based on tree-ring data from 32 sites in Texas and surrounding states. The correlation between reconstructed gridpoint PDSI and Division 3 instrumental PDSI over their common period (1896-1978) is 0.810, indicating a very high degree of shared variance. |
| The tree-ring reconstruction can put the droughts of the last century in north central Texas into a much longer perspective. The frequency of severe one-year droughts appears to have remained fairly constant over the past ~350 years. Both the instrumental and reconstructed PDSI records indicate that "severe" or "extreme" summer drought (PDSI below -3) occurred in about 1 in 9 years. "Extreme" summer drought (PDSI below -4) such as 2006 is seen in about 1 in 20 years in both the instrumental and reconstructed records. |
| The severe and sustained 1950s drought appears to be unusual even in the context of the multicentury tree-ring record. From 1951 to 1956, the average instrumental summer PDSI was -3.60 (the average reconstructed summer PDSI was -3.16). The closest analog in the paleorecord is the six-year drought 1859-1864 (orange arrow), for which the average reconstructed summer PDSI was -2.87. There is one seven-year drought in the paleorecord, from 1772-1778 (red arrow), with an average reconstructed summer PDSI of -2.07. |
| The most notable aspect of the current drought was the profound dryness in fall and early winter; precipitation from September-December 2005 in Division 3 was only 24% of normal, the lowest level in the 111-year instrumental record. This extreme dryness led to the spectacular grass fires in Oklahoma and Texas in December and January. But this spectacle aside, the instrumental and tree-ring records of PDSI show the 2006 drought to be an infrequent, but not extraordinary, event. |
Resources:
References:
|