 |
U.S. Drought |

 National Drought Overview
| The year began with continued improvement in drought conditions over the Southwest. Drought worsened over the Pacific Northwest and northern Rockies during the 2004-2005 winter, resulting in about 13 percent of the contiguous United States experiencing moderate to extreme drought* by the end of February. The storm track moved northward during spring, bringing rain and snow to the drought-ravaged northern sections of the West. The drought focus shifted to the southern Plains to Lower Great Lakes during March, beginning a persistent dry spell there that would last most of the year and push the national drought coverage to about 20 percent. Several short-lived dry episodes occurred in other regions throughout the year, notably across parts of the Northeast during the early summer, the Eastern Seaboard during late summer to early fall, across much of the nation during September, and from the Southwest across the southern Plains to the eastern Great Lakes at the end of the year. |
|
*This drought statistic is based on the Palmer Drought Index, a widely used measure of drought. The Palmer Drought Index uses numerical values derived from weather and climate data to classify moisture conditions throughout the contiguous United States and includes drought categories on a scale from mild to moderate, severe and extreme. |
| The most extensive national drought coverage during the past 100 years (the period of widespread reliable instrumental records) occurred in July 1934 when 80 percent of the contiguous U.S. was in moderate to extreme drought. Although the current drought and others of the 20th century have been widespread and of lengthy duration, tree ring records indicate that the severity of these droughts was likely surpassed by other droughts including that of the 1570s and 1580s over much of the western U.S. and northern Mexico. |
Regional Drought Overview
| At its peak last year, the 2004 drought affected about two-thirds of the West (Rocky Mountains to West Coast). Abundant rain and record snowpacks from winter storms beginning in September 2004 brought relief to the Southwest, with only about 19 percent of the West affected by moderate to extreme drought by the end of January 2005. |
| While record wet conditions continued in the Southwest, dryness persisted in the Pacific Northwest during the 2004-2005 winter, with the drought coverage increasing to 25 to 28 percent of the West by February-March. Snowpack reached record low levels across much of the Northwest by the end of winter. The storm track shifted to the north during the spring, bringing drought relief finally to the Pacific Northwest and decreasing the western drought extent to about 10 percent by mid-summer. |
 |
 |
 |
 |
The 1999-2004 drought in the western U.S. will go down in history as one of the most severe droughts of the last 100 years. Five years or more of precipitation deficits lowered streamflows and depleted reservoirs. Some reservoirs recovered during 2005, but aggregated reservoir levels were still below average by the end of the year. |
| While the West was experiencing wet conditions, the drought focus shifted to the middle part of the country. Starting in the spring, unusually dry weather settled in over the Midwest and southern Plains. |
| Dryness occurred throughout the spring, fall, early winter, and part of summer across much of Arkansas, Illinois, Missouri, Oklahoma, and Texas. Especially hard-hit were northern Illinois and the Arklatex region (southwestern Arkansas, southeastern Oklahoma, northeastern Texas), both of which experienced the driest year in the 111-year record. |  |
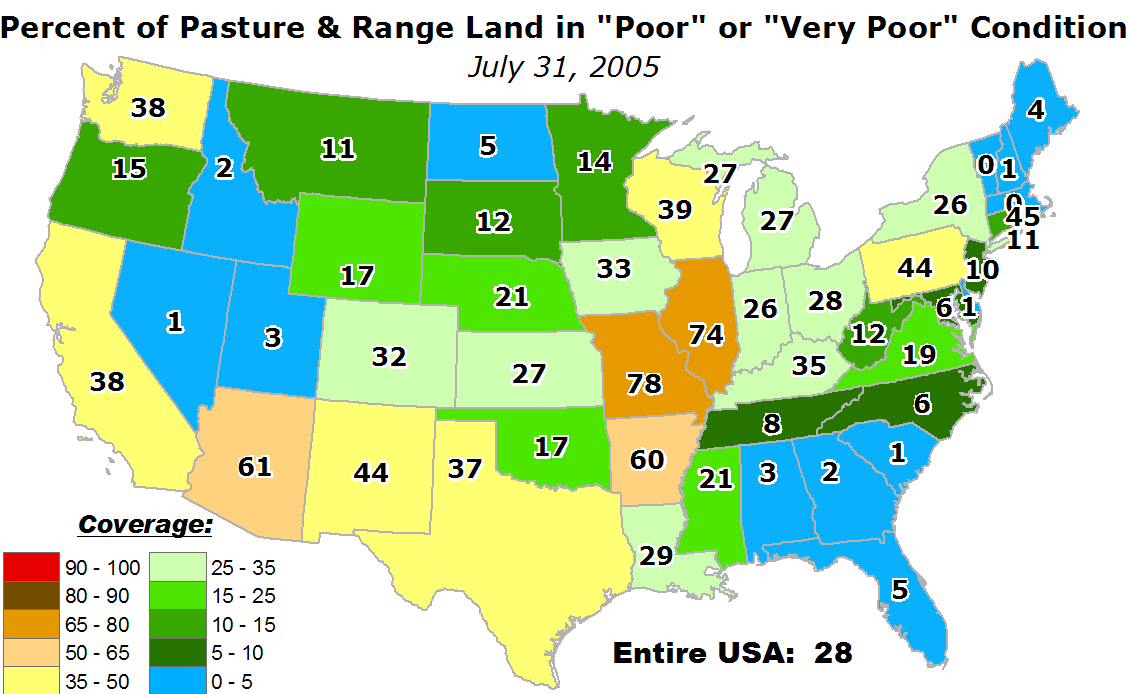
| Low streams, reservoirs, and stock ponds, depleted soil moisture (June, October), ravaged pastures and rangeland, and numerous wildfires prompted governors and the USDA to declare drought disasters in parts or all of several states (Arkansas, Illinois, Iowa, Kansas, Missouri, Texas, and Wisconsin). National corn, soybean, and wheat crop yields were below last year's records, but still above average. By the end of the year, a band of moderate to extreme drought stretched almost continuously from the Texas Gulf coast to Upper Michigan. |  |
 |
 |
| Parts of the Northeast experienced short-term dryness during early summer, with dryness returning to much of the Eastern Seaboard and Pacific Northwest during the late summer to early fall. Three states (Georgia, Maryland, South Carolina) had the driest September in the 111-year record, and six states (Delaware, Maryland, Oregon, South Carolina, New Jersey, Virginia) had the tenth driest, or drier, August-September. |  |
| September was unusually dry across much of the nation. The dry conditions combined with much warmer than normal temperatures to bring severe short-term drought especially to the southern and central Plains and much of the eastern U.S. The nation as a whole had the 11th driest September in the 111-year record, in spite of rains from tropical systems such as Hurricane Rita. |
 |
 |
| Extreme short-term dryness developed across the southern Plains to Lower Great Lakes during October and from the Southwest to the southern Plains and Lower Mississippi Valley during November. Three states (Arkansas, Louisiana, Mississippi) had the tenth driest, or drier, October-November in the 111-year record. If another month is added to the season (September in addition to October and November), then three states (Kentucky, Oklahoma, Texas) had the tenth driest, or drier, fall (September-November). |  |
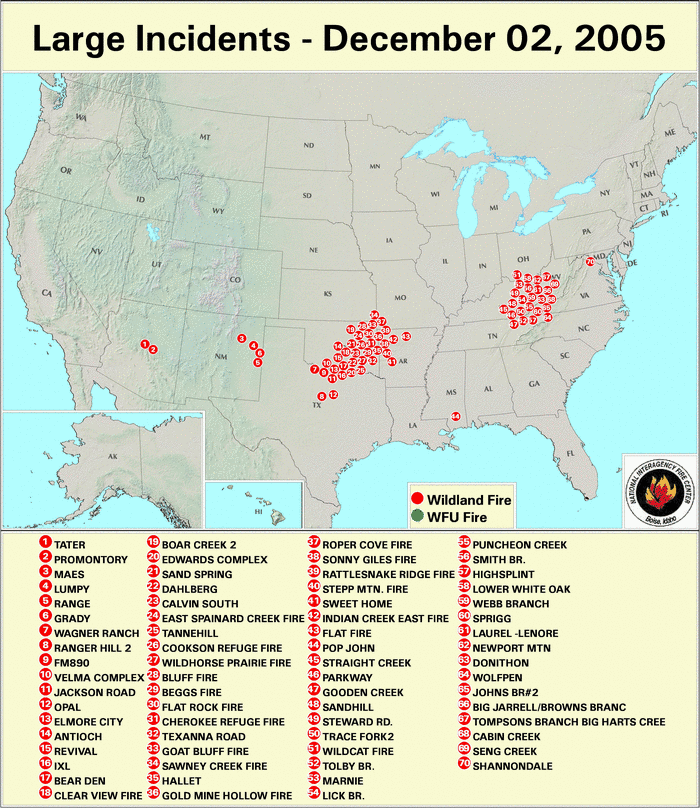
| The year ended with a very dry month from the Southwest across the southern Plains to the Ohio Valley and eastern Great Lakes. Several states from the Southwest to Lower Mississippi Delta had the tenth driest, or drier, December, including Arizona and Arkansas with the driest December in the 111-year record. November-December marked a turnaround in moisture conditions for the Southwest, where 12 months ago the weather was unusually wet. An examination of USDA snowcourse/snotel station data in Arizona revealed that 31 of 33 sites, or 94% of them, were snow free at the end of the year, the most snow-free locations in at least the past 40 years. December capped a three-month period of exceptionally dry weather for the southern Plains, with Arkansas and the Arklatex experiencing the driest October-December on record. Dry, windy, and warmer-than-normal weather contributed to the outbreak of numerous grassfires in Oklahoma, Texas, Arkansas, and New Mexico. |
 |
 |
Pre-instrumental Drought Perspective
Tree ring records
provide a useful paleoclimatic index that extends our historical
perspective of droughts centuries beyond the approximately 100-year
instrumental record. Several paleoclimatic studies have shown that
droughts as severe or worse, both in magnitude and duration, than
the major 20th century droughts have occurred in the U.S. during
the last thousand years. The following paleodrought reports have
been prepared by the NOAA/NCDC Paleoclimatology
and Climate
Monitoring branches during 2005:
|