U.S. Drought Highlights:

- On the national scale, severe to extreme drought affected about 18 percent of the contiguous United States as of the end of August 2004.
- Moderate to extreme drought affected about 29 percent of the contiguous U.S.
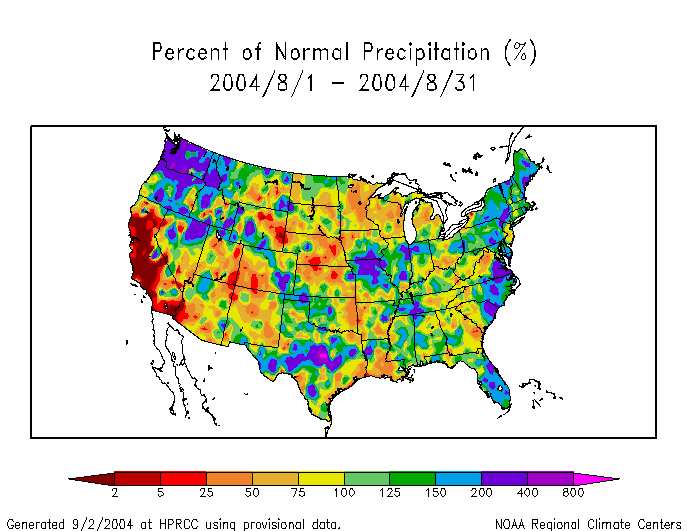
- Nationally, the contiguous U.S. was wetter than normal due to above average rainfall across parts of the southern Plains, Midwest, and east coast. Rains in the Pacific Northwest brought short-term relief to the drought.
- August was dry across parts of the northern Rockies to Southwest, central Great Plains to northern Great Lakes, much of Alaska, and parts of southern Louisiana and the central Appalachians.
- Long-term moisture deficits (last 6 to 24 to 60 months) persisted across parts of the Great Plains and Southeast, and most of the West.
Please Note: The data presented in this drought report are preliminary. Ranks, anomalies, and percent areas may change as more complete data are received and processed.
National Overview
On the national scale,
- severe to extreme drought affected about 18 percent of the contiguous United States as of the end of August 2004, about the same as last month
- about 29 percent of the contiguous U.S. fell in the moderate to extreme drought categories (based on the Palmer Drought Index) at the end of August
- on a broad scale, the last two decades were characterized by unusual wetness with short periods of extensive droughts, whereas the 1930s and 1950s were characterized by prolonged periods of extensive droughts with little wetness
- about 13 percent of the contiguous U.S. fell in the severely to extremely wet categories at the end of August
- a file containing the national monthly percent area severely dry and wet from 1900 to present is available
- historical temperature, precipitation, and Palmer drought data from 1895 to present for climate divisions, states, and regions in the contiguous U.S. are available at the Climate Division: Temperature-Precipitation-Drought Data page in files having names that start with "drd964x" and ending with "txt" (without the quotes).
Regional Overview
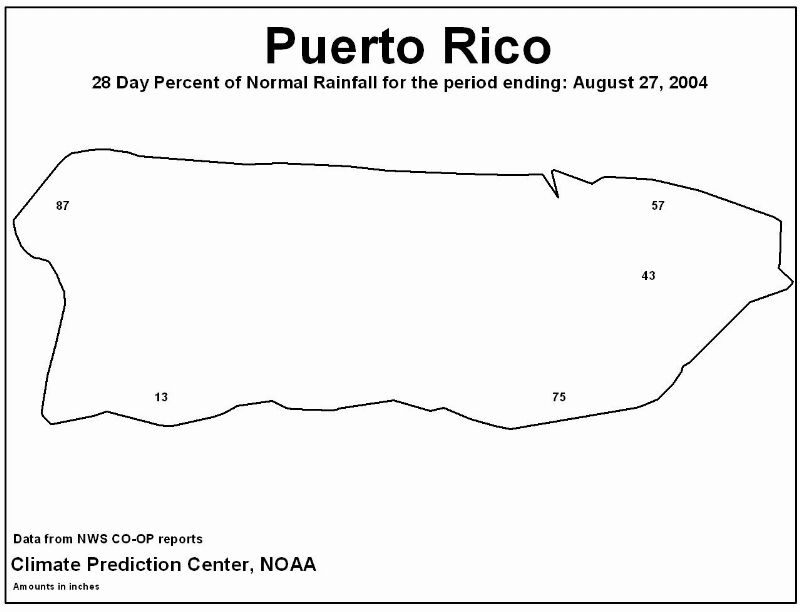
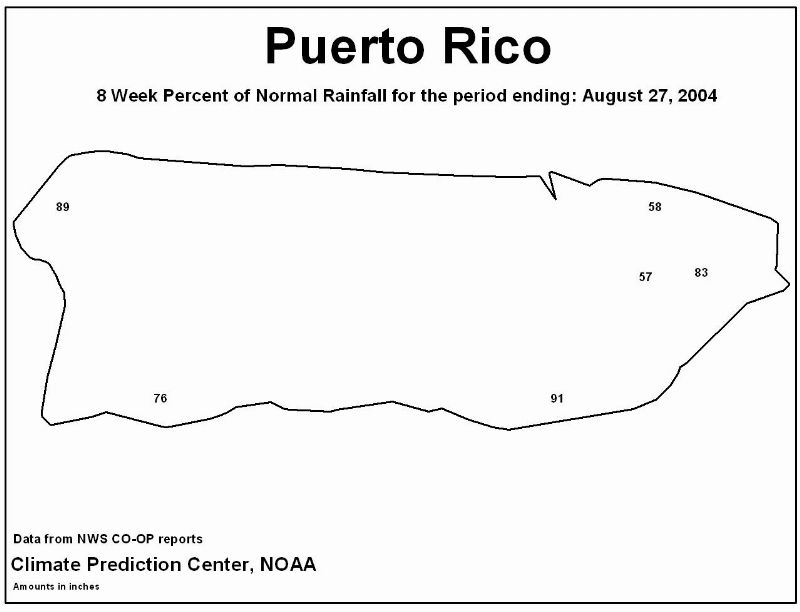
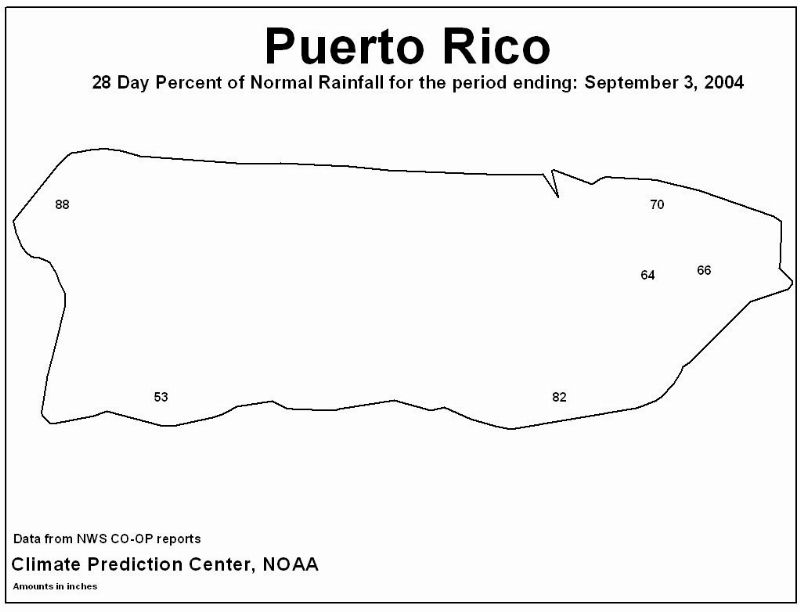
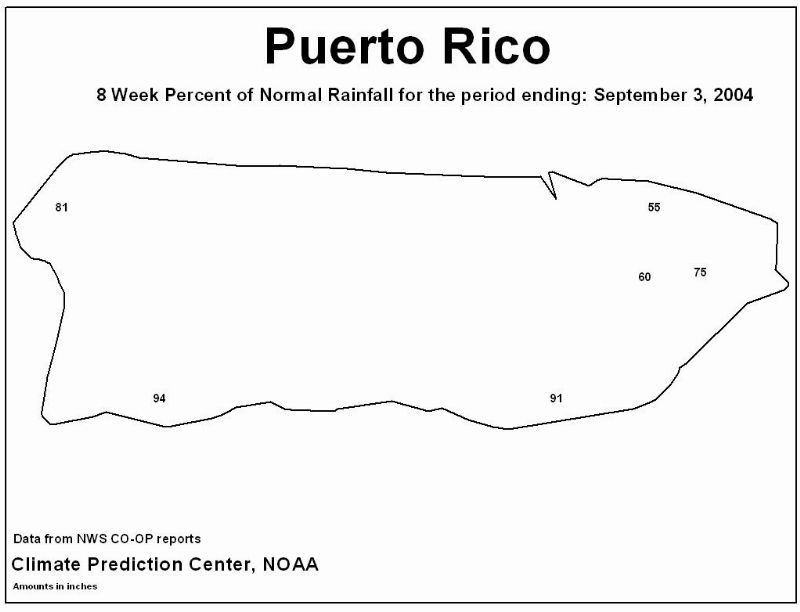
August was dry across parts of the northern Rockies to Southwest, central Great Plains to northern Great Lakes, much of Alaska, and parts of southern Louisiana and the central Appalachians. The Alaska dryness was apparent in both station precipitation reports and satellite-based wetness observations as well as monthly averaged streamflow, and was accompanied by unusually warm temperatures (station reports, satellite). The precipitation pattern at the primary stations in Hawaii was mixed. In Puerto Rico, below-normal precipitation was observed at the primary stations as well as the Cooperative stations for both the 4 weeks and 8 weeks ending on August 27 (4 weeks, 8 weeks) and September 3 (4 weeks, 8 weeks).
August rains brought short-term relief to the drought in the Pacific Northwest. But long-term moisture deficits (last 9 to 24 to 36 to 60 months) continued in many areas. Dry conditions have persisted for much of the last 12 months across most of the West North Central, Southwest, and West regions:
- West North Central - 26th driest August, 21st driest September-August, 18th driest June-August
- Southwest - 32nd driest August, 39th driest September-August, 13th driest May-August
- West - 31st driest September-August, 3rd driest March-August
For the Southeast region, even though mid-2002 to mid-2003 had record wet conditions, the unusual dryness before and after that period was so severe that the region shows up as dry at the 48-month (4-year) to 60-month (5-year) time scales.
Some regional highlights:
- Several states had the tenth driest, or drier, month or season for:
- June-August (Arizona-10th)
- May-August (Arizona-6th, California-8th)
- April-August (California-10th)
- March-August (California-2nd, Wyoming-7th)
- January-August (Wyoming-8th)
- December-August (Wyoming-10th)
- October-August (Wyoming-10th)
- Soil moisture conditions:
- End-of-month soil moisture conditions were drier than normal in parts of the Southeast, Upper Midwest, northern Great Plains, and Alaska, and drier than normal across much of the West, based on model computations (CPC-1, CPC-2, MRCC).
- late August USDA topsoil moisture observations were dry to very dry (also compared to 5-year and 10-year climatologies) in states along the Gulf Coast, Great Plains, and West.
- According to end-of-August USDA reports, more than 30 percent of the pasture and range land was in poor or very poor condition (higher than seasonal norms) in several northern Plains and western states.
- Several large wildfires burned during the month in the western U.S. and east central Alaska.
- Much of the western U.S. has experienced dry conditions for the last five to six years. Continued dryness this month has exacerbated drought conditions across parts of the West.
- Reservoirs in the western states were still low or depleted. Even though abundant rain fell over the Pacific Northwest in recent months (1-, 2-, 3-month SPI), the rainfall has not refilled many reservoirs in central and eastern Oregon, central Washington, and western and southeastern Idaho.
- Streamflow levels were below seasonal norms across much of the West, both as computed by models and based on USGS observations. Below-normal monthly streamflows were also observed in parts of Alaska and the Southeast.
- The percent area of the western U.S. (Rockies westward) experiencing moderate to extreme drought (as defined by the Palmer Drought Index) decreased during August to about 69%. While this is not near record historical levels, it is still comparable to the major droughts of the 20th Century.
Paleoclimatic Perspective
When the 20th and 21st century record of drought for this region is compared to the multi-century record of drought reconstructed from tree rings, recent droughts can be evaluated in a longer-term context.
The graph below left depicts the Palmer Drought Severity Index (PDSI) for southwestern Montana for the instrumental period, January 1900-August 2004. The graph below right shows a record of summer (June-July-August average) PDSI reconstructed from tree-ring data (light red line represents annual values, dark red values are smoothed with a 10-year running mean) for a grid point in southwestern Montana. These tree-ring data are part of a gridded network of PDSI reconstructions recently generated by E.R. Cook and colleagues. In the graph to the bottom right, the gridded tree-ring reconstruction has been scaled to match the variance (year-to-year variability) in the instrumental gridded PDSI data, and the gridded instrumental data have been appended to the end of the reconstruction for the years 1979-2003. The graph shows a record of regional drought from AD 1234 to 2003. The observed summer (June-July-August averaged) PDSI from divisional data is shown in blue (light blue line represents annual values, dark blue line represents smoothed values) for the years 1900-2004. The match between the two PDSI records is quite good, particularly for the periods of drought, and considering the two records are not for the same exact regions.


In the 20th century, the three major droughts have been the 1930s, 1950s and late 1980s-early 1990s droughts, with a short period of recovery between this last drought and the current period of drought, which started in late 1999 but began in earnest in 2000. A notable feature of the 20th century droughts is the intensity of drought in 1934. This is the 5th lowest summer PDSI value for a single year in the full 770 year record. The driest year was 1382, followed by 1580, 1460, 1863, then 1934.
When 20th century summer droughts are viewed in terms of duration (numbers of years of negative PDSI), they appear to be of a relatively common duration, with the longest period of negative PDSI from 1987 to 1992 (six years). In the 1930s, there were five consecutive years of negative PDSI values. The longest period of drought in the full record, is the 16-year period from 1243-1258, clearly visible in the graph as a period of sustained drought. Other periods of persistent drought were in the mid-17th century (14 years, 1652-1665), in the 1430s (eight years, 1432-1439), and around 1400 (nine years, 1395-1403). In between the latter two periods of drought was a very wet period. However, only 11 near-average years separated the 16-year drought in the 1200s and a period of eight more years of negative PDSI from 1269-1276.
Resources:
The gridded network of reconstructed PDSI is available from the NOAA Paleoclimatology Branch. The display and downloading of PDSI grid point data is available at:
The full gridded PDSI dataset, both reconstructed and instrumental, as well as reconstruction calibration and verification statistics, is available at:
The general methodology for the gridded PDSI reconstruction can be found in:
- Cook, E.R., D.M. Meko, D.W. Stahle, and M.K. Cleaveland, 1999. "Drought reconstructions for the continental United States." Journal of Climate 12: 1145-1162.