U.S. Drought Highlights:

- On the national scale, severe to extreme drought affected about 19 percent of the contiguous United States as of the end of March 2004
- moderate to extreme drought affected about 27 percent of the contiguous U.S.
- March was much warmer and drier than normal across most of the western and Great Plains drought areas, resulting in an expansion of the national percentage drought area
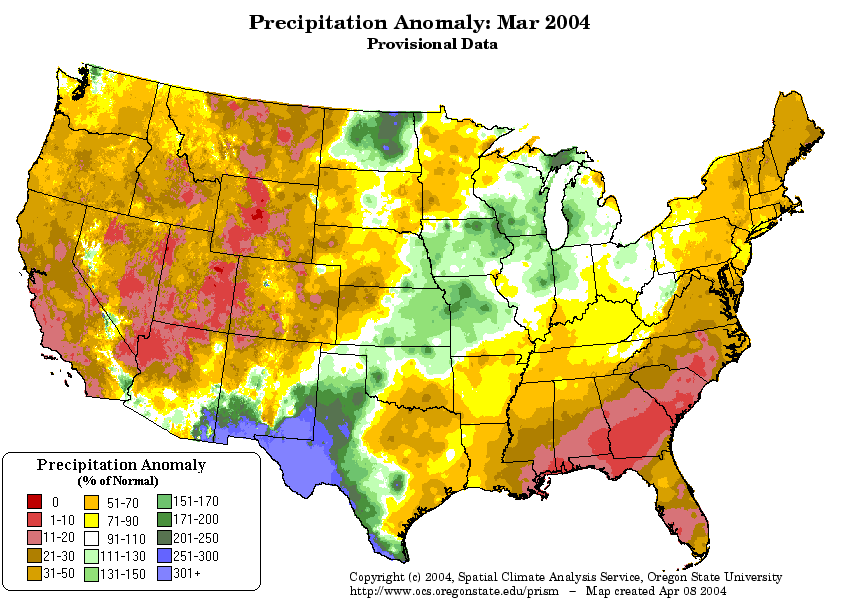
- The month was dry along much of the East Coast and very dry in the Southeast
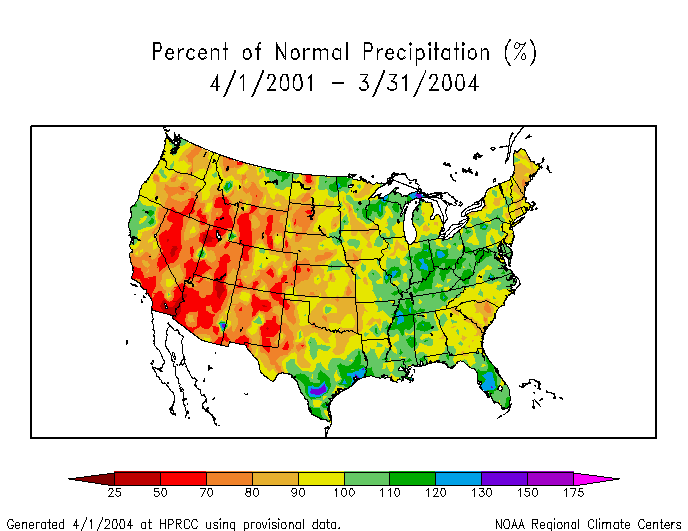
- Long-term moisture deficits (last 9 to 24 to 60 months) persisted across parts of the Upper Midwest to central Plains, parts of the Southeast, and most of the West
Please Note: The data presented in this drought report are preliminary. Ranks, anomalies, and percent areas may change as more complete data are received and processed.
National Overview
On the national scale,
- severe to extreme drought affected about 19 percent of the contiguous United States as of the end of March 2004, an increase of about 8 percent compared to last month
- about 27 percent of the contiguous U.S. fell in the moderate to extreme drought categories (based on the Palmer Drought Index) at the end of March
- on a broad scale, the last two decades were characterized by unusual wetness with short periods of extensive droughts, whereas the 1930s and 1950s were characterized by prolonged periods of extensive droughts with little wetness
- about 3 percent of the contiguous U.S. fell in the severely to extremely wet categories at the end of March
- a file containing the national monthly percent area severely dry and wet from 1900 to present is available
- historical temperature, precipitation, and Palmer drought data from 1895 to present for climate divisions, states, and regions in the contiguous U.S. are available at the Climate Division: Temperature-Precipitation-Drought Data page in files having names that start with "drd964x" and ending with "txt" (without the quotes).
Regional Overview
March was drier than normal across much of the U.S. The dryness was especially pronounced in the Southeast, where several states had a record or near-record dry month. Unusually warm temperatures worked in combination with the dry weather to intensify short-term drought conditions across most of the West and central High Plains. Much of Alaska was drier than normal, while the rainfall pattern in Hawaii was mixed. The primary stations in Puerto Rico were generally wetter than normal.
March marked the third consecutive dry month for the Northeast, bringing record or near-record dry January-March conditions to several states. Five of the last six months have averaged near to much drier than normal for the Southeast. This recent dryness, combined with the prolonged dryness that occurred from 1998-2002, has resulted in the reappearance in the Southeast of patchy drought based on the Palmer Drought Index.
This month's short-term dryness compounded the long-term moisture deficits (last 9 to 24 to 36 to 60 months) in many areas.
Some regional highlights:
- Driest March in the 1895-2004 record for Georgia and South Carolina
- Driest February-March and January-March in the 1895-2004 record for Maine
- At the beginning of March, a significant part of the West had above-normal snowpack. However, the unusually dry and much warmer-than-normal weather of March 2004 melted and evaporated much of the snow. This left most areas with below-normal snowpack by the end of the month and caused record snowpack decreases at many locations (USDA/NRCS). The excessive warmth resulted in much above normal evaporation which contributed to sublimation (3/23 U.S. Drought Monitor discussion) of some of the snowpack. The effects of the short- and long-term drought include:
- soil moisture conditions remained dry in many areas
- reservoirs in most of the western states were still low or depleted
- average streamflow remained below normal levels in many areas
- The percent area of the western U.S. (Rockies westward) experiencing moderate to extreme drought (as defined by the Palmer Drought Index) increased during March to about 59%. While this is not near record historical levels, it is still comparable to the major droughts of the 20th Century.
- According to USDA reports, 30% or more of the topsoil was rated dry or very dry (short or very short) in many western, Great Plains, and Southeast states
- As reported by the media (AP, 4/10), western water supplies were dwindling and the threat of wildfires was already on the rise. National Interagency Fire Center reports indicated several large wildfires had broken out in the Southeast and southern Plains by the end of March and in the West by the beginning of April.
Paleoclimatic Perspective
The southwestern United States has experienced unusually dry conditions for much of the last four years. By some measures, the dryness has been as bad as the drought of the 1950s (considered to be the worst drought episode of the 20th century), but by other measures (the Palmer Drought Index) it can be considered worse. Extensive reliable instrumental records go back only about 100 years, but tree rings are a form of paleoclimatic data that can reliably extend the climate record back several more centuries.
Precipitation data, Palmer Drought Indices, and tree ring data were analyzed for stations in southwestern New Mexico and southeastern Arizona to create a subregion called "Southwest New Mexico". The Palmer Drought Index computed over the instrumental record (graph below left) shows that the 1950s was the worst drought of the last 100 years for this region. However, worse dry spells have occurred over the last 300 years when the tree-ring reconstruction is examined (graph below right).


Total winter (November-March) precipitation for Southwest New Mexico was reconstructed from a set of moisture-sensitive trees in this region (Woodhouse 1996). The reconstruction explains 66% of the variance in the instrumental record, and extends from 1702-1983 (blue line in the graph above right). The values shown are departures from average, so negative values are drier than average and positive values are wetter than average. The instrumental record for this region, 1896-2004, is shown in red. In the period of overlap, the match between the tree-ring-based reconstruction and the instrumental record can be assessed. In general, the two records vary in the same ways (e.g., low values in the instrumental record are also low values in the reconstruction), but the variance not explained by the tree rings is typically in the magnitude of extreme values (e.g., 1941). The Pearson correlation coefficient between the reconstruction and the instrumental record is 0.76, which is a very good match.
The reconstruction is useful for placing 20th century drought events into a long term context. Since 2000, there has been a sequence of severe drought years, but the drought in the 1950s was as severe and even more persistent. Looking back to years prior to the instrumental record, single drought years including 1861, 1818, 1752, and 1748 were more intense than any year in the 20th century. In particular, winter rainfall in 1748 was more than two and a half standard deviations below average, and the driest year in the 282-year reconstruction. The reconstruction also shows that some of these pre-instrumental period droughts were more persistent than any in the 20th century. The longest sequence of consecutive years below average was the eight-year period between 1750 and 1757. In contrast, the longest drought period in the 20th century is the five-year period from 1953-1957.
Reference:
- Woodhouse, C.A., 1996. "Climate Variability on the Southwestern United States as Reconstructed from Tree-Ring Chronologies." Ph.D. Dissertation. University of Arizona, 227 pp.
Additional Resources:
Additional paleoclimatic information can be found at the NOAA Paleoclimatology Program web site: http://www.ncdc.noaa.gov/paleo/paleo.html
and at the University of Arizona Climate Assessment for the Southwest web site: http://www.ispe.arizona.edu/climas/research/paleoclimate/product.html