U.S. Drought Highlights:

- On the national scale, severe to extreme drought affected about 20 percent of the contiguous United States as of the end of June 2004.
- Moderate to extreme drought affected about 31 percent of the contiguous U.S.
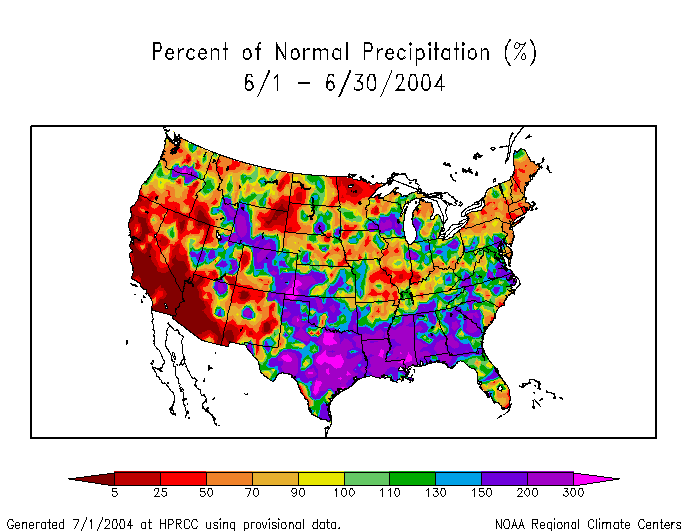
- Nationally, the contiguous U.S. was very wet due to heavy rains that fell across the southern Plains into the Southeast. The rains brought relief from drought in parts of Georgia and the Carolinas (PHDI for June vs. May).
- June was dry across much of the West and Northeast, parts of the northern Plains and Midwest, the southeastern half of Alaska, and southern Florida.
- Long-term moisture deficits (last 6 to 24 to 60 months) persisted across Maine, parts of the Great Plains, parts of the Southeast, and most of the West.
Please Note: The data presented in this drought report are preliminary. Ranks, anomalies, and percent areas may change as more complete data are received and processed.
National Overview
On the national scale,
- severe to extreme drought affected about 20 percent of the contiguous United States as of the end of June 2004, an increase of about 2 percent compared to last month
- about 31 percent of the contiguous U.S. fell in the moderate to extreme drought categories (based on the Palmer Drought Index) at the end of June
- on a broad scale, the last two decades were characterized by unusual wetness with short periods of extensive droughts, whereas the 1930s and 1950s were characterized by prolonged periods of extensive droughts with little wetness
- about 7 percent of the contiguous U.S. fell in the severely to extremely wet categories at the end of June
- a file containing the national monthly percent area severely dry and wet from 1900 to present is available
- historical temperature, precipitation, and Palmer drought data from 1895 to present for climate divisions, states, and regions in the contiguous U.S. are available at the Climate Division: Temperature-Precipitation-Drought Data page in files having names that start with "drd964x" and ending with "txt" (without the quotes).
Regional Overview
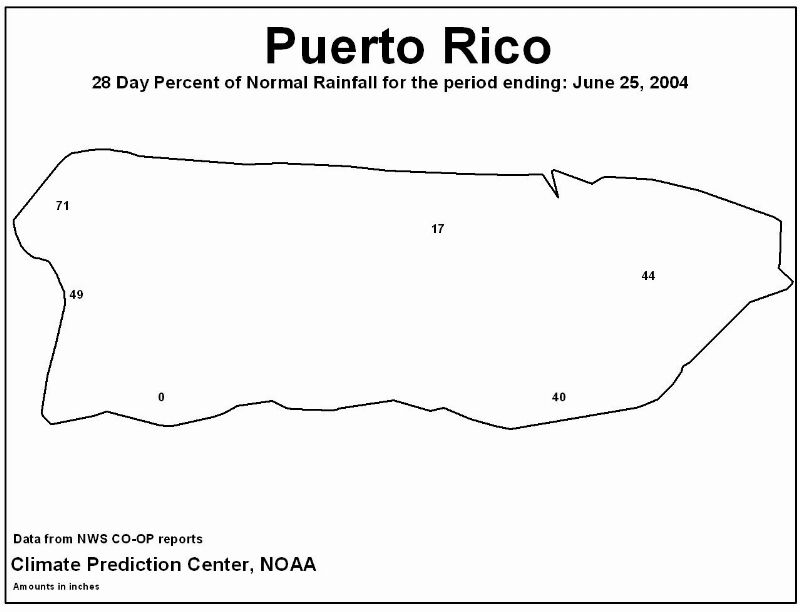
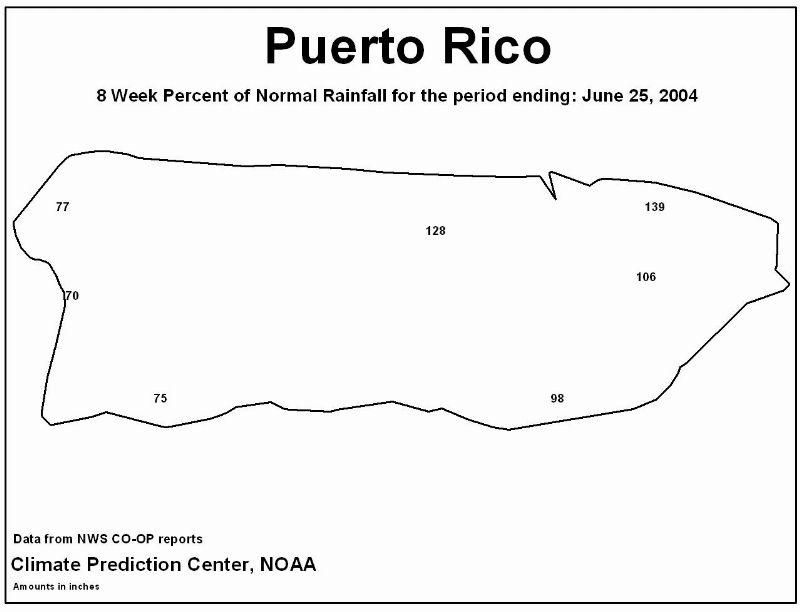
June was dry across much of the West and Northeast, parts of the northern Plains and Midwest, and southern Florida. Heavy rains that fell across the southern Plains into the Southeast brought relief from drought in parts of Georgia and the Carolinas (PHDI for June vs. May). The interior and southeast stations in Alaska were drier than normal, but wetter than normal conditions prevailed at the primary stations along the western and northern coastal bands. The rainfall pattern in Hawaii was mixed, with most of the primary stations drier than normal. The pattern was also mixed at the primary stations in Puerto Rico, but most of the coastal Cooperative stations were drier than normal for the 4 weeks ending on June 25 and the stations on the western end of the island were drier than normal for the last 8 weeks.
This month's short-term dryness compounded the long-term moisture deficits (last 9 to 24 to 36 to 60 months) in many areas. Dry conditions have persisted for much of the last 12 months across most of the West North Central region, giving the region the eighth driest July-June in the 110-year record. The 12th wettest June in the 110-year record brought relief from drought to the Southeast region. But severe dryness during the preceding three months still resulted in the 23rd driest March-June, in spite of the recent wet conditions.
Near-normal rainfall during June combined with a very dry May to give the Southwest region the 41st wettest June but 16th driest May-June in the 110-year record. Below normal rainfall for much of the last 12 months gave the region the 26th driest July-June. Drier than normal conditions in June for the Northwest and West regions, combined with below-normal precipitation in other recent months, resulted in the 21st driest February-June in the 110-year record for the Northwest and the third driest March-June for the West.
Some regional highlights:
- Several states had the tenth driest, or drier, month or season for:
- May-June (Arizona-6th)
- March-June (California-3rd, Wyoming-7th, Montana-11th)
- February-June (Maine-9th)
- January-June (Maine-4th, Wyoming-9th)
- December-June (Wyoming-10th)
- October-June (Wyoming-10th)
- August-June (Montana-10th)
- July-June (Montana-5th, Wyoming-7th)
- Soil moisture conditions:
- End-of-month soil moisture conditions were much drier than normal in parts of Maine, the Southeast, and Great Plains, and drier than normal across much of the West, based on model computations.
- early July USDA topsoil moisture observations were dry to very dry (also compared to 5-year and 10-year climatologies) in states in the coastal mid-Atlantic to Northeast, Midwest to Great Plains, and West.
- According to beginning-of-July USDA reports, more than 30 percent of the pasture and range land was in poor or very poor condition (higher than seasonal norms) in several western and Great Plains states.
- Much of the western U.S. has experienced dry conditions for the last five to six years. Continued dryness this month has exacerbated drought conditions across parts of the West.
- High elevation SNOTEL station reports indicate that the mountain snowpack has essentially melted out.
- Reservoirs in the western states were still low or depleted.
- Streamflow levels were below seasonal norms, especially in the northern Rockies, both as computed by models and based on USGS observations.
- The percent area of the western U.S. (Rockies westward) experiencing moderate to extreme drought (as defined by the Palmer Drought Index) increased during June to about 74%. While this is not near record historical levels, it is still comparable to the major droughts of the 20th Century.
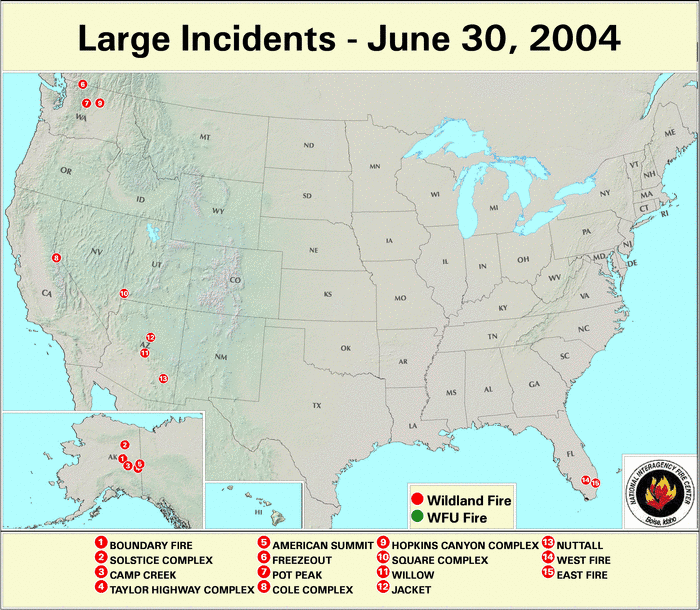
- The below-normal precipitation in Alaska was accompanied by much warmer than normal temperatures, giving the state a record warm June. Drying soils, increasing vegetative stress (June 27 to July 4), and several wildfires resulted.
Paleoclimatic Perspective
While June 2004 was the fifth wettest June on record for Georgia, the preceding three months were very dry, ranking as the second driest March-May in the 110-year record. Even with June included, the last four months ranked as the 21st driest March-June.
Paleoclimatic data, such as tree-rings, can be used to extend the climate record back several centuries beyond the 110-year instrumental record. Bald cypress tree-ring chronologies were used to reconstruct statewide spring (March-June) precipitation for Georgia (Stahle and Cleaveland, 1992). The tree-ring reconstruction explains 68% of the variance of Georgian precipitation. Reconstructed precipitation extends back to AD 933 and ends in 1985. Smoothed (10-year moving average) reconstructions show a range of variability in both drought intensity and duration over the past millennium. The 20th century part of the reconstruction is characterized by a high degree of variability and less severe droughts of shorter duration than the rest of the record. Two of the most persistent periods of droughts occurred around 1800 and in first half of the 12th century. The drought centered in the 1750s was also severe.

In the graph to the left, the blue lines are the statewide precipitation for Georgia based on instrumental observations for 1895-2004. The red lines are the reconstructed precipitation based on tree-ring data for the period 933-1985. Both sets of data have been standardized using the mean and standard deviation for the period of record common to both (i.e., 1895-1985) in order to facillitate direct comparison of the different types of data. Negative values are drier than the mean, while positive values are wetter than the mean. The darker thick curves are 10-year moving averages, while the lighter thin lines are the annual values.
For much of the West, 2004 marked the start of the sixth year of generally dry conditions. In 2002, drought reached the most severe level in the last 100 years, statewide, for Wyoming, based on the Palmer Drought Index. Precipitation averaged across the state, plotted for consecutive overlapping 60-month intervals, indicated that July 1999-June 2004 was the driest such 5-year period in the state's 110-year instrumental record.
Paleoclimatic data, such as tree-rings, can be used to extend the climate record back several centuries beyond the 110-year instrumental record. Tree growth of moisture-sensitive Douglas-fir trees in north-central Colorado and southeastern Wyoming reflects variations in spring moisture. Two tree-ring chronologies from the upper North Platte River basin, one collected near Encampment and one near the Colorado/Wyoming border above the North Platte River, correlate well with Wyoming Division 10 (Upper Platte Basin) Palmer Drought Severity Index (PDSI) for June ( r = 0.445), 1900-2001.
A comparison of the average of the two tree-ring chronologies vs. observed June PDSI for 1900-2001 indicates that tree growth often matched the year-to-year variations in PDSI, as well as the lower frequency variations. The tree-ring record reflects the major droughts of the 20th century, in the early 1900s, the 1950s, and the late 1980s. However the most severe drought in the instrumental record is the recent and ongoing drought, which is not reflected in this tree-ring record since it ends in 2001.
If considered as a proxy for drought, the full tree-ring record, extending back to 1486, allows a comparison of 20th century droughts with droughts in previous centuries. In the graph below right, the blue lines are the June PDSI for the instrumental record 1900-2004. The red lines are the reconstructed drought index based on tree-ring data for the period 1486-2001. Both sets of data have been standardized using the mean and standard deviation for the period of record common to both (i.e., 1900-2001) in order to facillitate direct comparison of the different types of data. Negative values are drier than the mean, while positive values are wetter than the mean.

When the record is smoothed with a 10-year moving average (the darker thick curves), the 1930s and 1950s periods of drought rank with several other periods of major drought in the last 500 years. Droughts in the late 16th century and the mid-17th century are comparable, and only the drought of the second half of the 19th century appears more persistent. Although shorter, the drought in the early 1700s appears as the most severe drought in this proxy record.
Resources:
More information on the Georgia and South Carolina tree-ring chronologies can be found in this publication:
- Stahle, D.W. and M.K. Cleaveland, 1992, "Reconstruction and analysis of rainfall over the southeastern U.S. for the past 1000 years." Bulletin of the American Meteorological Society 73(12): 1947-1961.