U.S. Drought Highlights:

- On the national scale, severe to extreme drought affected about 20 percent of the contiguous United States as of the end of July 2004.
- Moderate to extreme drought affected about 33 percent of the contiguous U.S.
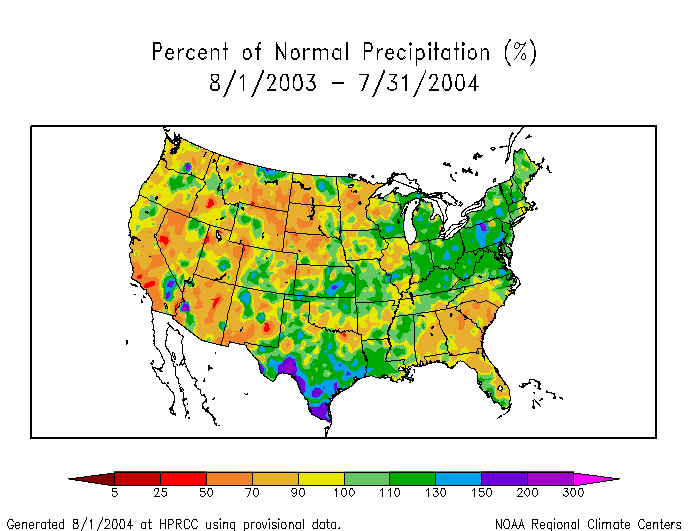
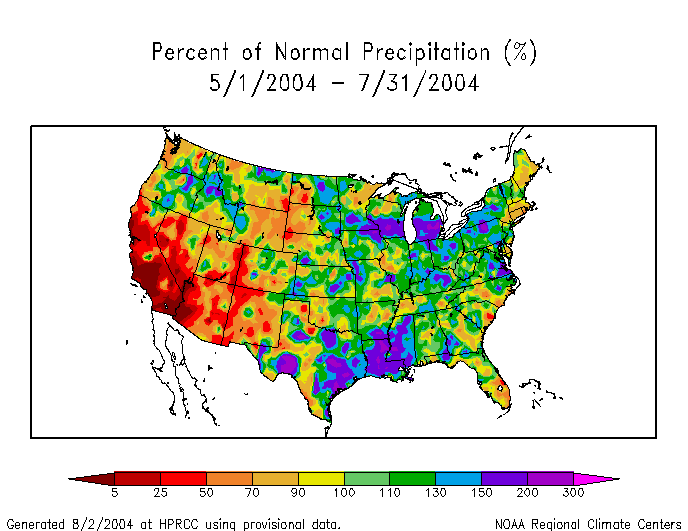
- Nationally, the contiguous U.S. was wetter than normal due to heavy rains that fell across the southern and central Plains into the Northeast.
- July was dry across much of the West and parts of the Southeast and Alaska.
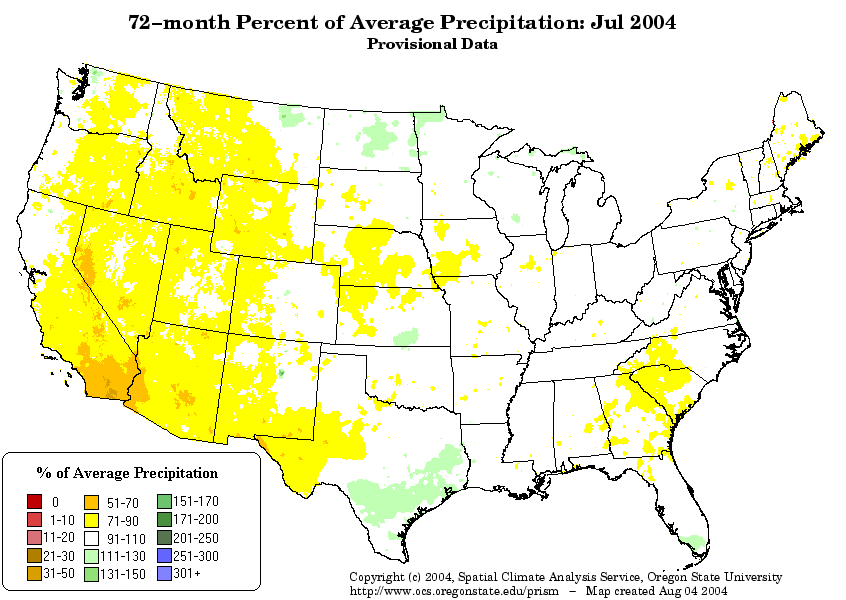
- Long-term moisture deficits (last 6 to 24 to 60 months) persisted across Maine, parts of the Great Plains, Midwest, and Southeast, and most of the West.
Please Note: The data presented in this drought report are preliminary. Ranks, anomalies, and percent areas may change as more complete data are received and processed.
National Overview
On the national scale,
- severe to extreme drought affected about 20 percent of the contiguous United States as of the end of July 2004, about the same as last month
- about 33 percent of the contiguous U.S. fell in the moderate to extreme drought categories (based on the Palmer Drought Index) at the end of July
- on a broad scale, the last two decades were characterized by unusual wetness with short periods of extensive droughts, whereas the 1930s and 1950s were characterized by prolonged periods of extensive droughts with little wetness
- about 9 percent of the contiguous U.S. fell in the severely to extremely wet categories at the end of July
- a file containing the national monthly percent area severely dry and wet from 1900 to present is available
- historical temperature, precipitation, and Palmer drought data from 1895 to present for climate divisions, states, and regions in the contiguous U.S. are available at the Climate Division: Temperature-Precipitation-Drought Data page in files having names that start with "drd964x" and ending with "txt" (without the quotes).
Regional Overview
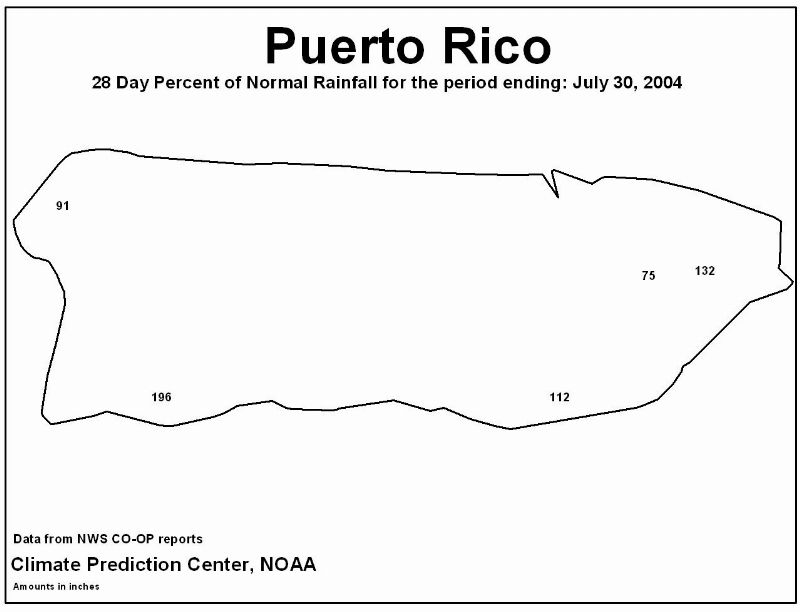
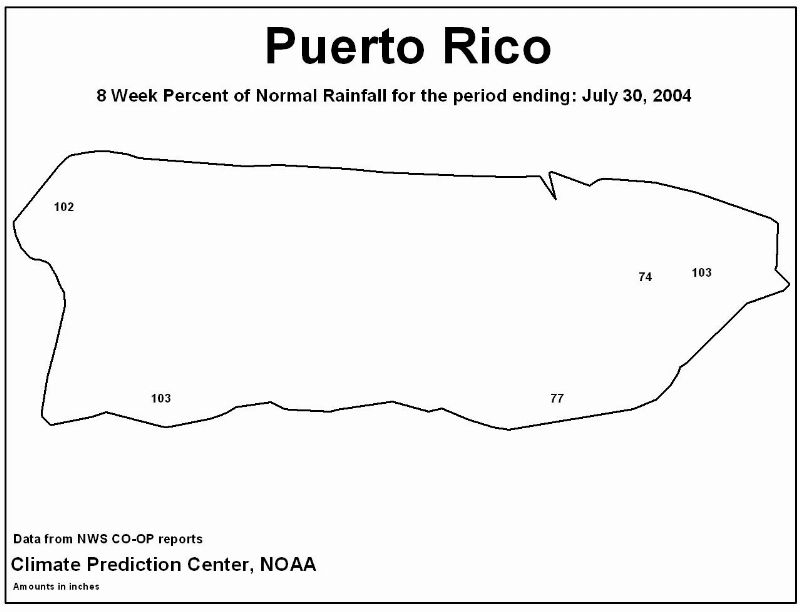
July was dry across much of the West and parts of the Southeast and Alaska. The Alaska dryness was apparent in both station precipitation reports and satellite-based wetness observations as well as monthly averaged streamflow, and was accompanied by unusually warm temperatures (station reports, satellite). The primary stations in Hawaii were drier than normal. In Puerto Rico, the pattern was mixed at the primary stations as well as the Cooperative stations for both the 4 weeks and 8 weeks ending on July 30.
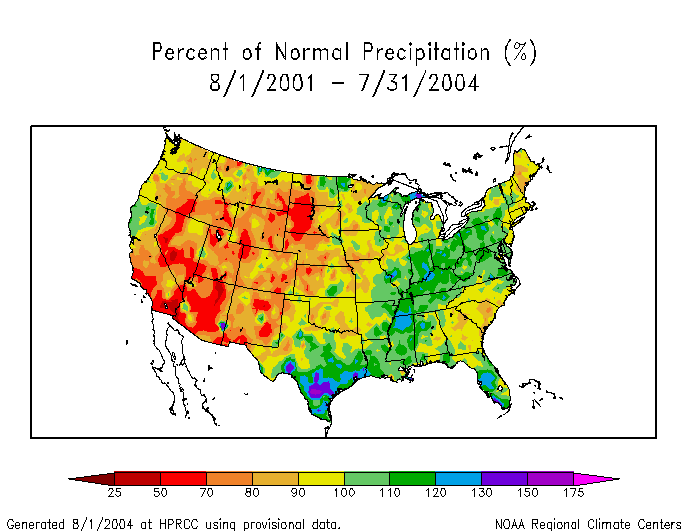
This month's short-term dryness compounded the long-term moisture deficits (last 9 to 24 to 36 to 60 to 72 months) in many areas. Dry conditions have persisted for much of the last 12 months across most of the West, Northwest, Southwest, and Southeast regions:
- West - 31st driest July, 37th driest August-July, 3rd driest March-July
- Northwest - 22nd driest July, 32nd driest August-July, 19th driest March-July
- Southwest - 34th driest July, 39th driest August-July, 13th driest May-July
- Southeast - 28th driest July, 35th driest August-July, 15th driest March-July
The West North Central region had a near normal July, but the last 12 months ranked as the 18th driest August-July, regionwide, in the 110-year record. For the Southeast region, even though mid-2002 to mid-2003 had record wet conditions, the unusual dryness before and after that period was so severe that the region shows up as dry at the 60-month (5-year) to 72-month (6-year) scale.
Some regional highlights:
- Several states had the tenth driest, or drier, month or season for:
- May-July (Arizona-10th)
- March-July (California-2nd, Wyoming-9th)
- February-July (Montana-9th)
- January-July (Montana-9th, Wyoming-10th, Maine-7th)
- December-July (Montana-10th, South Carolina-9th)
- October-July (Wyoming-9th)
- September-July (South Carolina-8th)
- August-July (Montana-8th, South Carolina-9th)
- Soil moisture conditions:
- End-of-month soil moisture conditions were drier than normal in parts of the Southeast, Upper Midwest, Great Plains, and Alaska, and drier than normal across much of the West, based on model computations (CPC-1, CPC-2, MRCC).
- early August USDA topsoil moisture observations were dry to very dry (also compared to 5-year and 10-year climatologies) in states along the Gulf Coast, western Great Lakes, and Great Plains to Far West.
- According to beginning-of-August USDA reports, more than 30 percent of the pasture and range land was in poor or very poor condition (higher than seasonal norms) in several western and northern Plains states. The percentage area increased, compared to 4 weeks ago, in the West, northern Plains, and western Great Lakes states.
- Several large wildfires developed in east central Alaska during July, with a dozen major fires burning by July 23-25. Many of the Alaskan wildfires had subsided by the end of the month (wildfire loop), but several large fires had started by early August in the Pacific Northwest.
- Much of the western U.S. has experienced dry conditions for the last five to six years. Continued dryness this month has exacerbated drought conditions across parts of the West.
- Reservoirs in the western states were still low or depleted.
- Streamflow levels were below seasonal norms across much of the West, both as computed by models and based on USGS observations. Below-normal monthly streamflows were also observed in parts of the Southeast, Alaska, and Hawaii.
- The percent area of the western U.S. (Rockies westward) experiencing moderate to extreme drought (as defined by the Palmer Drought Index) increased during July to about 80%. This is near 20th Century record historical levels, surpassed only by the droughts in 2002 and 1934.
Paleoclimatic Perspective
The northern High Plains area (western South Dakota, southwestern North Dakota, eastern Wyoming, and southeastern Montana) has experienced unusually dry conditions both in the short-term and long-term. The last 5 months have averaged consistently drier than normal (see graph below left), and the late spring-early summer (May-July) months have been drier than normal for the last 3 years (see graph below right).


The persistent dryness of the last 3 years gives August 2001-July 2004 a rank of fourth driest such 36-month period in the 1895-2004 record (graph below left). Long-term drought conditions (as measured by the Palmer Hydrological Drought Index) quickly reached severe levels (early 2003), comparable to but not surpassing the levels of the 1930s, early 1960s, and late 1980s droughts (graph below right).


When the 20th and 21st century record of drought for this region is compared to the multi-century record of drought reconstructed from tree rings, recent droughts can be evaluated in a longer-term context.

The graph to the right shows a northern High Plains summer (June-July-August average) Palmer Drought Severity Index (PDSI) record reconstructed from tree-ring data (light red line represents annual values, dark red values are smoothed with a 10-year running mean). These data are part of a gridded network of PDSI reconstructions recently generated by E.R. Cook and colleagues. These gridded tree-ring reconstructions have been scaled to match the variance in the instrumental gridded PDSI data, and the gridded instrumental data have been appended to the end of the reconstructions for the years 1979-2003.
The graph shows a record of regional drought from AD 900 to 2003 (red). The observed summer (June and July averaged) PDSI from divisional data is shown in blue (light blue line represents annual values, dark blue line represents smoothed values) for the years 1900-2004. The match between the two sets of drought records is very good and slight differences are due to the gridded versus divisional data and the months averaged. Three major periods of drought are evident in this record: the 1930s Dust Bowl, the 1950s-early 1960s, and the 1980s-early 1990s droughts. The current period of drought has not yet persisted long enough to match any one of these three droughts, in either duration or intensity. When viewed over the past 11 centuries, the three 20th century droughts are of relatively moderate severity, in terms of both duration and intensity. The low values of the 1930s drought in the smoothed record are not matched until the late 16th century, but droughts more recent than that have been more persistent (e.g., around 1700, and in the mid-19th century). Four notable periods of intense and prolonged drought occurred in the 900s, 1100s, mid-1200s, and the late 1300s. Intense but less persistent droughts occurred in the mid-1400s and late 1500s.


The same general pattern of drought is seen in subsections within the northern High Plains region, but some subsection-specific differences are also evident. In eastern Wyoming (graph above left, light thin lines represent annual values, dark thick lines represent smoothed values), for the same period of time, the major droughts in the 1100s and mid-1200s are present, but drought in the mid-1400s is more severe than the one in the late 1300s. In addition, a very prolonged, but moderate drought occurred over a large part of the 19th century. In the reconstruction for northwestern South Dakota (graph above right, light thin lines represent annual values, dark thick lines represent smoothed values), this period of prolonged drought in the 19th century is also evident. Major droughts in the mid-1200s and mid-1400s are in common with the other regional reconstructions. A notable aspect in this record is the suggestion of a change in drought regime prior to about 1300. Annual PDSI values are much more consistently negative, and the smoothed values suggest a regime of more prolonged drought, in this part of the record. This indication of a regime shift is also evident in the eastern Wyoming reconstruction, although less pronounced.
Resources:
The new gridded network of reconstructed PDSI will soon be available from the NOAA Paleoclimatology Branch. In the meantime, the original PDSI reconstruction network is available at:
The general methodology for the gridded PDSI reconstruction can be found in:
- Cook, E.R., D.M. Meko, D.W. Stahle, and M.K. Cleaveland, 1999. "Drought reconstructions for the continental United States." Journal of Climate 12: 1145-1162.