National Overview
On the national scale,
|
 larger image |
 larger image |
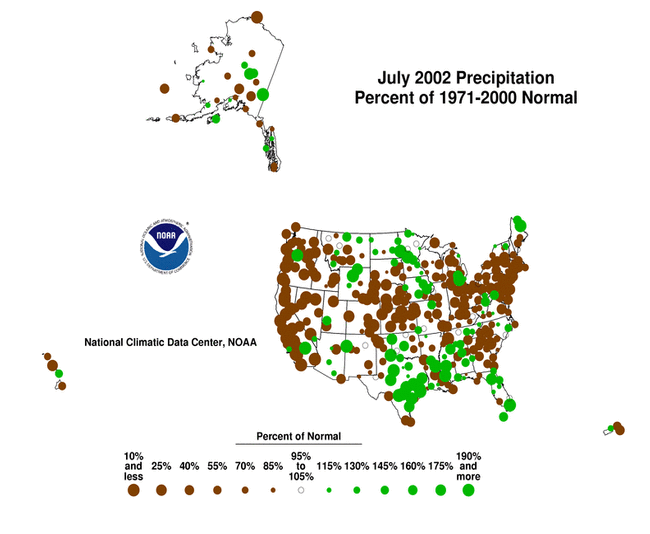
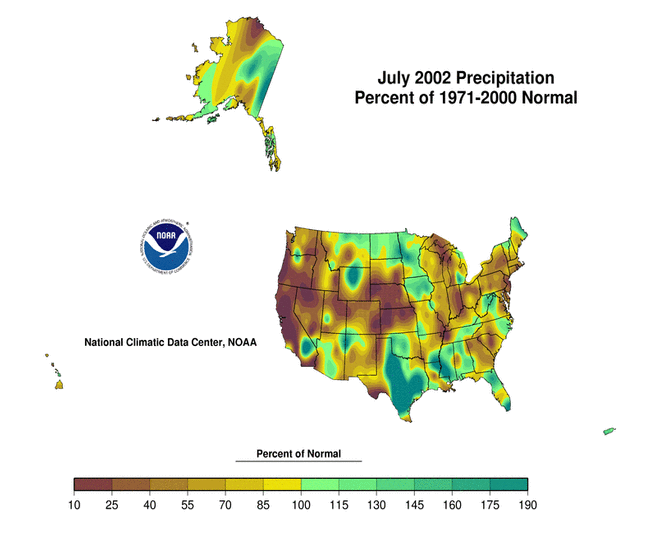
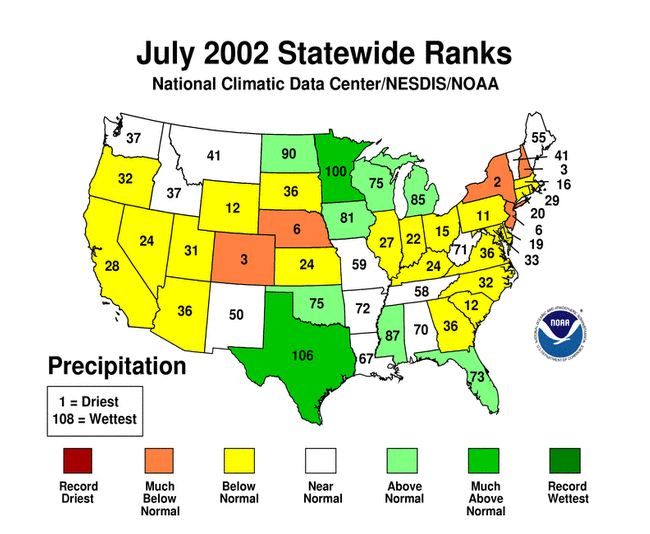
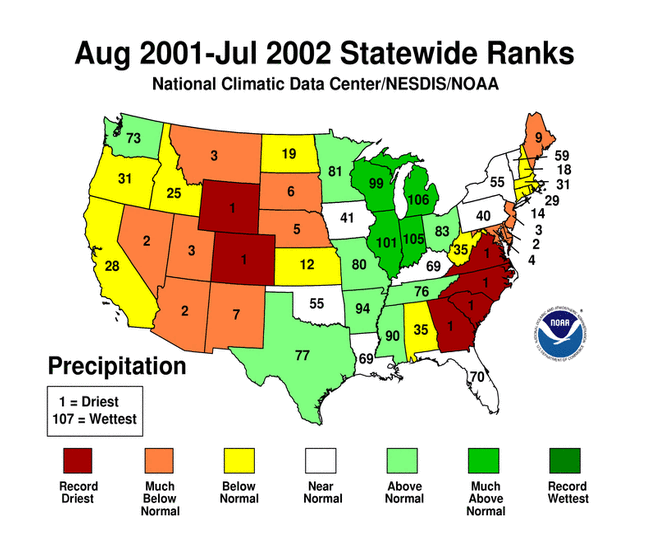
| Although some areas of the U.S. had above normal precipitation, many areas were very dry. Integrated across the nation, July 2002 precipitation averaged about normal. Twelve of the last 35 months have averaged well below the normal, while only three averaged well above normal (see graph top right). National 2001-2002 precipitation ranks:
|
| |
|
Regional Overview
|
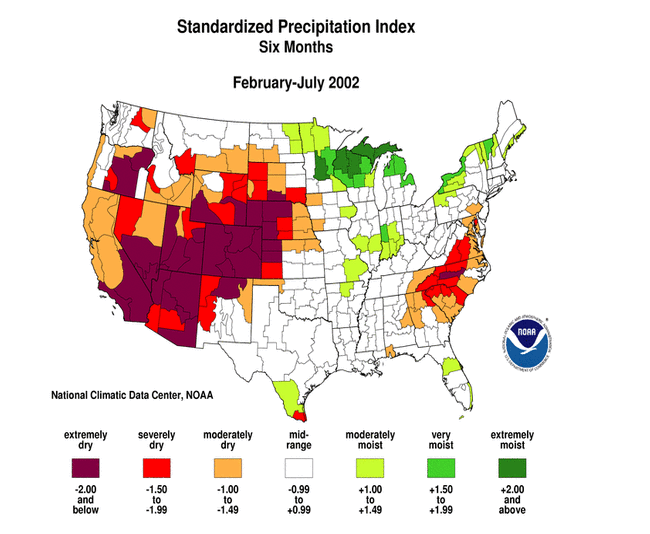
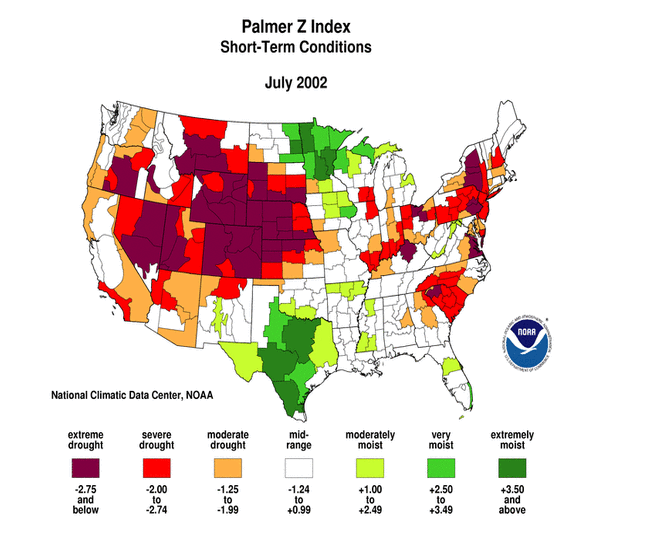
July saw the continuation of very dry conditions across much of the western states, central Great Plains, and parts of the Southeast. This month brought a dry interruption to the recently wet conditions in the Northeast and a second dry month to the otherwise wet Ohio Valley. Unusually hot conditions accompanied the dryness.
July was dry at most of the primary stations in Hawaii and Alaska. The last two months have had subnormal rainfall across much of Puerto Rico.
These overall conditions are evident in the following indicators:
Two other drought-related monitoring tools are the Vegetation Health Index and the Keetch-Byram Drought Index:
|

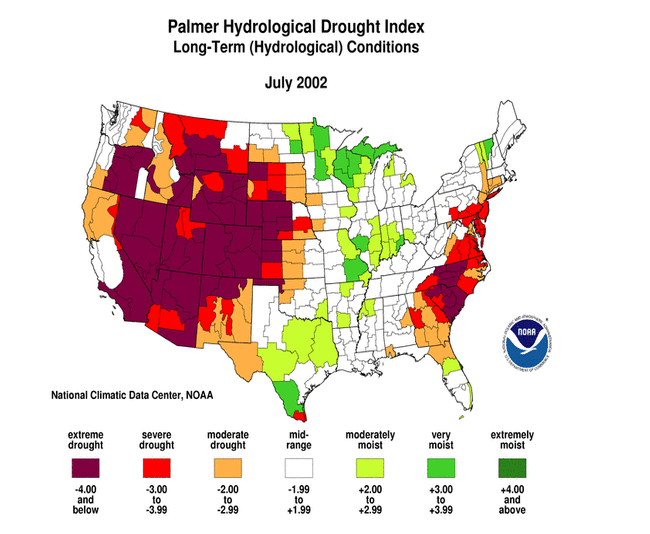
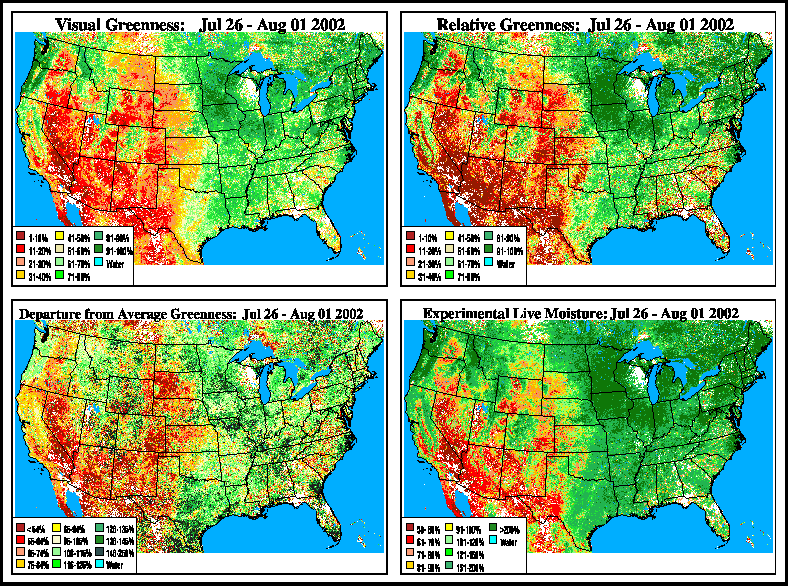
Western U.S. Drought
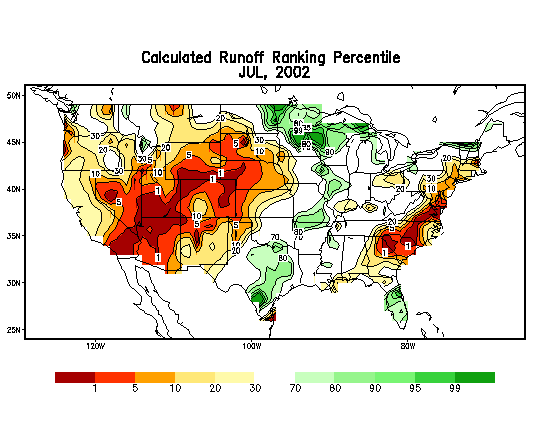
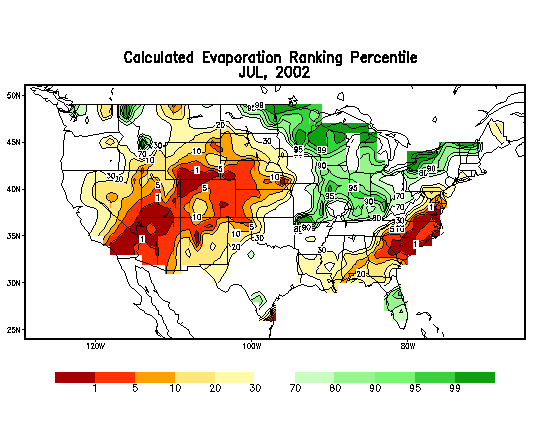
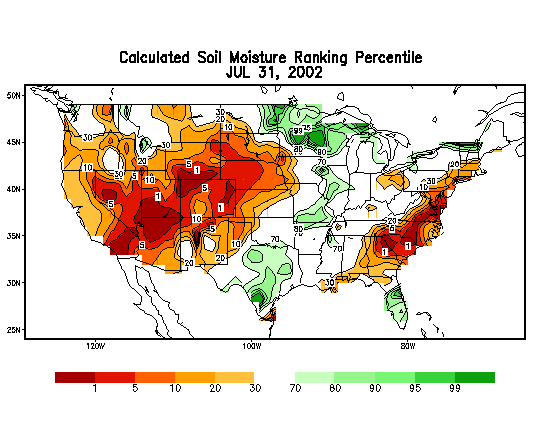
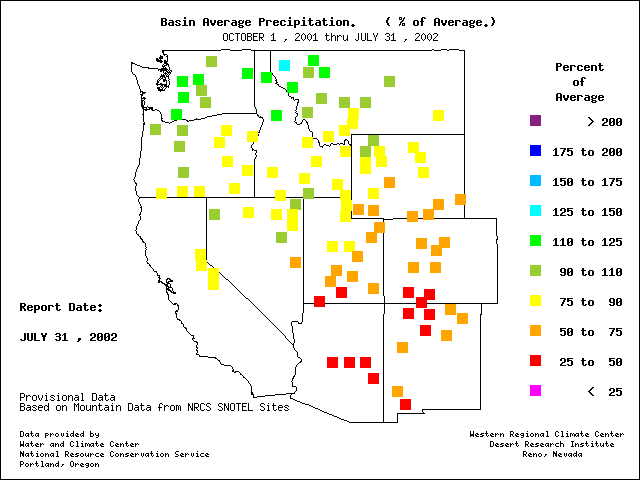
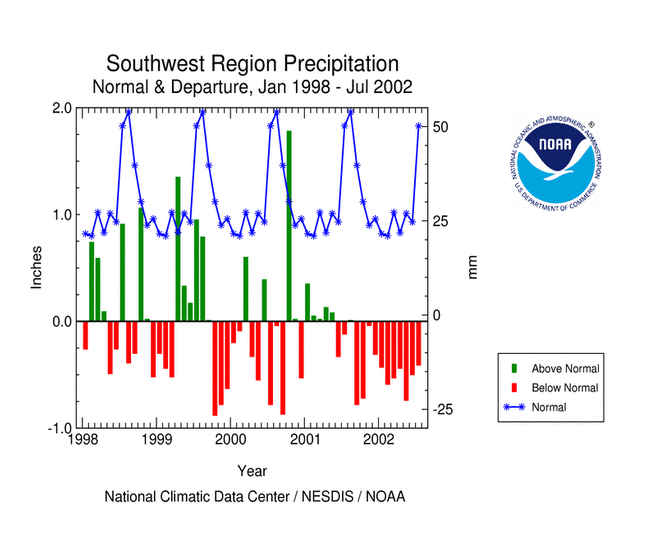
| July is in the dry season for much of the West and Northwest regions, so below normal summer precipitation has less of an impact here than in the winter. However, this month marks the beginning of the wet season for the Southwest region and the northern Rockies. On a regional basis, July 2002 was drier than normal across these western areas. The combination of subnormal rainfall and hot temperatures resulted in widespread severe to extreme short-term drought. The cumulative effect of the dryness over the last several months in the Southwest has resulted in record dry seasons from May-July back to August-July. Severe to extreme long-term drought was widespread across the western U.S. Water year (October 2001-present) precipitation totals were above average in the Northwest reflecting a rainy wet season earlier, but totals dropped precipitously toward the Rockies and the Southwest. |
 larger image |
 larger image |
|
Numerous wildfires continued across the West during July, agriculture and the cattle industry were severely impacted, and water shortages were experienced in many localities. According to govexec.com, this fire season has already seen record fire losses -- 4 million acres and more than 1,800 homes have been burned.
By the end of July, topsoil moisture conditions were extremely dry across much of the western U.S. According to July 28 USDA reports, 80% or more of the topsoil was short to very short in Wyoming (96%), Colorado (94%), New Mexico (81%), Utah (81%), and Oregon (80%). Range and pasture conditions deteriorated in many areas during July. By the end of the month (according to the July 28 Weekly Weather and Crop Bulletin), conditions on 43% of the nation's pastures and rangeland were poor or very poor (compared to 31% at this time last year):
|
|
A detailed discussion of drought conditions is available for the following regions and states: |
 larger image |
Central U.S. Drought
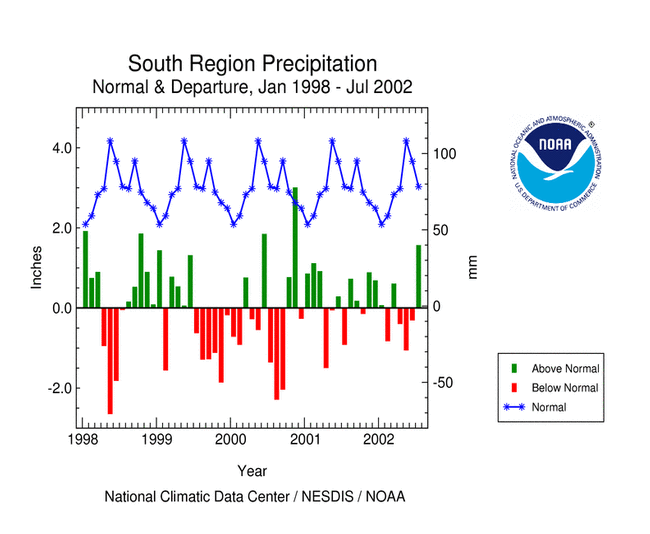
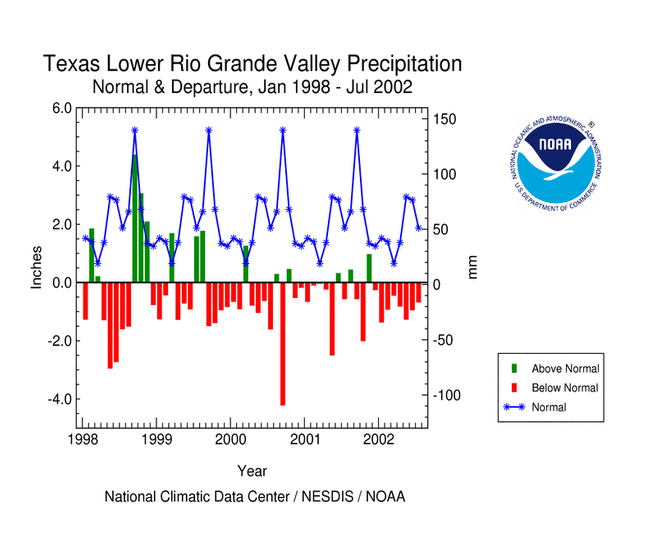
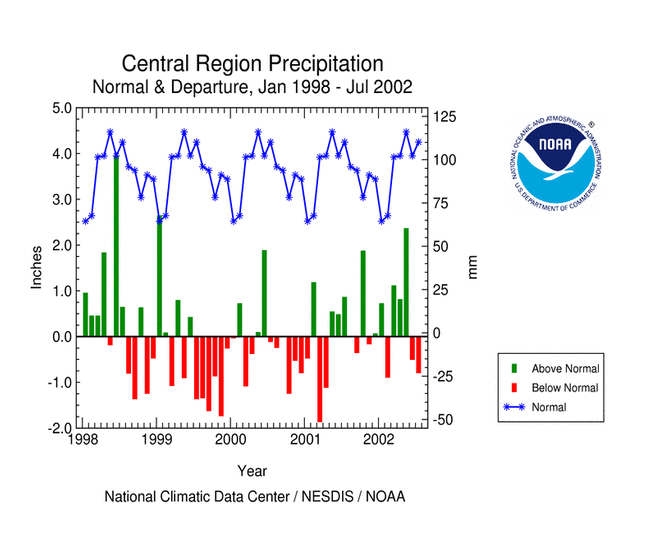
| July saw the continuation of severely dry conditions across the northern High Plains and central Plains states (see graph below left), and this was the second month of dry conditions across parts of the Ohio Valley and southern Great Lakes (see graph below right). Heavy rains brought relief to much of the southern Plains, except for the Lower Rio Grande Valley of deep south Texas, which continued to experience severe long-term drought. |
 larger image |
 larger image |
|
By the end of July, topsoil moisture conditions were extremely dry across much of the central and northern Plains, ravaging crops in many areas. According to July 28 USDA reports, 80% or more of the topsoil was short to very short in Nebraska (94%), Kansas (87%), South Dakota (84%), and Ohio (81%). Range and pasture conditions deteriorated in many areas during July. By the end of the month (according to the July 28 Weekly Weather and Crop Bulletin),
|
| A detailed discussion of drought conditions is available for the following regions and states: |
 larger image |
Eastern U.S. Drought
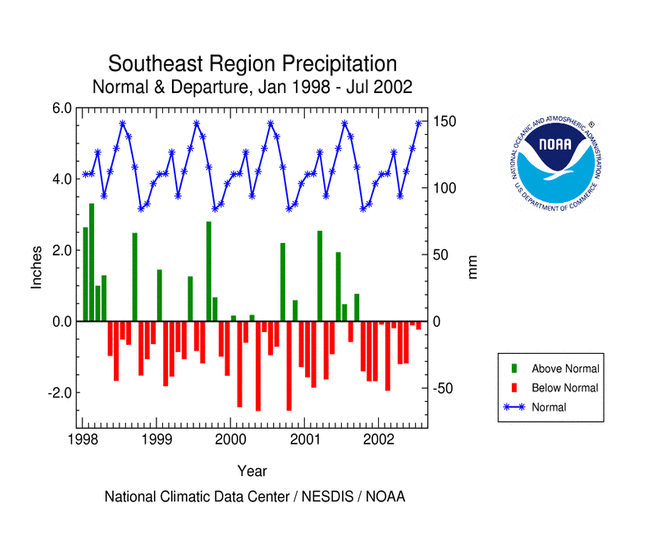
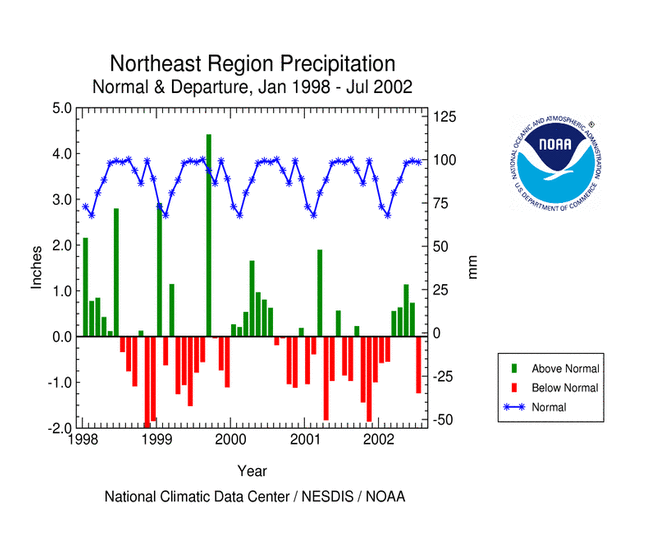
| July saw dryness return to the Northeast region. In the Southeast, conditions averaged near normal across the region but some areas continued extremely dry. This month marked the tenth consecutive month with slightly to much below normal precipitation averaged across the Southeast. |
 larger image |
 larger image |
By the end of July, topsoil moisture conditions were extremely dry across much of the eastern seaboard. According to July 28 USDA reports, 80% or more of the topsoil was short to very short in Rhode Island (100%), South Carolina (87%), and Pennsylvania (82%).
Range and pasture conditions deteriorated in many areas during July. By the end of the month (according to the July 28 Weekly Weather and Crop Bulletin),
- more than 50% of the range and pasture lands were reported in poor to very poor in South Carolina (60%), Maryland (60%), Delaware (58%), North Carolina (55%), Virginia (53%), and Pennsylvania (53%).
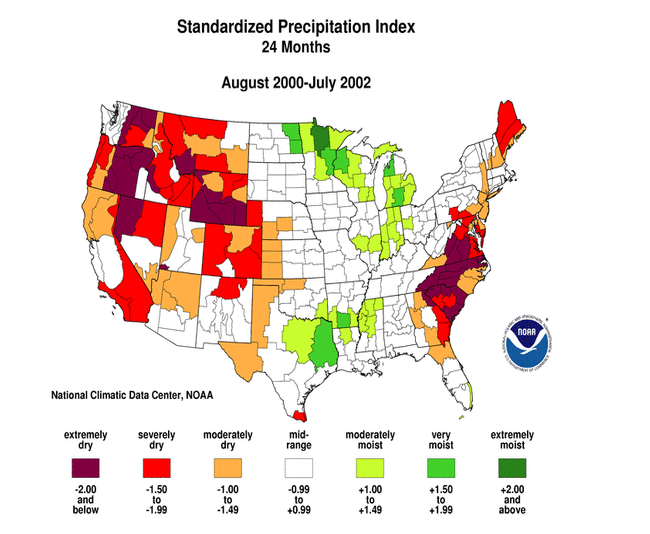
Severe to extreme long-term drought persisted from Long Island and southern Pennsylvania to central Georgia. The long-term deficits were so severe that four states (VA, NC, SC, GA) had the driest August-July in the 108-year record.
|
A detailed discussion of drought conditions is available for the following regions and states: |
 larger image |
 larger image |
 larger image |

Additional Contacts:
Damage due to the drought has been summarized by NOAA and the Office of Global Programs in the Climatological Impacts section of the Climate Information Project. Crop impact information can be found at the USDA NASS (National Agricultural Statistics Service) and Weekly Weather and Crop Bulletin pages. Drought statements by local National Weather Service Offices can be found at the NWS Hydrologic Information Center. Drought threat assessments and other information can be found at NOAA's Drought Information Center. Additional drought information can be found at the National Drought Mitigation Center, the USDA's National Agricultural Library, the interim National Drought Council, and the NOAA Paleoclimatology Program. The following states have set up web pages detailing current drought conditions and/or their plans to handle drought emergencies:
For additional information on current and past wildfire seasons please see the National Interagency Fire Center web site or the U.S. Forest Service Fire and Aviation web site. NCDC's Drought Recovery Page shows the precipitation required to end or ameliorate droughts and the probability of receiving the required precipitation. Additional climate monitoring graphics can be found at the Climate Prediction Center's monitoring pages:
Drought conditions on the Canadian prairies can be found at the Agriculture and Agri-Food Canada Drought Watch page. |