National Overview
On the national scale,
|
 larger image |
 larger image |
| Although some areas of the U.S. had above normal precipitation, many areas were very dry. Integrated across the nation, June 2002 precipitation averaged below normal. Twelve of the last 34 months have averaged well below the normal, while only three averaged well above normal (see graph top right). National 2001-2002 precipitation ranks:
|
 larger image  larger image |
Regional Overview
|
June was very dry across the mid-Atlantic states of Virginia and the Carolinas and parts of the southern Great Lakes, and hot and dry across much of the western U.S. and adjoining Great Plains.
Beneficial rains continued for a fourth month bringing drought relief to a good part of the Northeast.
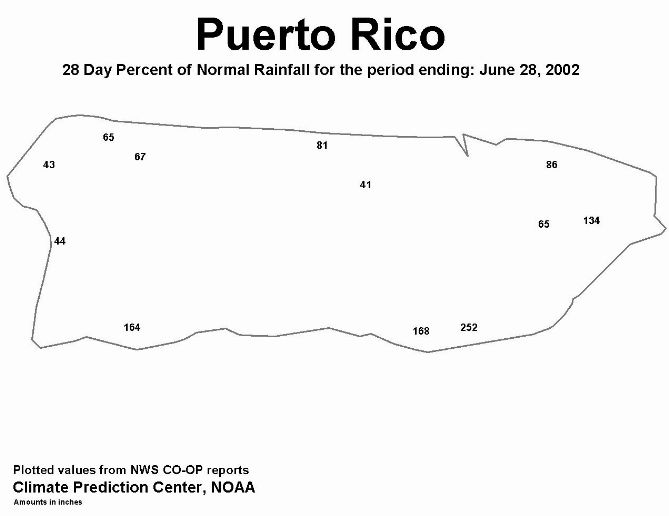
June was dry at the primary stations in Hawaii and many stations in Alaska. June and early July were dry across much of northern and western Puerto Rico.
These overall conditions are evident in the following indicators:
Two other drought-related monitoring tools are the Vegetation Health Index and the Keetch-Byram Drought Index:
|

Western U.S. Drought
| While above-normal rain fell across parts of the Pacific Northwest and northern Rockies, the Northwest region on the whole was drier than normal, with June marking the second consecutive slightly drier than normal month. However, this month marked the tenth and sixth consecutive drier-than-normal month, respectively, for the Southwest and West regions (see graphs below). Water year (October 2001-present) precipitation totals were above average in the Northwest, but totals dropped precipitously toward the Rockies and the Southwest. |
 larger image |
 larger image |
Several wildfires developed in the West during June, with Colorado and Arizona experiencing their largest wildfires ever. According to the June 22 New York Times,
"The Arizona fires pushed national firefighting efforts to an unusual level for June. With 18 large fires burning in eight states � Arizona, California, Colorado, Georgia, Nevada, New Mexico, Utah and Wyoming � the National Interagency Fire Center in Boise, Idaho, declared the country at Level 5, the earliest that has ever been reached. It means that fires are raging in more than two geographical areas, and that they have the potential to exhaust all available federal firefighters and fire equipment." Seasonal wildfire statistics, according to the National Interagency Fire Center:
As of early July (the week ending July 7), 37% of the nation's range and pastures had moisture conditions ranked as poor to very poor by the USDA. Five western states had more than 70% of their range and pastures in poor to very poor conditions:
|
|||||||||||||||||||||||||||||||||||||||||||||||||||||||||||||||||||||||||||
|
Several western states had the driest April-June, January-June, and July-June in their 108-year record.
A detailed discussion of drought conditions is available for the following regions and states:
|
 larger image |
Central U.S. Drought
| June 2002 saw an expansion of drought into the central and northern Plains states and a continuation of dry conditions across parts of the southern Plains. This was the seventh consecutive month with below-normal precipitation, regionwide, for the West North Central region and third consecutive dry month, regionwide, for the South region. According to the USDA, moisture conditions in some of the agricultural states grew progressively worse during the month. |
 larger image |
 larger image |
|
The extreme dryness of the last six months (see map to right) has resulted in precipitation ranks (April-June, January-June) in the top ten driest category for some central states.
A detailed discussion of drought conditions is available for the following regions and states:
|
 larger image |
Eastern U.S. Drought
| Much of the Northeast region experienced continued relief from drought as June 2002 marked the fourth consecutive month with above-normal precipitation. The Southeast region did not fare as well. Southern and central Florida had a very wet June, but much of Virginia, Tennessee, and the Carolinas were dry (see map below left). This month marked the ninth consecutive month with slightly to much below normal precipitation averaged across the Southeast (see graph below right). |
 larger image |
 larger image |
|
Severe to extreme long-term drought persisted from southern Pennsylvania to central Georgia. In spite of recent rains, the late 2001 to February 2002 moisture deficits were so severe that many states up and down the east coast had the tenth driest, or drier, July-June on record.
A detailed discussion of drought conditions is available for the following regions and states:
|
 larger image |
 larger image |
 larger image |

 Additional Contacts:
Damage due to the drought has been summarized by NOAA and the Office of Global Programs in the Climatological Impacts section of the Climate Information Project. Crop impact information can be found at the USDA NASS (National Agricultural Statistics Service) and Weekly Weather and Crop Bulletin pages. Drought statements by local National Weather Service Offices can be found at the NWS Hydrologic Information Center. Drought threat assessments and other information can be found at NOAA's Drought Information Center. Additional drought information can be found at the National Drought Mitigation Center, the USDA's National Agricultural Library, the interim National Drought Council, and the NOAA Paleoclimatology Program. The following states have set up web pages detailing current drought conditions and/or their plans to handle drought emergencies:
For additional information on current and past wildfire seasons please see the National Interagency Fire Center web site or the U.S. Forest Service Fire and Aviation web site. NCDC's Drought Recovery Page shows the precipitation required to end or ameliorate droughts and the probability of receiving the required precipitation. Additional climate monitoring graphics can be found at the Climate Prediction Center's monitoring pages:
Drought conditions on the Canadian prairies can be found at the Agriculture and Agri-Food Canada Drought Watch page. |