Contents Of This Report:

 National Overview
| On the national scale, severe drought affected about eleven percent of the contiguous United States as of the end of February 2001. The total drought area has held steady at about 10 to 15 percent for the last five months (see graph below left). The 2000 drought peaked at about 36% coverage in August, which was as extensive as the major droughts of the last 40 years, but not as large as the "dust bowl" droughts of the 1930's and 1950's. On a broad scale, the last two decades were characterized by unusual wetness with short periods of extensive droughts, whereas the 1930's and 1950's were characterized by prolonged periods of extensive droughts with little wetness (see graph below right).
During February 2001, the U.S. Pacific Northwest experienced the fourth dry month in a row (click here for the Palmer Z Index map for February, January, December, and November), while conditions improved over California and Nevada with the passage of several wet weather systems. The month was dry along the Gulf coast and part of the east coast, resulting in a continuation of the long-term drought conditions across much of the Deep South. Although different parts of the U.S. have experienced unusually wet conditions during the last 17 months, there continues to be little change in the overall national wetness picture. The percentage of the nation severely wet has held steady at about five to ten percent during this period (see graph below left). |
 |
 |
Palmer Drought Indices
| The Palmer Z Index shows how monthly moisture conditions depart from normal (short-term drought and wetness). February 2001 was severely dry in parts of the Pacific Northwest and along the Gulf coast. Moderate to severe dryness occurred along the central and southern Atlantic states. Florida was extremely dry this month. The animated maps to the right show the geographical pattern of the moisture anomalies for the last 12 months. On these maps, the red shading denotes dry conditions while the green shading indicates wet conditions. |  |
 |
The Palmer Drought Index maps show long-term (cumulative) meteorological drought and wet conditions. Long-term meteorological drought persisted across parts of the Deep South and southern Appalachians, and long-term persistent dryness intensified across parts of the Pacific Northwest. The animated maps show how the geographical pattern of the long-term (meteorological) moisture conditions has changed over the last 12 months. On these maps, the red shading denotes drought conditions while the green shading indicates wet conditions. |
| The Palmer Hydrological Drought Index maps show hydrological (long-term cumulative) drought and wet conditions, which more accurately reflect groundwater conditions, reservoir levels, etc. The PHDI indicates that hydrological drought intensified through the end of February across the Gulf Coast and Pacific Northwest states. Conditions improved in the Tennessee Valley and northern Great Lakes. The animated maps to the right show the geographical pattern of the long-term (hydrological) moisture anomalies for the last 12 months. On these maps, the red shading denotes dry conditions while the green shading indicates wet conditions. |  |
Regional Drought Watch:
- much of the Pacific Northwest and Deep South experienced dry conditions both on the short-term (out to three months) and long-term (nine months and longer) time scales;
- much of the eastern third of the country experienced severe short-term (out to six months) precipitation shortfalls but wet conditions earlier in 2000 resulted in mid-range (near normal) long-term precipitation conditions in the Northeast; and
- unusually wet short-term conditions have occurred across parts of the central and southern Plains into the southern Great Lakes.
Standardized Precipitation Index
| The Standardized Precipitation Index (SPI) is another way of measuring drought. The SPI is an index based on the probability of recording a given amount of precipitation, and the probabilities are standardized so that an index of zero indicates the median precipitation amount (half of the historical precipitation amounts are below the median, and half are above the median). The index is negative for drought, and positive for wet conditions. As the dry or wet conditions become more severe, the index becomes more negative or positive. While the Palmer Drought Index is a water balance index that considers water supply (precipitation), demand (evapotranspiration) and loss (runoff), the SPI is a probability index that considers only precipitation.
The seven maps below show the February 2001 spatial patterns of SPI for seven different periods ranging from one month (short-term conditions) to 24 months (long-term conditions). When taken together, they give a combined geographical and temporal picture of the severity of precipitation anomalies. The maps illustrate, for example: |
 |
 |
 |
 |
 |
 |
 |
Regional Overview
| The following table shows the precipitation ranks for the nine standard U.S. regions for February 2001, the three-month period December 2000-February 2001, and the twelve-month period March 2000-February 2001. A rank of 1 is driest and 107 (for February, 106 for the other periods) is wettest.
|
|
| The map to the right shows the departure from normal of the number of days with measurable precipitation for the three-month period December 2000-February 2001. The short-term dryness in the Northeast, Northwest, Central, and North Central regions, as well as Hawaii and parts of the Southeast, shows up on this map as significant below-normal (brown) number of precipitation days. |  |
Southeast Drought
| Heavy rains fell upon the northwest fringe of the U.S. Deep South (AL, FL, GA, LA, MS) during February, however precipitation averaged across the region was still well below normal (see graph below left). February 2001 ranked as the 24th driest February in the region's aggregate record. Only two of the last 16 months had regionwide precipitation above normal (see graph below left), giving the 12-month period, March 2000 - February 2001, a rank of eighth driest such period on record (see graph below right). The Deep South region has suffered from drought for the last two and a half years, resulting in two consecutive very dry March-February "years" (see graph below right). Across the Southeast region, February 2001 ranked as the 17th driest February on record and March 2000-February 2001 ranked as the third driest such 12-month period.
|
|
|
The lack of precipitation, coupled with very low streams and lakes, had South Carolina state officials concerned that more ponds and wells may go dry this spring and summer than last year. An official drought declaration status has remained in effect for the state since October 26, 2000. Drought has been blamed as the cause for one of the worst shrimping seasons on record in Georgia, and streams in the state were at record or near-record low levels by the end of the month. In North Carolina, at least 72 of the 101 streams monitored by the U.S. Geological Survey during the first two weeks of February set daily record lows or flowed at minimal levels, while more than half of the South Carolina streams set daily low-flow records during the weekend of February 10-11. When no rain falls, streams run almost entirely with groundwater, further draining those reserves. For the third year in a row, slow, soaking winter rains have failed to replenish the groundwater in this region. Wells in the Great Smoky Mountains in the southern Appalachians are running dry or low, and wells maintained by North Carolina state officials in Greenville and Charlotte have reached record low levels. The Governor of Mississippi issued a ban on all outdoor open burning because of concerns over a recent rash of wildfires.
|
 |
| Much of Florida experienced another dry month in February. Only one month out of the last 16 had above-normal precipitation (see graph below), giving the state the driest March - February (see graph below left) and October - February (see graph below right) on record in 2000-2001. The current drought, which had its beginnings when the El Nino rains stopped during the latter part of March 1998, has resulted in three back-to-back dry March - February "years" (see graph below left). The wettest October - February on record (see graph below right) occurred in 1997-98, just prior to the beginning of the drought. |
|
| The cumulative effects of the Florida moisture deficits have resulted in the most severe Palmer Drought Index since the 1930's. Impacts from the drought include wildfires, record and near-record low streamflows, lake and groundwater levels, and emergency mandatory water-use restrictions in many Florida communities. Over 1,300 wildfires have burned more than 83,000 acres since the first of the year, including a fire that closed a 17-mile section of Interstate 4, a heavily traveled route between Orlando and Tampa. Lake Okeechobee dropped to record low levels by early March 2001.
|
 |
Pacific Northwest Dryness
| Much of the Pacific Northwest experienced the fourth dry month in a row in February 2001 (see graph below left). This persistent dryness occurred during the normally wet season and resulted in the second driest November-February (see graph below right) on record during the 2000-2001 season. Only 1976-77, the year with the most severe drought in this region, was drier. The Pacific Northwest has a strong seasonal variation in precipitation, with over half of the annual precipitation falling during the four-month period November-February. The extremely dry wet season during 2000-2001 has resulted in a rank of second driest for each period from March-February through December-February (see table to right). Rivers are setting new February records for low flows in some Oregon and Washington valleys, reservoir levels continue to be generally below normal, and mountain snowpack continued less than 70% of normal for the end of February in many river basins and near 50% of normal or less in others. |
|
 |
 |
Western Region Dryness
| Frequent storms moving across California and Nevada brought above normal precipitation to the West region during February (see graph below left). However, the dryness during the first two months of this wet season gave the region the 17th driest November-February on record (see graph below right). Statewide snowpack continued to be low in California, but water storage in reservoirs was generally near normal. |
 |
 |
Northeast U.S. Dryness
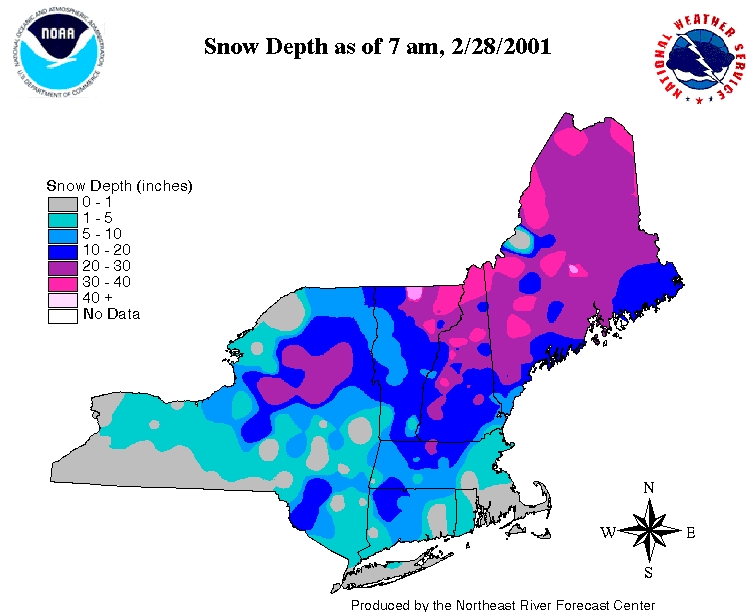
| February 2001 precipitation averaged across the Northeast region was below normal, with the month ranking as the 21st driest February on record. Four of the last five months have had below normal precipitation (see graph to right), giving the region the fourth driest October - February on record. The Standardized Precipitation Index shows the region in short-term drought, but near normal precipitation in December and wet conditions during the first half of 2000 have kept the long-term conditions in balance, with March 2000-February 2001 ranking as the 39th wettest (68th driest) such 12-month period on record. It should also be noted that a significant potential spring water supply remains locked up across much of the region in a deep widespread snow cover. |  |
Additional Contacts:
| Damage due to the drought has been summarized by NOAA and the Office of Global Programs in the Climatological Impacts section of the Climate Information Project. Crop impact information can be found at the USDA NASS (National Agricultural Statistics Service) and Weekly Weather and Crop Bulletin pages. Drought statements by local National Weather Service Offices can be found at the NWS Hydrologic Information Center. Drought threat assessments and other information can be found at NOAA's Drought Information Center. Additional drought information can be found at the National Drought Mitigation Center, the USDA's National Agricultural Library, and the NOAA Paleoclimatology Program. The following states have set up web pages detailing their drought emergencies:
New Mexico - North Carolina - Oklahoma - South Carolina - Texas For additional information on the 2000 wildfire season please see the National Interagency Fire Center web site or the U.S. Forest Service Fire and Aviation web site. Additional climate monitoring graphics can be found at the Climate Prediction Center's monitoring pages: |