U.S. Drought Highlights:
|
Contents Of This Section: |

|

On the national scale,
|
|


During April 2001, the U.S. Pacific Northwest continued to suffer from drought in spite of a wetter-than-normal month. Dry conditions returned to the southern Plains and the Northeast, and April marked the second dry month in a row for the Ohio Valley. This pattern is evident in:
|
|
| The Palmer Z Index shows how monthly moisture conditions depart from normal (short-term drought and wetness). April 2001 was severely dry across much of the country from the Northeast to Texas and Florida. Moist conditions during April brought temporary relief from the drought to the Pacific Northwest. Heavy rains from the central Plains to the northern Great Lakes contributed to flooding of the upper Mississippi River. The animated maps to the right show the geographical pattern of the moisture anomalies for the last 12 months. On these maps, the red shading denotes dry conditions while the green shading indicates wet conditions. |  larger animated image |
 larger animated image |
The Palmer Drought Index maps show long-term (cumulative) meteorological drought and wet conditions. Long-term meteorological drought persisted across the Pacific Northwest and intensified across Florida and from the southern Appalachians to Ohio Valley. The animated maps to the left show how the geographical pattern of the long-term (meteorological) moisture conditions has changed over the last 12 months. On these maps, the red shading denotes drought conditions while the green shading indicates wet conditions. |
| The Palmer Hydrological Drought Index maps show hydrological (long-term cumulative) drought and wet conditions, which more accurately reflect groundwater conditions, reservoir levels, etc. The PHDI indicates that hydrological drought persisted through the end of April across the Pacific Northwest states, and hydrologic conditions deteriorated across parts of the Southeast, Ohio Valley, and Northeast. The animated maps to the right show the geographical pattern of the long-term (hydrological) moisture anomalies for the last 12 months. On these maps, the red shading denotes dry conditions while the green shading indicates wet conditions. |  larger animated image |
|
|
| The Standardized Precipitation Index (SPI) is another way of measuring drought. The index is negative for drought, and positive for wet conditions. The SPI is a probability index that considers only precipitation, while Palmer's indices, shown in the previous maps, are water balance indices that consider water supply (precipitation), demand (evapotranspiration) and loss (runoff).
The seven maps below show the April 2001 spatial patterns of SPI for seven different periods ranging from one month (short-term conditions) to 24 months (long-term conditions). When taken together, they give a combined geographical and temporal picture of the severity of precipitation anomalies. The maps illustrate, for example:
|
 larger image |
 larger image |
 larger image |
 larger image |
 larger image |
 larger image |
 larger image |
|
| The following table shows the precipitation ranks for the nine standard U.S. regions for April 2001, the three-month period February-April 2001, and the twelve-month period May 2000-April 2001. A rank of 1 is driest and 107 (106 for May-April) is wettest.
|
|
| The map to the right shows the departure from normal of the number of days with measurable precipitation for April 2001. The short-term dryness in the Northeast, Southeast, and southern Plains shows up on this map as significant below-normal (brown) number of precipitation days. The above-normal precipitation in the West and Northwest regions is reflected in a preponderance of above-normal rain days. The rain day anomaly pattern was mixed in Alaska and Hawaii. |  larger image |
|
April brought above-normal precipitation to much of the Pacific Northwest. This was a welcomed change from the unusually dry conditions that characterized much of the previous five months (see graph below left). Ranks for 2001:
The well below normal reservoir levels and mountain snowpack are having a major impact on water supplies. Severe agricultural impacts have been noted in parts of Oregon and northern California. A potentially severe wildfire season is of concern to those in the Pacific Northwest. |
|
 larger image |
 larger image |
| Parts of the northern Rockies and northern High Plains have experienced dry conditions. For example, Montana had below-average surface wetness and soil moisture in April. Long-term dry conditions have resulted in the 13th driest May-April on record with the statewide Palmer Drought Index dropping to the lowest levels since the drought of the late 1980's. |
 larger image |
The West region (California and Nevada) had a wet April. The 2000-2001 rainy season started out dry (see graph to left), but rains during the last half helped replenish reservoirs and add to the mountain snowpack. The severity of the dryness at the start of the season, however, resulted in the 29th driest May-April on record. |
|
| April was dry for much of the Southeast and southern Plains regions (see graphs below). Although some parts of the Southeast have seen recent drought relief, long-term drought continued region-wide. The hardest-hit areas have had moisture deficits for the last three years, tracing the drought to the onset of La Niña conditions in early 1998. For the Southeast region, |
Conditions in Florida were especially severe:
|
|
 larger image |
 larger image |
| April 2001 ranked as the fourth driest April on record for the southern Plains. This is a departure from the last three months, which were wetter than normal (see graph above right). When the unusual wetness of October 2000-March 2001 is combined with the dryness of April this year and last summer, the precipitation ranks fall in the mid-range (see regional overview table above). |
|
April marked the second month in a row with much below normal precipitation averaged across the Central region (see graph below left). Ranks for 2001:
|
 larger image |
 larger image |
|
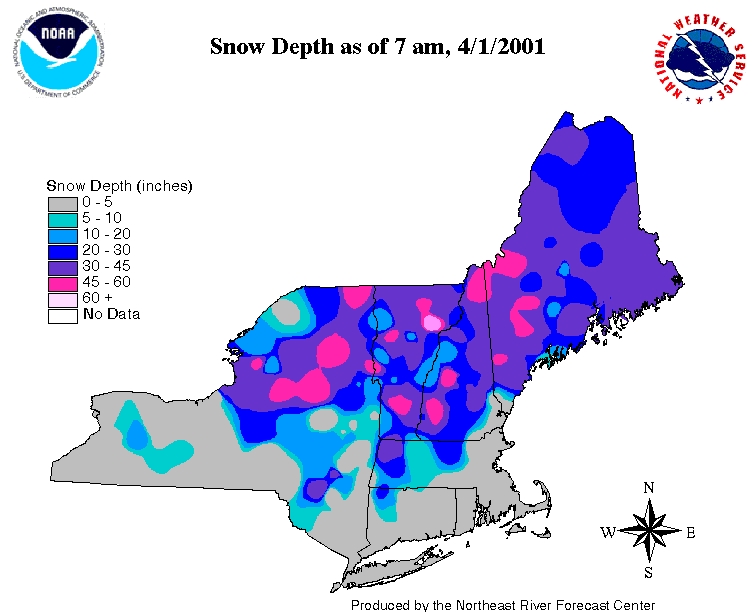
| April 2001 was the third driest April on record in the Northeast region (see graph below right) and marked a return to the predominantly dry conditions which have characterized the region during much of the last seven months (see graph below left). October 2000-April 2001 ranked as the ninth driest such period in the 1895-2001 record, but when the unusual wetness of late spring and early summer 2000 is factored in, the last 12 months ranked as only the 40th driest May-April.
The heavy snow cover at the beginning of the month rapidly melted and was nearly gone by late April. Unusually warm temperatures during late April and early May increased the threat of fire danger to parts of the region, especially Maine, which had the driest April and seventh driest February-April. |
 larger image |
 larger image |
|
| Damage due to the drought has been summarized by NOAA and the Office of Global Programs in the Climatological Impacts section of the Climate Information Project. Crop impact information can be found at the USDA NASS (National Agricultural Statistics Service) and Weekly Weather and Crop Bulletin pages. Drought statements by local National Weather Service Offices can be found at the NWS Hydrologic Information Center. Drought threat assessments and other information can be found at NOAA's Drought Information Center. Additional drought information can be found at the National Drought Mitigation Center, the USDA's National Agricultural Library, the interim National Drought Council, and the NOAA Paleoclimatology Program. The following states have set up web pages detailing their plans to handle drought emergencies:
New Mexico - North Carolina - Oklahoma - South Carolina - Texas - Washington For additional information on the 2001 wildfire season please see the National Interagency Fire Center web site or the U.S. Forest Service Fire and Aviation web site. Additional climate monitoring graphics can be found at the Climate Prediction Center's monitoring pages: |