U.S. Drought Highlights:

  • On the national scale, severe drought affected about 15 percent of the contiguous United States as of the end of December 2001
  • Beneficial rain and snow fell over parts of the western U.S. during the last three months, but much of the region continued to suffer from long-term moisture deficits and hydrological impacts of drought
  • Drought continued across much of the eastern seaboard and parts of the southern Plains

National Overview

On the national scale,
  • severe drought affected about 15 percent of the contiguous United States as of the end of December 2001;
  • the coverage of the current drought peaked in August 2000 at about 36% of the contiguous U.S., which was as extensive as the major droughts of the last 40 years, but not as large as the "dust bowl" droughts of the 1930's and 1950's;
  • the total drought area decreased to about 10 percent by November 2000, but has shown a general increasing trend for much of the period since then, with a slight drop recently (see graph below left);
  • on a broad scale, the last two decades were characterized by unusual wetness with short periods of extensive droughts, whereas the 1930's and 1950's were characterized by prolonged periods of extensive droughts with little wetness (see graph below right);
  • although different parts of the U.S. have experienced unusually wet conditions during the last 27 months, there continues to be little change in the overall national wetness picture;
  • the percentage of the nation severely wet has held steady at about three to eleven percent during this period (see graph below left);
  • a file containing the national monthly percent area severely dry and wet from 1900 to present is available;
  • historical temperature, precipitation, and Palmer drought data from 1895 to present for climate divisions, states, and regions in the contiguous U.S. are available at the Climate Division: Temperature-Precipitation-Drought Data page.
Click here for graphic showing U.S. Drought and Wet Spell Area, 1996-present
larger image
Click here for graphic showing U.S. Drought and Wet Spell Area, 1900-present
larger image

Although some areas of the U.S. had well above normal precipitation, many areas were very dry. December averaged near normal when precipitation is integrated across the nation. Eleven of the last 29 months have averaged well below the normal, while only three averaged well above normal (see graph to right). National 2001 precipitation ranks: Click here for graphic showing U.S. Precipitation Departure and Normals, January 1998-December 2001
larger image

Regional Overview

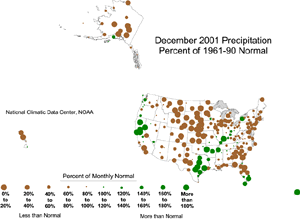
Beneficial rain and snow during October through December brought an end to short-term drought over much of the western U.S., however long-term drought continued to plague much of the region, especially along the Rocky Mountains. December was dry across parts of the northern Rockies, Gulf Coast, and northern and central Plains. December marked the third consecutive dry month along the eastern seaboard, further intensifying long-term drought conditions. Most of the Alaska stations and the primary stations in northern Hawaii were dry during December. This overall pattern is evident in the following indicators:
Click here for map showing Departure from Normal Number of Days with Measureable Precipitation for December 2001
larger image
Click here for map showing Maximum Number of Consecutive Days with No Measureable Precipitation for December 2001
larger image
Click here for map showing Statewide Precipitation Ranks for October-December 2001
larger image
Click here for map showing Statewide Precipitation Ranks for January-December 2001
larger image

Two other drought-related monitoring tools are the Vegetation Health Index and the Keetch-Byram Drought Index:

  • NOAA satellite observations of vegetation health from early January reveal continued stress on vegetation in parts of the southwestern U.S., including western Texas. The VHI product becomes less useful as vegetation goes dormant during the winter.
  • The Keetch-Byram Drought Index (KBDI) is used by the National Interagency Fire Center to monitor the risk of wildfires. The end of December KBDI showed dry conditions along the eastern seaboard and from the northern Plains to the intermountain West. The Forest Service fire danger analysis indicated a continuing risk of wildfires over parts of the mid-Atlantic and Southeast states by the end of December.


Click here to go to Top of Page Western U.S. Drought

A moist Pacific flow continued to bring wet winter storms to a large part of the western U.S. during December, ending short-term meteorological drought over much of the Pacific Northwest and West regions. The Pacific Northwest had the 18th wettest October-December on record during 2001, bringing well above normal water content to the mountain snowpack. However, long-term drought remained, with many reservoirs still well below normal in the region and 2001 closing as the 27th driest year on record (see graph to right below). Highlights:

  • Declared drought emergencies continued in three western states (Washington, Oregon, and Idaho).
  • Conditions improved in Idaho with above-normal 3-month precipitation, mountain snowpack, and modeled soil moisture. But the drought is far from over, as reservoir levels are still low with combined storage for Idaho's 21 reservoirs and lakes at third lowest since 1958. The Salmon Falls Reservoir (south of Twin Falls in central Idaho) level is the lowest since December 1962.
  • December precipitation brought short-term relief to western Texas, however severe long-term moisture deficits persisted.
Click here for graph showing Pacific Northwest region January-December precipitation for 1895-2001
larger image
Click here for graphic showing Pacific Northwest Region Precipitation Anomalies, January 1998 - December 2001
larger image
Click here for graphic showing West Region Precipitation Anomalies, January 1998 - December 2001
larger image

Much of the western rain and snow of the past three months have bypassed Montana. The state has suffered from dry conditions for the last three years, causing many wells to go dry, with 2001 ranking as the eleventh driest year on record statewide. The last five months have been persistently dry, giving the state the fourth driest August-December on record (see graph below left). The December 2001 statewide Palmer Drought Index is nearly as severe as the droughts of the 1930's (see graph below right). In nearby Wyoming, drought has drained reservoirs and stunted shrubs used by deer and antelope for winter forage, putting the wildlife at risk.
Click here for graphic showing Montana Statewide Precipitation Anomalies, January 1998 - December 2001
larger image
Precipitation Ranks (out of 107 years)
for Montana, 2001
Period Rank
Dec 36th driest
Nov-Dec 23rd driest
Oct-Dec 18th driest
Sep-Dec 18th driest
Aug-Dec 4th driest
Jul-Dec 18th driest
Jun-Dec 39th driest
May-Dec 18th driest
Apr-Dec 18th driest
Mar-Dec 17th driest
Feb-Dec 14th driest
Jan-Dec 11th driest
Click here for graphic showing Montana Statewide August-December Precipitation, 1895-2001
larger image
Click here for graphic showing Montana Statewide Palmer Drought Index, January 1895 - December 2001
larger image


Click here to go to Top of Page Eastern U.S. Drought

December brought the third consecutive month of very dry conditions to the east coast. In the Northeast region, 2001 had the second driest October-December on record while it was the third driest for the Southeast.

Click here for graphic showing Southeast Region Precipitation Anomalies, January 1998 - December 2001
larger image
Click here for graphic showing Southeast Region Precipitation, October-December, 1895-2001
larger image

With reservoir storage and ground water supplies well below seasonable averages and, in some cases, at record low levels, the Delaware River Basin Commission declared a drought emergency in mid-December in the 13,539 square-mile watershed which drains portions of New York State, Pennsylvania, New Jersey, and Delaware.

Click here for graphic showing Northeast Region Precipitation Anomalies, January 1998 - December 2001
larger image
Click here for graphic showing Northeast Region Precipitation, October-December, 1895-2001
larger image
Precipitation Ranks (out of 107 years)
for the Northeast Region, 2001
Period Rank
Dec 22nd driest
Nov-Dec 8th driest
Oct-Dec 2nd driest
Sep-Dec 8th driest
Aug-Dec 4th driest
Jul-Dec 3rd driest
Jun-Dec 7th driest
May-Dec 7th driest
Apr-Dec 2nd driest
Mar-Dec 8th driest
Feb-Dec 6th driest
Jan-Dec 4th driest

As shown on the Palmer Hydrological Drought Index map to the right, the drought in the east has two epicenters of severity: Maine and South Carolina.
  • Maine had the driest year in 2001 and also the driest rank for several seasons (see table below).
  • The persistent lack of precipitation resulted in a rapid increase in drought severity, giving the state the worst Palmer Drought Index on record by the end of the year.
  • The drought in Maine has resulted in record low well levels and streamflows at many places with uncounted wells going dry, and Governor King urgently requested citizens to conserve water. By mid - December, some public water utilities had imposed conservation measures, and several were asking for voluntary action by consumers.
Click here for map showing Palmer Hydrological Drought Index, December 2001
larger image

Click here for graphic showing  Maine Statewide Precipitation, January-December, 1895-2001
larger image
Click here for graphic showing Palmer Drought Index for Maine, January 1900 - December 2001
larger image
Precipitation Ranks (out of 107 years)
for Maine, 2001
Period Rank
Dec 7th driest
Nov-Dec 1st driest
Oct-Dec 1st driest
Sep-Dec 4th driest
Aug-Dec 1st driest
Jul-Dec 1st driest
Jun-Dec 2nd driest
May-Dec 1st driest
Apr-Dec 1st driest
Mar-Dec 1st driest
Feb-Dec 1st driest
Jan-Dec 1st driest

South Carolina had the driest October-December, August-December, and July-December, and the second driest year on record in 2001, giving rise to a statewide Palmer Drought Index which is comparable in severity to the worst droughts of the last 100 years. As noted by the state Department of Natural Resources,
  • Low streamflows and lack of precipitation have caused many South Carolina lake levels to continuously drop.
  • Ground water levels have also significantly fallen. Since the drought began in 1998, the annual mean water level in a shallow sand monitoring well in Aiken County has dropped approximately 2 feet (0.61 meter).
  • According to the S.C. Forestry Commission, the drought contributed to the second worst southern pine beetle outbreak since records began in the early 1960s, with timber losses due to the beetles estimated at $76 million during 2001.
  • The Forestry Commission also noted that 2001 had the worst fall fire season since 1991, with 2,308 fires burning 12,565 acres (5085 hectares) from September through December. This is double the average number of fires and four times the number of acres normally burned during the four-month fall season.

Click here for graphic showing South Carolina Statewide Precipitation, January-December, 1895-2001
larger image
Click here for graphic showing Palmer Drought Index for South Carolina, January 1900 - December 2001
larger image
Precipitation Ranks (out of 107 years)
for South Carolina, 2001
Period Rank
Dec 9th driest
Nov-Dec 4th driest
Oct-Dec 1st driest
Sep-Dec 3rd driest
Aug-Dec 1st driest
Jul-Dec 1st driest
Jun-Dec 3rd driest
May-Dec 3rd driest
Apr-Dec 2nd driest
Mar-Dec 4th driest
Feb-Dec 3rd driest
Jan-Dec 2nd driest

Click here to go to Top of Page Additional Contacts:

Damage due to the drought has been summarized by NOAA and the Office of Global Programs in the Climatological Impacts section of the Climate Information Project. Crop impact information can be found at the USDA NASS (National Agricultural Statistics Service) and Weekly Weather and Crop Bulletin pages. Drought statements by local National Weather Service Offices can be found at the NWS Hydrologic Information Center. Drought threat assessments and other information can be found at NOAA's Drought Information Center. Additional drought information can be found at the National Drought Mitigation Center, the USDA's National Agricultural Library, the interim National Drought Council, and the NOAA Paleoclimatology Program. The following states have set up web pages detailing current drought conditions and/or their plans to handle drought emergencies:

Delaware - Delaware River Basin (DE-NJ-NY-PA) - Florida Panhandle - Georgia - Hawaii - Idaho - Kentucky - Maryland - Missouri - Montana-1 - Montana-2 - Nebraska - New Jersey - New Mexico - North Carolina - Oklahoma-1 - Oklahoma-2 - Oregon-1 - Oregon-2 - Pennsylvania-1 - Pennsylvania-2 - South Carolina - Texas - Vermont - Washington - Wyoming

For additional information on the 2001 wildfire season please see the National Interagency Fire Center web site or the U.S. Forest Service Fire and Aviation web site.

NCDC's Drought Recovery Page shows the precipitation required to end or ameliorate droughts and the probability of receiving the required precipitation.

Additional climate monitoring graphics can be found at the Climate Prediction Center's monitoring pages:


SouthWest Asia Eastern Mountains December 2001 Drought

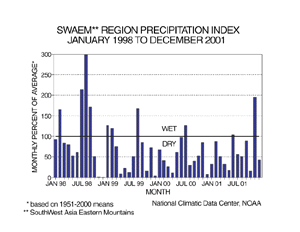
The region in and around the eastern mountains in southwest Asia has been suffering from drought for the last three years. Climate data from this region is frequently unavailable on an operational near-real time basis and historical data is incomplete in many cases, which makes it difficult to compute a regional drought index. To complicate matters, the "normal" climate of the region varies considerably from mountains to plains and the region is generally classified as a desert.

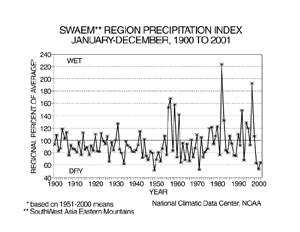
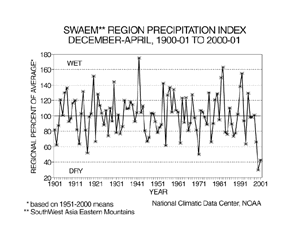
In order to assess the magnitude of the dryness in the southwest Asia eastern mountains region, a precipitation index was created from the precipitation data for ten stations that currently report operationally and that have reasonably complete historical records. The impact of missing data was minimized by using the following methodology. Long-term monthly averages for the twelve months, January - December, for each station were computed over the 1951-2000 period. These 50-year average monthly precipitation values were used as a reference base. The percent of average precipitation for each month and each year in the record for each station was computed using the station's respective monthly base values. These monthly percentages were averaged for the ten stations to produce a seasonal precipitation (i.e., "drought") index for the region.

As seen in the graph below left, the region has experienced below-average precipitation for much of the last three years. The annual precipitation index (graph below right) shows how the dryness compares to the 20th century record. The last three years were very dry by this index, having ranks of fifth driest for 1999, third driest for 2000, and seventh driest for 2001 (out of 102 years).

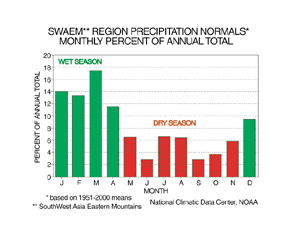
There is a pronounced seasonality to the precipitation regime, with winters generally being wetter than summers (see graph below left). Here the winter wet season is defined as December through April. The dryness during the last three winter seasons has been even more pronounced (see graph below right), with 1998-99 ranking as the eleventh driest, 1999-2000 as the driest, and 2000-01 as the second driest (out of 101 winters).

During the past few winters, anomalously strong upper level high pressure ridging (associated with sinking air and a lack of precipitation-producing weather systems) centered over the Middle East has severely limited precipitation amounts in the southwest Asia eastern mountains region, resulting in increasing water deficits that have contributed to the severity of the current drought. This circulation regime is also evident in the average annual pattern for the past three years.


Citing This Report

NOAA National Centers for Environmental Information, Monthly Drought Report for December 2001, published online January 2002, retrieved on March 18, 2024 from https://www.ncei.noaa.gov/access/monitoring/monthly-report/drought/200112.