Contents Of This Report:
- National Overview
- Palmer Drought Indices
- Regional Drought Watch:
- Summer 2000 Rain Days
- Drought and Streamflow
- The Summer 2000 Heat Wave

 National Overview
| During the summer (June-August) of 2000, many parts of the United States experienced an intensifying drought and heat wave. The drought had several time and space scales. For the southeast states, 2000 brought the third year of dry conditions, while the drought in the southern Plains was associated with extreme short-term dryness during July and August. States in the inter-mountain West were especially hard hit, with hot and persistently dry conditions giving rise to the worst wildfire season in the past 50 years. According to NOAA's Climate Information Project, as of the end of August 74,571 fires had burned 6.6 million acres across the U.S.
On a national scale, by the end of August over a third (35%) of the contiguous U.S. was experiencing severe to extreme drought as measured by the Palmer Drought Index. This is a rapid increase over the last three months, nearly doubling from about 20% at the end of June (see graphic below left). Based on areal extent, the summer 2000 drought is as widespread as the 1988 drought but ranks behind the more extensive droughts of the 1950's and 1930's (see graphic below right). The spatial pattern of the 2000 drought is similar to the pattern at the peak of the 1950's drought (August 1954) but different from that at the 1930's peak (August 1934). |
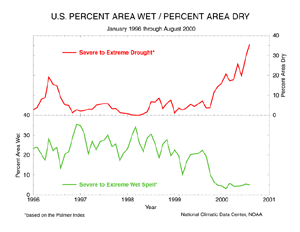 larger image |
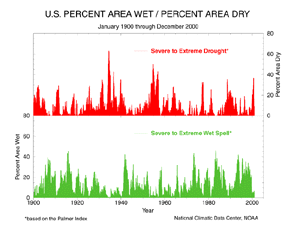 larger image |

 Palmer Drought Indices
| The Palmer Z Index shows how monthly moisture conditions depart from normal (short-term drought and wetness). Much of the western U.S. experienced persistent short-term drought during the summer months, while severe short-term drought was widespread over the southern Plains and southeastern U.S. during July and August 2000. |
| Numerous wildfires have raged across the western U.S. in many of these extremely dry areas, with fires developing near the end of summer in Texas, Oklahoma, Louisiana, and some southeastern states (details can be found at the National Interagency Fire Center web site). The animated maps to the right show the geographical pattern of the moisture anomalies for the last 12 months. On these maps, the red shading denotes dry conditions while the green shading indicates wet conditions. | 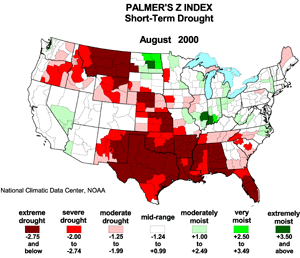 larger animated image |
 larger animated image |
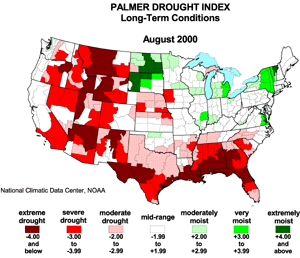
The Palmer Drought Index maps show long-term (cumulative) drought and wet conditions. By the end of summer 2000, severe to extreme long-term drought stretched in a near-continuous band from the southeastern U.S. to the southern Plains, then up along the Rocky Mountain states and into the Far West, with a pocket of severe drought in the central Plains. Unusually wet conditions were concentrated in the northern Plains, parts of the Great Lakes, and into the Northeast, covering about 5 percent of the country. The animated maps show how the geographical pattern of the long-term moisture conditions has changed over the last 12 months. On these maps, the red shading denotes drought conditions while the green shading indicates wet conditions. |
| The Palmer Crop Moisture Index is computed on a weekly basis by the National Weather Service's Climate Prediction Center and is useful for following the impact of precipitation anomalies on agriculture. The animated CMI maps to the right show how the geographical pattern of topsoil moisture conditions has changed from March 4th through September 2nd, the growing season-to-date. | 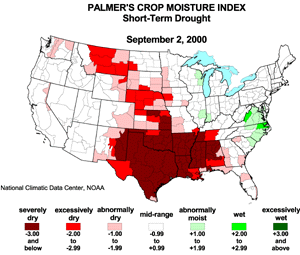 larger animated image |
| During much of the summer, excessive topsoil dryness has persisted across much of the Southeast and southern Plains, stretching into the northern High Plains. According to the U.S. Department of Agriculture's September 6 Weekly Weather and Crop Bulletin, much of the pasture land in drought-stricken states was in poor to very poor condition: NE (89%), MT (77%), AL (77%), MS (76%), LA (76%), AR (74%), TX (73%), WY (70%), and ID (63%). On these maps, the red shading denotes dry conditions while the green shading indicates wet conditions. |

 Regional Drought Watch:
 Standardized Precipitation Index
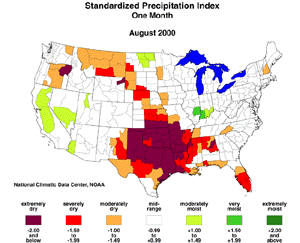
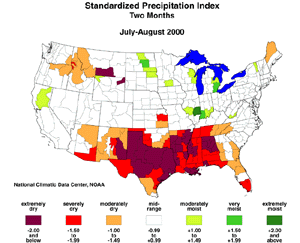
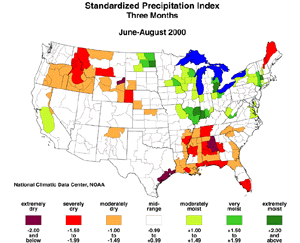
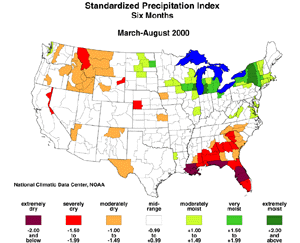
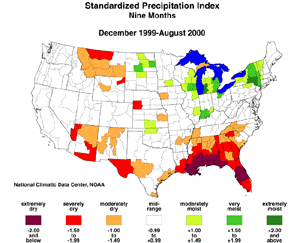
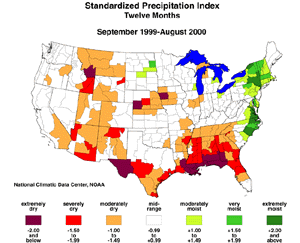
| The Standardized Precipitation Index (SPI) is another way of measuring drought. The SPI is an index based on the probability of recording a given amount of precipitation, and the probabilities are standardized so that an index of zero indicates the median precipitation amount (half of the historical precipitation amounts are below the median, and half are above the median). The index is negative for drought, and positive for wet conditions. As the dry or wet conditions become more severe, the index becomes more negative or positive. While the Palmer Drought Index is a water balance index that considers water supply (precipitation), demand (evapotranspiration) and loss (runoff), the SPI is a probability index that considers only precipitation.
The six maps below show the August 2000 spatial patterns of SPI for six different time frames ranging from one month (short-term conditions) to twelve months (long-term conditions). When taken together, they give a combined geographical and temporal picture of the severity of the precipitation deficits. The maps indicate, for example, that the drought in the southern Plains is a short-term (July-August) phenomenon, while the southeast U.S. and northern Rockies have been experiencing severe drought for many months. Although intermittent rain has fallen over the southwestern U.S. and central Plains during the last six months, the long-term indices (out to 12 months) indicate severe drought conditions. |
 larger image |
 larger image |
 larger image |
 larger image |
 larger image |
 larger image |
 Deep South Drought
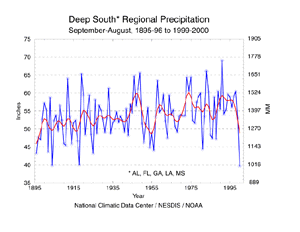
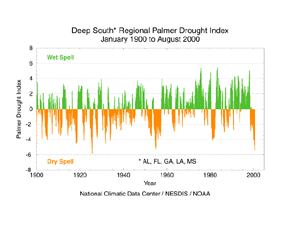
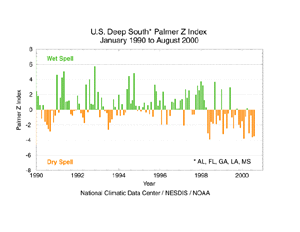
| The U.S. Deep South (which includes the states of AL, FL, GA, LA, and MS) has been experiencing precipitation deficits since mid-1998 (see chart top right). Only five months out of the last 28 have had a positive Z Index (wet conditions). The 12-month period, September 1999-August 2000, has been the driest such period regionwide since national records began in 1895 (see chart middle right). The persistent extreme dryness in recent months has had a cumulative effect, leading to the rapid intensification of long-term drought. The regionwide Palmer Drought Index has reached intensity levels comparable to the severe drought of the 1950's, and second only to the drought of 1925 (see chart bottom right). Many trees are dying as a result. For example, Florida forestry officials estimate losses of up to 4 million trees this year, four times normal. According to news reports, dozens of cities in Georgia faced cricital water shortages by summer's end. The University of Georgia estimated state agricultural losses at $689 million. Heavy rains in early September brought temporary relief to some areas.
|
 larger image
|
 Southern Plains Drought
 larger image |
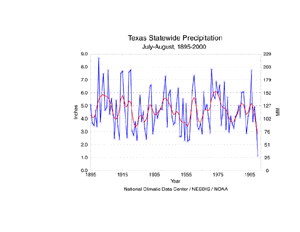
The southern Great Plains experienced record dryness this summer. In Texas for example, July-August 2000 was the driest such period on record (see chart to left), resulting in numerous wildfires and, according to the Texas Agricultural Extension Service, agricultural losses of about $600 million. Several months during the last three years have had heavy precipitation, including June 2000, which has tended to offset the long-term cumulative effects of the drought. |
| However, in spite of the above-normal precipitation during March and June 2000, the cumulative effect of the precipitation shortfalls during the last 13 months has resulted in an intensification of the statewide long-term Palmer Drought Index to levels comparable to the major droughts of the last 40 years. |
 Western Drought and Wildfires
| The Palmer Z Index is used as a measure of short-term moisture shortages. Research by Tom Karl (Journal of Applied Climatology, 1986) suggests that it may be a useful indicator of fire potential. An overlay of wildfire location (as of August 17, 2000) on top of the Palmer Z index map for July 2000 clearly shows the strong correspondence between drought and the incidence of wildfires. |
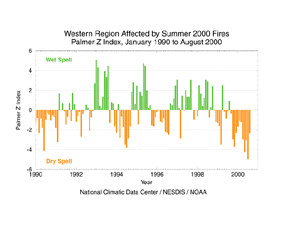
| Most of this summer's wildfires have occurred in areas experiencing moderate to extreme drought. The aggregate Palmer Z Index for the western fire region has been persistently negative (very dry) for the last twelve months (see chart to right). This persistent extreme dryness has resulted in a rapid intensification of long-term cumulative drought conditions, with the Palmer Drought Index for the western fire area reaching its most extreme level since the 1930's.
|
 larger image |
 larger image |
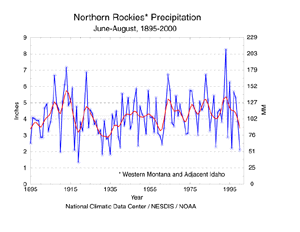
In the Northern Rockies (Western Montana and Adjacent Idaho), which has been especially hard-hit by wildfires this summer, precipitation during the June-August period ranked 2000 as the sixth driest summer for the period of record that begins in 1895 (see chart to left). Fifteen of the last 18 months for this area have been drier than normal, according to the Palmer Z Index. |
| Several wildfires continued to burn in the Northern Rockies as of early September. Although recent storms in northern Idaho and western Montana have brought some relief, the National Interagency Fire Center indicated that extreme and severe drought conditions will continue the fire threat. According to experts, the largest fires were expected to burn "until the snow falls." |
 Central Plains Drought
| Late spring and summer have been very dry in parts of the central Great Plains. For example, four of the last five months have had below-normal precipitation in Nebraska (see chart to right), where 89% of the pasture land was in poor to very poor condition and several wildfires had started. As indicated by the 12-month SPI map, long-term conditions have been severe, with September 1999-August 2000 ranking as the tenth driest such period for Nebraska since records began in 1895. | 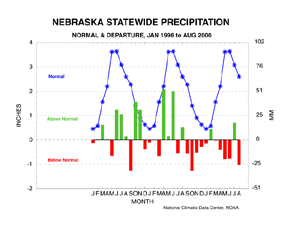 larger image |

 Summer 2000 Rain Days
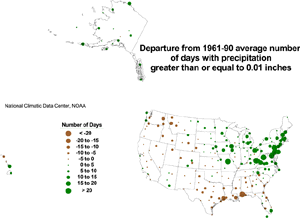
| The dryness of June-August 2000 is reflected in a map of departures from the normal number of rain days (map bottom left). Parts of the southern Great Plains and Southeast had up to 25 fewer days with rain than the long-term average. Many stations from the Southeast and southern Great Plains to the northern Rockies and Pacific Northwest had 10 to 20 fewer days with rain than normal. The map shows unusual wetness from the Northeast and central Atlantic states to the upper Mississippi Valley.
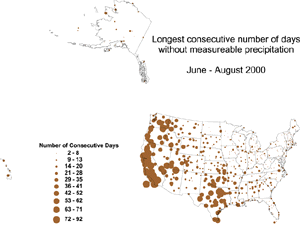
Records for longest number of consecutive days with no rain were set this summer in parts of the southern Great Plains (details can be found on our August and September extremes pages). A map showing the longest number of consecutive days with no measureable rainfall for June-August 2000 is shown at the bottom right. Long dry spells are normal for this time of year in the southwestern U.S. However, the severe drought is reflected in unusually long dry spells in the south central and northwestern parts of the country. |
 larger image |
 larger image |

 Drought and Streamflow
| Low streamflows have been associated with the long-term drought in many areas. The monthly streamflow maps for July and August 2000, maintained by the United States Geological Survey, show persistently low streamflows along the Rocky Mountains and especially in the southeastern U.S. Streams at or near record low levels resulted in serious water shortages in several Georgia communities. |

 The Summer 2000 Heat Wave
 larger image |
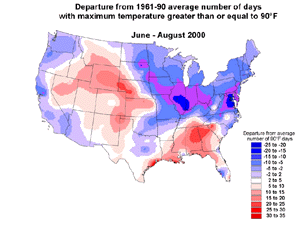
The Summer 2000 drought was accompanied by unusually hot temperatures. This is reflected in the departure from normal number of days with maximum temperature equal to or exceeding 90 degrees F (see map to left). Large parts of the Southeast, central Plains, and Rocky Mountains were especially warm, with some areas having more than 20 additional 90-degree days. A cold spell affected the southern Plains during June, but the heat was relentless during July and August from the Southeast, across the southern Plains, and into the northern Rockies. |
| The South region (from Texas to Kansas, eastward to Mississippi) had the fourth warmest July-August since records began in 1895, and the northern Rockies (western Montana and adjacent Idaho) had the tenth warmest July-August since 1895. The day-to-day persistence of the hot weather in the southern Plains is reflected in below-normal day-to-day temperature variability in this area during July and August. |
| The map to the right shows the longest run of consecutive days with maximum temperature equal to or exceeding 100 degrees F during June 1-August 31, 2000. Days with 100-degree heat are common in the southwestern U.S. during summer, but the long runs in the Southeast and southern and central Plains reflect the unusual heat wave of this summer. Records for strings of 80-, 90-, or 100-degree days, as well as record maximums for individual days, were set at many locations from the Southeast and southern and central Great Plains to the intermountain West and northern Rockies. Details can be found on our August and September extremes pages. | 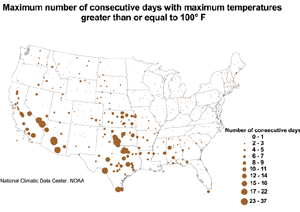 larger image |

 Additional Contacts:
| Crop impact information can be found at the USDA NASS (National Agricultural Statistics Service) and Weekly Weather and Crop Bulletin pages. Drought statements by local National Weather Service Offices can be found at the NWS Hydrologic Information Center. Drought threat assessments and other information can be found at NOAA's Drought Information Center. Additional drought information can be found at the National Drought Mitigation Center, the USDA's National Agricultural Library, and the NOAA Paleoclimatology Program. The following states have set up web pages detailing their drought emergencies:
New Mexico - North Carolina - Oklahoma - South Carolina - Texas For additional information on the 2000 wildfire season please see the National Interagency Fire Center web site or the U.S. Forest Service Fire and Aviation web site. |
 NOAA's National Centers for Environmental Information
